Optimal Shape Design of Medium-Speed Train based on
Aerodynamics Performance
Sugiono Sugiono1,*, Agung Sedaju2, Oyong Novareza1, Dwi H. Sulistyorini2
1
Department of Industrial Engineering, Universitas Brawijaya, Indonesia
2
PT. Industri Kereta Api (INKA), Madiun, Indonesia
Received October 1, 2019; Revised December 20, 2019; Accepted December 23, 2019
Copyright©2019 by authors, all rights reserved. Authors agree that this article remains permanently open access under the terms of the Creative Commons Attribution License 4.0 International License
Abstract
Train aerodynamic performance greatly affects the efficiency of driving energy and passengers’ comfort. This paper aimed to simulate several forms of train models that produce low and stable aerodynamic obstacles as well as low noise at medium speeds of 120 – 1 50 km/hr. The first step to do was the study of literature on train design models, aeroacoustics, aerodynamics, and human ergonomics. Existing 3D CAD and S-R train models with slender ratios γ = 4, 6, and 8 were tested using Computational Fluid Dynamics (CFD) and Computational Aerospace (CAA) to determine the impact of airflow. The models that have been built were tested at medium speeds of 120 to 150 km/hr. The final simulation results showed that the existing train produced a drag coefficient (Cd) of around 1.27, average noise of 35.9dB, and fuel requirements by 1.7 liters/km. It is different from trains with a slenderness ratio = 6 that produces the best aerodynamic performance with a drag coefficient (Cd) around 0.436, average noise of 9.4 dB, and fuel consumption of 0.73 liters/km. The results concluded that the medium speed needs to adjust the S-R train model with a slenderness ratio γ = 6 that can produce an aerodynamic performance to improve train user comfort and save fuel.Keywords
Aerodynamics, Medium-speed Train,Ergonomics, Fuel Consumption Train
1. Introductions
Demands for driving comfort and energy efficiency become the most consideration for train passengers at the end of this decade. The existence of mass transportation such as trains is one of the right solutions for high levels of traffic density and the need for high mobility. This is the reason why the train body design is associated with aerodynamics performance and this problem continues to
develop along with the development of technology and information systems. There have been many researchers who carried out the train body innovation both in terms of ergonomic, aero acoustic, and aerodynamic aspects. Groenesteijn et al. (2014), Dobson (2015), Naweed (2014), and Myrtek et al. (2001) explained the importance of meeting ergonomic aspects for railroad transportation, for example, knowing the visual needs of drivers and the level of their stress when operating trains.
The examples of other train studies were conducted by Pyoung Jik Lee and friends (2013), and Xiao-hui Xiong and friends (2018), which explained about noise originating from trains. Noise from aerodynamics, engines, and friction with railroads will have an impact on the lives of residents around the railroad tracks. Several studies to determine the impact of aerodynamics performance on train stability were carried out by Stathopoulos 1997, 2002, 2006, Baker 2007, Mochida and Lun 2008, Blocken et al. 2011, Moonen et al. 2012, and Blocken 2014. Furthermore, B. Strom (2008), Ioan, and Sebesan & Bogdan (2013) stated that the improvement in the value of drag force, as one of the main elements of aerodynamics performance, will impact the railroad fuel savings. A previous study describing the aerodynamic barriers in coal-bearing cars showed that a 25% reduction in drag car would be equal to 5% of fuel savings (Stodolsky, F., 2002).
A study on high-speed trains such as Japan's shinkansen
tracts on the railroad track in Sulawesi, Indonesia, which has different land topography than other regions. The courage to use Computational Fluid Dynamics (CFD) software to simulate aerodynamics across the train body is an advantage in design efficiency.
2. Research Theory
The demand for more comfortable railroad designs for passengers and railroad officers cannot be separated from the resulting aerodynamic performance. Among those performances are the received noise level, the stability of the train car body, and the vibrations that occur. Aerodynamics performance is also very closely related to the fuel efficiency spent, which depends on the size of the drag force coefficient (Cd). To support this research, some basic theories about aerodynamics, ergonomics, product design processes, and energy efficiencies will be discussed concisely.
2.1. Aerodynamics Flow and Impacts
Aerodynamics is knowledge about the analysis of the flow of air that passes through an object with a certain shape so that the fluid element changes. A shift in fluid elements with high density can cause flow turbulence that will change the balance and produce noise. The effect of external aerodynamics on the vibrations of train cars is an important factor when investigating comfortable driving conditions. The level of pressure coefficient fluctuation (Cp) along the train cars is needed to clarify aerodynamic input in train vibrations. A uniform pressure distribution profile will better produce high vibration signals (2631Alam et al., 2007). Low-frequency vibrations (less than 0.5 Hz) as mentioned in ISO 2631 can cause discomfort to passengers such as looking pale, sweating, nausea, and vomiting (Antony, 1992). Finite Element Analysis (FEA) combined using CFD software can be used to detect the level of vibration problems due to the airflow on trains. Mesh quality, external flow, material objects, and restraints are the main subjects for establishing the value of vibration in the design of train cars. A vibration study of car body models (3D models) is presented in five directions of motion based on coordinates X, Y, and Z (Kurowski, P. M., 2011).
The pressure configuration and velocity distribution correlations can be explained using the Bernoulli equation, which works on flow without turbulence, stable conditions, constant density, and no friction between the fluid and the environment. This equation is called 'energy conversion,' where the amount of pressure, potential, and kinetic energy per unit volume is constant at any point (Jhon, 2009; Watanabe, 2007). Based on Equation 1, it can be stated that the pressure increase in the train design will directly decrease the speed of fluid dynamics at the same point.
c V
p+ 2=
2 1
ρ (1) Technically, the main aerodynamic factor of train design is divided into two categories: drag force coefficient (Cd)
and lift force (FL). Drag force coefficient is defined as the
aerodynamic horizontal force, which depends on several parameters: fluid density (ρ), fluid velocity crashing the train (V), and the area of the frontal train (A). The ideal train design aims to produce the lowest drag coefficient while producing high acceleration and exceptional fuel savings. Equation 2 shows the drag coefficient equation, which is a non-dimensional parameter (Watanabe, 2007).
A V
Fd
Cd 2 2
ρ
= (2)
where:
Cd = drag force coefficient Fd = Drag force (N)
V = speed of air relative to car (m/s) ρ= density of air (Kg/m3
) A = frontal area of vehicle (m2)
Lift force parameters are used to investigate the effect of aerodynamics on trains. Formula 3 below indicates the aerodynamics formulations for train lift force (Watanabe, 2007). This will change fuel consumption and overall train stability. As long as the total lift coefficient is negative, the compressive force will work on the body of the train car (the heavier/more stable). The reverse condition (positive value = reducing the weight of the train) occurs when the average pressure at the top of the vehicle is lower than that under the vehicle described by the pressure coefficient configuration (Cp). Lifting force will reduce the train wheel load on the track and grip substantially. Low wheel load will have a positive impact on the target of fuel savings, but conversely, it will also produce an unfavorable effect on stability. Investigating the relationship between drag and lift force is an important part of describing aerodynamic configurations through the train model.
A V FL 2 2 1ρ
= CL (3)
where;
CL = Lift Force coefficient
Müller, E. A., & Obermeier, F. (1988), Manela, A. (2011) and Kelly, M. E., Duraisamy, K., & Brown, R. E. (2008) explained that the flowing fluid pattern depicted in vorticity is the main source of noise in aerodynamics. The main unit of noise is decibels (dB) as a logarithmic function. In general, noise in aerodynamic problems is defined as Sound Pressure Level (SPL). The SPL formulation is written in Equation 4 below (Watson R., Downey O., 2008):
)
/
(
log
20
)
(
dB
10P
P
refSPL
=
(4)Where;
Pref = sound power reference (=2. 10-5 Pa)
The importance of noise control in transportation can improve the comfort and health of all passengers, train officers, and even residents around the station and the train tracks. If the conditions are exposed to noise, it can cause interference with train concentration and performance. It even causes someone to be exposed to irritability. According to the Minister of Living Environment No. KEP-48/MENLH/11/1996, the noise in the train station can not be more than 70dB.
2.2. Energy on Train
Ioan Sebesan and Bogdan Tarus (2015) proposed that in the specific case of the long cylindrical shape (as used in the locomotive casing), there are two most important coefficient, namely frontal aerodynamic coefficient (CL) and lateral aerodynamic coefficient (Cd). In calculus aerodynamic calculations, the one playing the most roles is the part of the frontal coefficient. Fuel consumption calculations are performed to determine the effect of reducing drag on locomotive fuel consumption (James C. Paul et al., 2009).
Ideally, the train profile will minimize aerodynamic drag which will require efficient fuel. Streamline form has a profile that has a low resistance to movement in fluids (Condie, 2014). Before determining the amount of fuel consumption, it is necessary to determine the extent of air resistance in the body and locomotive of the train by defining the drag area (Sd) in advance. Drag area in ft2 units is defined as the product of the frontal area (A) with the drag coefficient (Cd) as shown in formula 5 below:
Sd = A. Cd (5) Equation 5 is a major part of train fuel consumption. Fuel requirements, of course, also depend very much on train speed and train weight. Assuming a constant train speed, the formulation of train requirements, according to Paul & Johnson (2009), is as follows:
) 00256 . 0 0015 . 0 ( 000 . 1 2 CW Sd W K miles per Consumed fuel Gallon
v
+ + = ( 6) Where:K = fuel consumed per distance travel, = 0.2038 gallons/1000 miles/lbf.
W = train weight lbf
V = Train Speed (miles/hour).
C = Hill factor, C = 0 forl level reute and C = 0.0007 for hill reutes.
Sd = Consist Drag Area (ft2)
The shape of high-speed trains’ nose is an important control factor that affects not only aerodynamic performance, but also aerodynamic noise (Y. An et al., 2017). In engineering practice, the shape of the nose becomes increasingly streamlined as design speeds increase, for example, Japanese high-speed L0 series maglev train even has a slim nose along 15 m (slope ratio reaches 8.8). Kai Cui et al. (2012) stated that the locomotive model slenderness ratio would be able to reduce aerodynamic barriers to a certain value. The optimal slenderness ratio is 8.3 for the sword form (S) and 8 for the rocket (R) form. By only considering aerodynamic obstacles, the S-S train model is the best, whereas if considering the lift force factor, the S-R model is the best. The distribution of train obstacles is divided into three parts: the train locomotive which contributes to drag force by 43%, car body by 24%, and tail by 33%. Moreover, Kai Cui et al. defined the slenderness ratio (γ), which depends on the length of the streamlined part (Ln) and the cross-sectional area of the train body (A), as shown in formula 7.
π
γ
=
Ln
/(
A
/
(7)Computational Fluid Dynamics (CFD) and Computational Aeroacoustics (CAA) are numerical models in a program that can be used to simulate fluid behavior precisely. CFD and CAA work in nonlinearity conditions where mathematical analysis techniques are difficult to use. CFD can describe the condition of flow through the parameters of pressure, temperature, viscosity, vorticity, etc. Whereas CAA is used to describe how much noise due to fluid turbulence (vortices) can be produced. The target of the simulation is convergence iteration, which at certain stages will produce a steady-state.
3. Research Methodology
= 4.6, and 8. Model tests will be carried out on medium-speed trains (120 km/hr to 150 km/hr) at several level: 120 km/hr, 130 km/hr, 140 km/hr, and 150 km/hr. Tests were carried out with several assumptions: constant train speed, straight train tracks, and environmental wind speeds are considered zero (much smaller than train speed), what size of the train is an existing train with height = 3.558m, width = 3,140m, and carriage length = 12.50m. Weight of locomotive = 90,000 kg, weight of empty carriage = 15,000 kg, and number of carriages in the test model = 5 units.
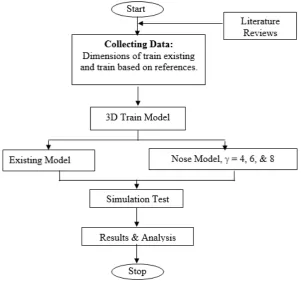
CFD simulations are used to determine the value of the pressure distribution around the train's head, car, and tail. CFD works with the Detached Eddy Simulation (DES) approach using a mixed algorithm between Reynolds-averaging equations (RANS) and Large Eddy Simulation (LES). Computational Aeroacoustics (CAA) simulations are used to obtain noise sources and their magnitude in dB units caused by vorticity of air passing through the train. Figure 1 explains the detailed stages of
[image:4.595.147.450.343.626.2]the research to simulate aerodynamics, aero acoustics, and vibration due to the air that hit the train. The initial to do was the collection of data as preliminary information for designing 3D CAD models of existing trains in Indonesia and the best version of the reference trains (the Sword S nose model with γ = 8). The simulation will also be compared with the S train model with a slenderness ratio of γ = 4 and 6). After the train model is finished, the next step is to define the domain constraints and boundary conditions. Simulation tests (CFD, CAA, FEA) with train speeds of 120-150 km/h are performed for each existing model and the S model. Other simulation data inputs include environmental temperature, relative humidity, wind speed, and direction. The results of the test will be the basis for assessing the impact of the train model on fuel consumption needs and ergonomic levels on medium speed trains (see formula 6). Therefore, at the end of the discussion, it will be concluded the best recommendation model to use on Sulawesi tracks planned to operate at medium speed.
4. Results and Discussions
Figure 2 shows that the 3D designs for medium-speed existing trains and recommended high-speed trains. As mentioned in the research methodology, the S Sword nose model is divided into three γ models: 4, 6, and 8. Based on formula 7, the slenderness length (Ln) is as follows:
for gamma γ = 4:
π
γ
=
Ln
/(
A
/
π
γ
x
A
/
Ln
=
π
/
88
.
6
4
x
=
= 4 x 1.48 = 5.92 m
In the same way, for γ = 6, Ln = 8.88m, and for γ = 8, Ln = 11.84m. The train tail design does not follow the train at high speed because it does not have a significant impact on aerodynamics performance due to the length of the train cars. The four train models were tested at medium speed (120 km/h - 150 km/h) to analyze the effects of aerodynamic on fuel consumption. Medium-speed trains will be supported by rails with a width of 1.435m, which are a rail widely used in the world, so it is also called the
Standard gauge. Rails are usually installed on pavements lined with gravel, also known as ballast. The ballast functions to reduce the vibration and flexing of the rail due to the weight of the train.
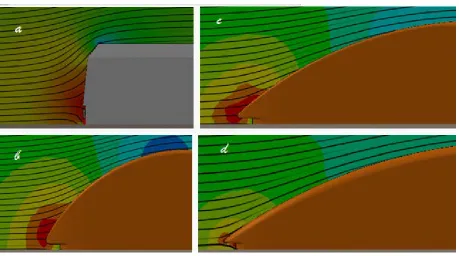
[image:5.595.73.524.374.462.2]The streamlines form has far fewer aerodynamic obstacles than not streamlines form. The streamlines form will provide an opportunity for the fluid to be able to flow properly and regularly by following its shape to produce friction and small turbulence. This condition will produce a measly Cd drag force coefficient. Figure 3 shows the results of aerodynamics performance for the distribution of pressure on the train nose on four different train models that move at a maximum speed of 150 km/h. From the contour pressure distribution, it can be explained that the existing model has greater streamlined destruction at the end of the train locomotive so that it will have a greater resistance effect. The use of the γ slenderness ratio will improve the streamlines that pass through the train, the higher the γ value, the smoother the streamline. There was no significant difference between γ = 4 and γ = 6, in contrast to γ = 8, which can distribute aerodynamics pressure properly.
[image:5.595.71.531.484.740.2]Figure 2. The locomotive shape of existing trains in Indonesia and nose S trains for ℽ = 8, 6, and 4, respectively.
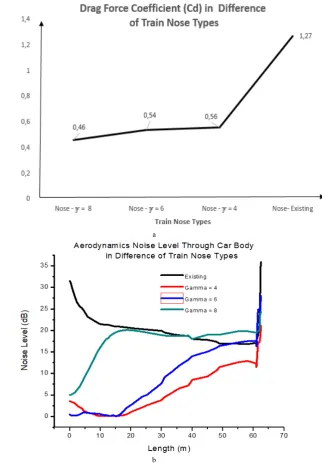
Based on formula 6, the determination of train fuel requirements is influenced by train weight (locomotive and car body), train speed, incline factors, and aerodynamic obstacles. Aerodynamics barriers (Drag force coefficient, Cd) play an important role in determining the amount of fuel consumption. This is reinforced by research conducted by Beagles & Fletcher (2013), which states that aerodynamic drag is proportional to the square of the train speed so that high-speed trains are very concerned with Cd. Statistics show that 16% of the total energy consumed by trains in the United States is used to overcome aerodynamic obstacles in transportation systems (Wood, 2003). Baker (2012) noted that reducing train aerodynamics by x% can reduce fuel consumption by 0.5* x%. Therefore, the aerodynamic barriers of railways are the
main method for reducing overall resistance and energy consumption of high-speed trains (Peters, 1983). Figure 4a explains the effect of train locomotive nose shape on the performance of aerodynamic barriers represented by Cd. The graph shows that there is a significant difference for the Cd value between the existing form (closing to the beam) and the Sword S shape, which is 1.27 for the existing form, about 0.5 (0.46 for γ = 8, 0.54 for γ = 6, and 0.56 for γ = 4) for the S shape. This form can still be optimised by refining the Sword model approaching the streamlines form. As for the aerodynamics lift performance, FL has all positive values (reducing train weight) at a maximum speed of 150 km/h with a range of 8975 N for γ = 8, 10134N for γ = 6, 9733N for γ = 4, and 7386N for existing models.
a
[image:6.595.143.466.268.734.2]b
Figure 4b shows the noise level as a result of aerodynamics passing through the car body for a variety of different models. The picture explains that the modification of the train nose model from the existing condition to the form of Sword (γ = 8, 6, 4) can reduce noise very well. On the first car body (front car), the noise value for the existing condition is very high around 34 dB and certainly higher on the train nose due to higher energy and turbulence intensity. It is different from the case with the Sword model, which tends to be very low at the zero points (the leading car). Noise level for the Sword nose models γ = 8 produce higher noise compared to Sword γ = 6 and Sword γ = 4 along the wagon with an average noise of 16.5dB compared to 5.7 dB and 7.9 dB respectively. With the same train tail model, the noise level has an increasing pattern at the end of the car because of the turbulence behind the car. At the end of the car, the noise level for existing is 35.9 dB, for γ = 8 produces noise = 24.3dB, for γ = 6 produces noise = 28 dB, and for γ = 4 produces noise = 21.1 dB. Based on noise analysis due to aerodynamics, the locomotive nose model with γ = 4 and 6 is the best choice. This noise level will interfere with the noise from the engine and the friction of
the train tracks with wheels.
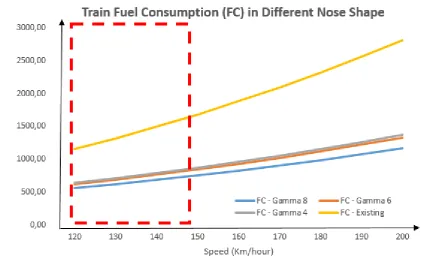
As explained in the aerodynamic resistance in figures 3, 4a and the fuel consumption formula 6, the results of the fuel consumption analysis are shown in Figure 5 below. This calculation was done by taking the weight of the locomotive type CC206 = 90,000 kg and five empty cars with a weight of 15,000 kg. Therefore, the total weight is 165,000 kg. Another assumption is that the train operates on a flat track, where the value of hill factor = 0. The research results found that train speed significantly increases fuel consumption, with simulation testing carried out at speeds of 120 km/hr to 200 km/hr. Fuel consumption for a medium-speeds train is marked by a red dashed box in the speed range of 120 km/hr to 150 km/hr. The graph indicates that the existing model requires much more fuel than the Sword model. For example, for a speed of 150 km/hr, the existing model requires 1.7 liters/km of fuel (empty train), while the model γ = 8 requires 0.75 liters/km, γ = 6 requires 0.85 liters/km, and γ = 4 requires 0.88 liter/km. The best choice for the train model is the nose sword S with γ = 8, but not significantly different from the lower slenderness ratio model.
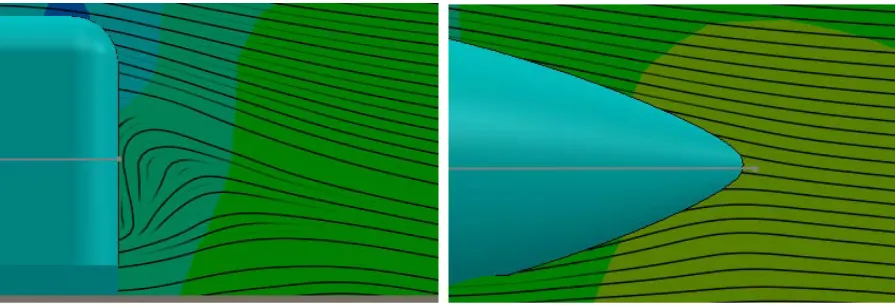
[image:7.595.100.523.360.619.2]Figure 6. Vorticity configuration of the train tail: a. Exisiting models, b. 8m Rocket-R model.
To ensure the best design, two considerations that must be compared are fuel consumption and the formed noise. The next step is to reduce the noise in the rear end of the train by replacing the model with a rocket model, as recommended by Kai Cui et al. (2012). Figure 6 shows the vorticity configuration as a sign of turbulence that can affect the number of aerodynamic barriers and also the formation of noise. The use of rocket rail tails at γ = 8 can reduce Cd by 0.457 from the previous 0.460 and reduce the average noise by 7.14 dB from the previous 24.3dB. Whereas at γ = 6, it can significantly reduce the Cd value of 0.436 from the previous 0.54 and noise level of 9.4 dB from 28 dB. Furthermore, γ = 4 can significantly reduce the Cd value of 0.47 from the previous 0.56 and noise level of 15.8 dB from 21.1 dB. Referring to these explanations, the selection of a train model fitting to medium speed is a train with a Sword S nose, a slenderness ratio γ = 6, and a tail train model Rocket R with a length of 8m. This model is predicted to be able to save fuel with a range of 0.73 liters/km for 5 cars without passengers at a maximum rate of 150 km/hour.
5. Conclusions
This research has successfully demonstrated the effect of aerodynamics barriers on fuel consumption and noise on medium speed trains (120km/hour to 150 km/hour). The reduction in fuel requirements is very significant when using the nose model Sword S slenderness ratio (γ = 4,6, and 8) compared to the existing model (beam) at medium speed. As for slenderness ratio 8, it is slightly better in terms of fuel savings, but it causes a significant noise compared to a smaller slenderness ratio. Furthermore, the slenderness ratio γ = 4 and 6 do not have much difference both in terms of fuel savings and noise generated. According to Kai cue et al. (2012, modifying the train tail by changing the shape of the beam to a rocket along 8m can significantly change aerodynamics performance. The tail rocket model is able to significantly reduce the value of the drag force coefficient (Cd) and noise level due to air
turbulence on the nose model with a slenderness ratio γ = 6. Even the performance of the S-R model γ = 6 is able to pass the S-R model train γ = 8 with a value of Cd = 0.436, the average noise level near the window (aerodynamics) = 9.4 dB and the estimated fuel demand in conditions without passengers is 0.73 liters/km.
Acknowledgements
Thanks to the Ministry of National Education of the Republic of Indonesia for supporting this paper. The authors are also grateful to the Bioengineering research group and the Laboratory of Work Design and Ergonomics, Department of Industrial Engineering, the Brawijaya University, Malang Indonesia for their extraordinary courage.
REFERENCES
[1] Alam, F., Jaitlee, R., & Watkins, S. (2007). Aerodynamic effects on an automotive rear side view mirror. Proceedings of the 16th Australasian Fluid Mechanics Conference, 16AFMC.
[2] Baker, C. J. (2014). A review of train aerodynamics Part 2 - Applications. Aeronautical Journal. https://doi.org/10.1017/S0001924000009179
[3] Baker, C., Jordan, S., Gilbert, T., Quinn, A., Sterling, M., Johnson, T., and Lane, J., 2012. Transient aerodynamic pressures and forces on trackside and overhead structures due to passing trains. Part 1 Model scale experiments; Part 2 Standards applications. Proc. Inst. Mech. Eng., Part F: J. Rail Rapid Transit, p. 1-34.
[4] Banard, R.H., Road Vehicle Aerodynamic Design, MechAero Publising, England, 2001.
[image:8.595.74.522.78.231.2][6] Beagles, A. E., & Fletcher, D. I. (2013). The aerodynamics of freight: Approaches to save fuel by optimising the utilisation of container trains. Proceedings of the Institution of Mechanical Engineers, Part F: Journal of Rail and Rapid Transit. https://doi.org/10.1177/0954409713488101 [7] Blocken, B. and Gualtieri, C. 2012. Ten iterative steps for
model development and evaluation applied to Computational Fluid Dynamics for Environmental Fluid Mechanics. Environ. Model. Softw., 33: 1-22.
[8] Blocken, B. and Stathopoulos, T. 2013. Editorial to virtual special issue: CFD simulation of pedestrian-level wind conditions around buildings: past achievements and prospects. J. Wind Eng. Ind. Aerodyn., 121: 138-145. [9] Blocken, B., 2014. 50 years of Computational Wind
Engineering: Past, present and future. J. Wind Eng. Ind. Aerodyn.,129: 69-102.
[10]Blocken, B., Stathopoulos, T., Carmeliet, J., and Hensen, J.L.M., 2011. Application of CFD in building performance simulation for the outdoor environment: an overview. J. Build. Perform. Simul., 4(2): 157-184.
[11]Broch J. T., Acoustic Noise Measurements, K.Lersen & Son, Denmark
[12]Burber Antony, (1992), Hanbook of Noise and Vibration Control, Elsevier Advanced Tech., UK.
[13]Chen, N. Y. and Zhang J. (1998). “experimental investigation on aerodynamic drag of high speed train”, Journal of the China Railway Society, Vol. 20 (5), 40-46 (in Chinese)
[14]Dobson, K. (2015). Human Factors and Ergonomics in Transportation Control Systems. Procedia Manufacturing. https://doi.org/10.1016/j.promfg.2015.07.815
[15]Gershon, R. R. M. (2005). Public transportation: Advantages and challenges. Journal of Urban Health. https://doi.org/10.1093/jurban/jti003
[16]Groenesteijn, L., Hiemstra-van Mastrigt, S., Gallais, C., Blok, M., Kuijt-Evers, L., & Vink, P. (2014). Activities, postures and comfort perception of train passengers as input for train seat design. Ergonomics. https://doi.org/10.1080/00140139.2014.914577
[17]Hemida, H., Gil, N., & Baker, C. (2010). LES of the slipstream of a rotating train. Journal of Fluids Engineering,
Transactions of the ASME.
https://doi.org/10.1115/1.4001447
[18]Ioan, S., & Bogdan, T. (2013). The impact of aerodynamics on fuel consumption in railway applications. INCAS BULLETIN.
https://doi.org/10.13111/2066-8201.2012.4.1.10
[19]John D., Computational Fluid Dynamics, McGraw Hill International Edition, 1995.
[20]Kai Cui1 et al (2012). Aerodynamic Performance Comparison of Head Shapes for High-Speed Train at 500KPH.The 2012 World Congress on Advances in Civil, Environmental, and Materials Research (ACEM’ 12) [21]Kurowski, P. M. (2011). TEACHING FINITE ELEMENT
ANALYSIS FOR DESIGN ENGINEERS. Proceedings of the Canadian Engineering Education Association.
https://doi.org/10.24908/pceea.v0i0.3839
[22]Lawson, T.V. and Penwarden, A.D., 1975. The Effects of Wind on People in the Vicinity of Buildings. Proceedings of the 4th International Conference on Wind Effects on Buildings and Structures, p. 605–622. Cambridge University Press, Heathrow.
[23]Lee, P. J., Hong, J. Y., & Jeon, J. Y. (2014). Assessment of rural soundscapes with high-speed train noise. Science of
the Total Environment.
https://doi.org/10.1016/j.scitotenv.2013.07.026
[24]Lizasoain, A., Tort, L. F., Garc\’\ia, M., Gomez, M. M., Leite, J. P., Miagostovich, M. P., … Victoria, M. (2015). Simulasi Sistem Keamanan Palang Pintu Perlintasan Kereta Api Menggunakan LabVIEW. Jom FTEKNIK Volume 2 No.2.
[25]Mochida, A. and Lun, I.Y.F. 2008. Prediction of wind environment and thermal comfort at pedestrian level in urban area. J. Wind Eng. Ind. Aerodyn., 96 (10-11): 1498-1527.
[26]Myrtek, M., & Foerster, F. (2001). On-line measurement of additional heart rate. Methodology and applications. In
Progress in ambulatory assessment: Computer-assisted psychological and psychophysiological methods in monitoring and field studies.
[27]Naweed, A. (2014). Investigations into the skills of modern and traditional train driving. Applied Ergonomics. https://doi.org/10.1016/j.apergo.2013.06.006
[28]P. R. Spalart, W. H. Jou, M. Strelets, and S. R. Allmaras, “Comments on the feaslibility of LES for wings, and on a hybrid RANS/LES approach,” Proceedings of first AFOSR international conference on DNS/LES, Ruston, Louisiana. Greydec Press, 4-8 Aug, 1997.
[29]Paul, J. C., Johnson, R. W., & Yates, R. G. (2009). Application of CFD to rail car and locomotive aerodynamics. Lecture Notes in Applied and Computational Mechanics. https://doi.org/10.1007/978-3-540-85070-0-25 [30]Peters, J. L. (1983). AERODYNAMICS OF VERY HIGH
SPEED TRAINS AND MAGLEV VEHICLES: STATE OF THE ART AND FUTURE POTENTIAL.
Technological Advances in Vehicle Design, Special Publication SP.
[31]Policy and Economics Department, 2003, The Rail Transportation of Coal, Association of American Trains, Washington, D.C., Vol. 5.
[32]Salleh, S. M., Ali, M. S. M., Shaikh, S. A. Z. S., Ishak, I. A., Shirakashi, M., & Muhammad, S. (2017). Aerodynamics characteristics around simplified high speed train model under the effect of crosswinds. ARPN Journal of Engineering and Applied Sciences.
[33]Schober, M., Weise, M., Orellano, A., Deeg, P., & Wetzel, W. (2010). Wind tunnel investigation of an ICE 3 endcar on three standard ground scenarios. Journal of Wind Engineering and Industrial Aerodynamics. https://doi.org/10.1016/j.jweia.2009.12.004
[35]Stathopoulos, T., 2002. The numerical wind tunnel for industrial aerodynamics: real or virtual in the new millennium? Wind Struct., 5 (2–4): 193–208.
[36]Stathopoulos, T., 2006. Pedestrian level winds and outdoor human comfort. J. Wind Eng. Ind. Aerodyn., 94(11): 769-780.
[37]Stodolsky, F., 2002, “Railroad and Locomotive Technology Roadmap,” Argonne National Laboratory, Argonne, IL. [38]Storms, B. (NASA). (2008). Fuel Savings & Aerodynamic
Drag Reduction from Rail Car Covers. Nasa.
[39]Suma’mur. (1995). Higine Perusahaan dan Kesehatan Kerja.
Jakarta: CV. Haji Masagung.
[40]Tian, H. Q., Zhou, D. and Xu, P. (2006). “Aerodynamic performance and streamline head shape of train”, China Railway Science, Vol. 27 (3), 47-55 (in Chinese)
[41]WATANABE, K., YOSHIOKA, H., SUZUKI, E., TOHTAKE, T., & NAGAI, M. (2007). A Study of Vibration Control Systems for Superconducting Maglev Vehicles. Journal of System Design and Dynamics. https://doi.org/10.1299/jsdd.1.703
[42]Wendt, J. F., Anderson, J. D., Degroote, J., Degrez, G., Dick, E., Grundmann, R., & Vierendeels, J. (2009). Computational fluid dynamics: An introduction. In
Computational Fluid Dynamics. https://doi.org/10.1007/978-3-540-85056-4
[43]Wood, R. M. (2003). Aerodynamic drag and drag reduction: Energy and energy savings. 41st Aerospace Sciences Meeting and Exhibit.
[44]Xiong, X. hui, Li, A. hua, Liang, X. feng, & Zhang, J. (2018). Field study on high-speed train induced fluctuating pressure on a bridge noise barrier. Journal of Wind Engineering and
Industrial Aerodynamics.
![2 Amino 1 [bis(N,N dimethylamino)phosphoramido]benzimidazole](data:image/gif;base64,R0lGODlhAQABAIAAAP///wAAACH5BAEAAAAALAAAAAABAAEAAAICRAEAOw==)