International Journal of Emerging Technology and Advanced Engineering
Website: www.ijetae.com (ISSN 2250-2459, Volume 2, Issue 5, May 2012)349
Anomaly Detection in Network using Data mining Techniques
Sushil Kumar Chaturvedi
1, Prof. Vineet Richariya
2, Prof. Nirupama Tiwari
31M-Tech Research Scholar, LNCT,Bhopal
2Department of CSE LNCT, Bhopal
3Department of CSE SRCEM, Banmore
1[email protected] 2[email protected]
Abstract-As the network dramatically extended security considered as major issue in networks. There are many methods to increase the network security at the moment such as encryption, VPN, firewall etc. but all of these are too static to give an effective protection against attack and counter attack. We use data mining algorithm and apply it to the anomaly detection problem. In this work our aim to use data mining techniques including classification tree and support vector machines for anomaly detection. The result of experiments shows that the algorithm C4.5 has greater capability than SVM in detecting network anomaly and false alarm rate by using 1999 KDD cup data.
Keywords- Data Mining; Support Vector Machines; classification Tree; Anomaly Detection Systems (ADS)
I.
I
NTRODUCTIONIn recent year computer technology have been utilized by many people all over the world in several areas. With the development of internet technology, network security has become a global focus in the world. Traditional security such as firewall, VPN and data encryption is insufficient to detect against attacks by crackers. However, intrusion detection is a dynamic one, which can give dynamic protection to the network security in monitoring, attack and counter attack [1]. For collecting the data set, Anomaly Detection System (ADS) can be classified as host-based and network-based [2].
Host Based ADS:-these types of systems actually run on the system being monitored. These data come from the records of different host system activities, including appraisal record of OS, system logs, application program information, and so on.
Network Based ADS:-these types of system are placed on the network, near the system or system being monitored. They examine the network traffic and determine whether it falls within acceptable boundaries. these data come through network segments, such as :Internet packets.
Anomaly detection techniques are classified into two categories [3]:
1. Anomaly Detection: Anomaly detection refers to storing features of user’s usual behaviors into database, then comparing user’s current behavior with those in database. If the deviation is huge enough, we can say that there is something abnormal.
2. Misuse Detection: Misuse Detection refers to confirming attack incidents by matching features through the attacking feature library.
International Journal of Emerging Technology and Advanced Engineering
Website: www.ijetae.com (ISSN 2250-2459, Volume 2, Issue 5, May 2012)350
Data mining can process huge amount of data.
It is more useful to find out the ignored and hidden information.
Data mining algorithms are used to perform data summarization and visualization that help the security analysis in various areas. [7].
II.
R
ELATED WORKDenning was amongst the first persons to think in the area of application of data mining to network security. He has given a model of a real –time intrusion-detection expert system [8]. The concept behind the model is that exploitation of a system’s vulnerabilities involves abnormal usage of system and this abnormality can be detected by looking for the abnormal patterns in the audit records. The model proposed is capable of detecting break-ins, penetrations, and other forms of computer anomaly.in this paper we are using two methods of anomaly detection SVM (Support Vector Machine) and C4.5 that is extended version of classification algorithm ID3. Both the methods are supervised algorithm. We are performing comparison on the basic of detection rate and false alarm rate.
III
D
ATAM
ININGA
LGORITHMSA. C4.5
It is targeted at supervised learning. Given an attribute valued data set where instances are described by collections of attributes and belong to one of a set of mutually exclusive classes, C4.5 learn a mapping from attribute values to classes that can be applied to classify new , unseen instances. This algorithm is more applicable for continuous and discrete value attributes [20].
The algorithm involves the following steps [9]:
1. Computing the information gain for each attribute. 2. The attribute with the highest information gain, is
selected as a splitting attribute.
3. If the selected attribute is discrete (categorical), the node is branched with all possible values. If the attribute is continuous, a cut point with the highest information gain is selected.
4. After splitting, consider whether or not these new nodes are leaves (their data belong to the same type); otherwise, new nodes are the root of the sub-trees.
5. Repeating all the above steps, until all new nodes are leaves.
Algorithm C4.5 (D)
Input: an attribute-valued dataset D 1: Tree = {}
2: if D is “pure” OR other stopping criteria met then 3: terminate
4: end if
5: for all attribute a € D do
6: Compute information-theoretic criteria if we split on a 7: end for
8: abest= Best attribute according to above computed criteria
9: Tree = Create a decision node that tests abestin the root 10: Dv= Induced sub-datasets from D based on abest 11: for all Dv do
12: Treev= C4.5(Dv)
13: Attach Treevto the corresponding branch of Tree 14: end for
15: return Tree
In building decision tree, there are two different methods for pruning it: pre-pruning and post-pruning. The power of post-pruning is obvious in situations in which two attributes individually seem to have nothing to contribute, but they are robust predictor when fused [10]. There are three post-pruning techniques: sub-tree replacement, sub tree raising, and reduced error pruning.
B. Support Vector Machine:-
International Journal of Emerging Technology and Advanced Engineering
Website: www.ijetae.com (ISSN 2250-2459, Volume 2, Issue 5, May 2012)351
For a two-class linearly separable learning task, the aim of SVC is to find a hyperplane that can separate two classes of given samples with a maximal margin which has been proved able to offer the best generalization ability.
Support Vector machines are a set of related supervised learning methods used for classification and prediction [11].
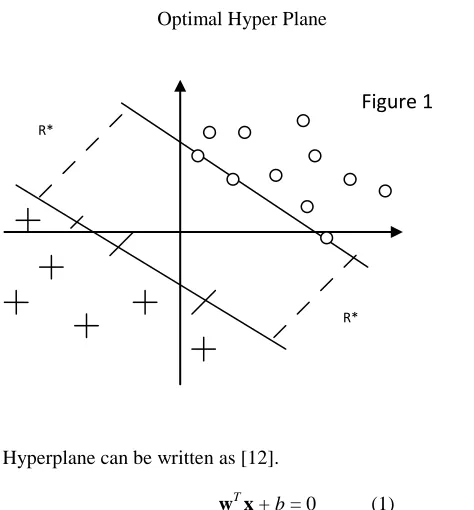
a margin can be defined as the amount of space, or separation, between the two classes as defined by a hyperplane. Geometrically, the margin corresponds to the shortest distance between the closest data points to any point on the hyperplane. Figure 1 shows optimal hyperplane for a linearly seperable case.
Optimal Hyper Plane
Hyperplane can be written as [12].
wT x + b = 0 (1)
Where W = {w1, w2, …, wn } are weight vectors for n
attributes A = { A1, A2, …, An }; b is a scalar, and X ={x1,
x2, …, xn} are values of attributes. R* desired directionally
geometrical distance from the sample x* to the optimal hyperplane [13, 14]. For more details on support vector machines, you can refer to [15, 16].
IV
.
E
XPERIMENTSWe tested our work using the 1999 KDD cup network anomaly data set [17]. It originated from the 1998 DARPA Intrusion Detection Evaluation Program managed by MIT Lincoln Labs.
The first stage is pre-processing. Data in this phase partition into training and testing. In the next step, we applied C4.5 and SVM on training dataset in order to build and train the models.
Finally trained models are evaluated on testing dataset to calculate the efficiency of the models.
The training data set consists of seven weeks of traffic with around 5 million connections and the testing data consists of two weeks of traffic with around 300,000 connections. The data contains four main categories of attacks:
Denial-of-service (Dos) such as smurf, apache2,pod, etc.
Remote-to-local (R2L) like imap, worm, phf,etc. User to root (U2R) such as perl, rootkit and so on. PROBING such as nmap, portsweep, etc.
mining algorithms can lead to better results if data under analysis have been normalized [18].
Detection of attack can be measured by following metrics: False positive (FP): Or false alarm, Corresponds to the
number of detected attacks but it is in fact normal. False negative (FN): Corresponds to the number of
detected normal instances but it is actually attack, in other words these attacks are the target of intrusion detection systems.
True positive (TP): Corresponds to the number of detected attacks and it is in fact attack.
True negative (TN): Corresponds to the number of detected normal instances and it is actually normal.
The accuracy of an intrusion detection system is measured regarding to detection rate and false alarm rate. In this work, we use 1999 KDD cup Dataset which consist of (311129 records).
[image:3.612.47.284.338.593.2]R* R*
International Journal of Emerging Technology and Advanced Engineering
Website: www.ijetae.com (ISSN 2250-2459, Volume 2, Issue 5, May 2012)352
[image:4.612.343.539.183.256.2]Table 1 given below shows the percentage of data. Then, 15% of data is extracted by sampling. 70% of this new set belonged to training set, and 40% dedicated to test data.
TABLE 1
PERCENTAGE OF DATA
Attack Name Quantity (Anomaly) Percentage ( anomaly)
Normal 62,083 19.9
Dos 229,533 73.77
U2r 328 0.001
Probe 4,066 0.013
R2l 15,189 0.048
A. Detection rate comparison
Detection rate refers to the percentage of detected attack among all attack data, and is defined as follows:
Detection rate = detected attack × 100
All attack data
Or
Detection rate = TP × 100
TP+TN
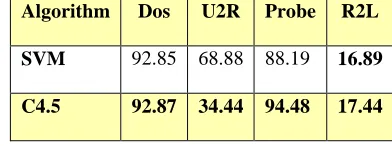
The results of detection rate for different types of attacks are shown in Table 2. As statistical results indicate, average detection rate for C4.5 and SVM are 84.05 and 83.76, respectively. Furthermore, detection rate for C4.5 is better than SVM. For each attack, C4.5 is also better than SVM except U2R attack. It seems it is because of limited amount of U2R attacks in our data sample.
TABLE 2
DETECTION RATE COMPARISION OF DIFFERENT ATTACKS THROUGH C4.5 AND SVM
Algorithm Dos U2R Probe R2L
SVM 92.85 68.88 88.19 16.89
C4.5 92.87 34.44 94.48 17.44
B. False alarm rate comparison
False alarm rate refers to the percentage of normal data which is wrongly recognized as attack, and is defined as follows:
False alarm rate = FP × 100
FP+FN
The average of false alarm rate in our experiment is 0.81 for C4.5 algorithm and 1.62 for SVM. As the results show, C4.5 also performs better in false alarm average than SVM.
V.
C
ONCLUSIONIf we are using network then detecting attack is an important need in network systems, in this paper we used two data mining techniques namely C4.5 and SVM to detect anomaly in network. Experiment result show, C4.5 algorithm has better result than SVM in both detection and false alarm rate in our data set.
International Journal of Emerging Technology and Advanced Engineering
Website: www.ijetae.com (ISSN 2250-2459, Volume 2, Issue 5, May 2012)353
REFERENCES
[1] M. Xue, C. Zhu, "Applied Research on Data Mining Algorithm in Network Intrusion Detection," jcai, pp.275-277, 2009 International Joint Conference on Artificial Intelligence, 2009.
[2] D. E. Denning, “An intrusion detection model,” IEEE Transaction on Software Engineering, 1987.
[3] T. Bhavani et al., “Data Mining for Security Applications,” Proceedings of the 2008 IEEE/IFIP International Conference on Embedded and Ubiquitous Computing - Volume 02, IEEE Computer Society, 2008.
[4] T. Lappas and K. P. ,"Data Mining Techniques for (Network) Intrusion Detection System," January 2007.
[5] S. Sun, Y. Wang, "A Weighted Support Vector Clustering Algorithm and its Application in Network Intrusion Detection," etcs, vol. 1, pp.352-355, 2009 First International Workshop on Education Technology and Computer Science, 2009.
[6] S. Wu, E. Yen. “Data mining-based intrusion detectors,” Elsevier computer Network, 2009.
[7] E. Bloedorn et al, ”Data Mining for Network Intrusion Detection: How to Get Started,” Technical paper, 2001.
[8] Dorothy E. Denning. “An Intrusion-Detetcion Model” 1986 IEEE Computer Society Symposium on Research in Security and Privacy , pp 118-31
[9] J. Han, and M. Kamber, “Data mining: concepts and techniques’”(2nd ed.). Morgan Kaufmann Publishers, 2006.
[10] I.H. Witthen, E. Frank, “Data Mining: Practical Machine Learning Tools and techniques with Java Implementations,” Morgan Kaufmann Publishers, October 1999.
[11]http://en.wikipedia.org/wiki/Support_vector_machine
[12] J. Han, and M. Kamber, “Data mining: concepts and techniques’” (2nd ed.). Morgan Kaufmann Publishers, 2006.
[13] R.O. Duda, P.E. Hart, and D.G. Stork. Pattern Classification, Wiley, 2001.
[14] S. Haykin. Neural Networks: A Comprehensive Foundation, Tsinghua University, Press, 2001.
[15] J. Han, and M. Kamber, “Data mining: concepts and techniques’” (2nd ed.). Morgan Kaufmann Publishers, 2006.
[16] D. L. Olson, D. Delen, “Advanced Data Mining Techniques,” 2008.
[17] http://kdd.ics.uci.edu/databases/kddcup99/kddcup99.html
[18] J. Han, and M. Kamber, “Data mining: concepts and techniques’” (2nd ed.). Morgan Kaufmann Publishers, 2006.