Journal of Chemical and Pharmaceutical Research, 2014, 6(7):1597-1603
Research Article
CODEN(USA) : JCPRC5
ISSN : 0975-7384
Feature gene selection method based on improved harmony search algorithm
Jun Wei
School of Mathematics and Computer Science, Shaanxi University of Technology, Hanzhong Shaanxi, China
_____________________________________________________________________________________________
ABSTRACT
DNA microarray data often contain tens of thousands of genes, where have a lot of irrelevant and redundant genes, these genes may seriously affect the accuracy and efficiency of classification. In order to solve this problem, this paper proposes a feature gene selection method based on improved harmony search algorithm. Firstly, genes are ranked using Relief F algorithm and preselected genes subset is obtained according to ranked-top genes .Then using improved harmony search algorithm to select feature genes from above genes subset. Finally we implement simulation experiments on three public microarray data sets. The results show that the proposed algorithm can achieve very high accuracy in the feature genes less, and is a effective and efficient feature genes selection algorithm. Especially, selected feature genes can help to understand microarray data.
Key words: microarray data; feature gene; Relief F algorithm; harmony search algorithm
_____________________________________________________________________________________________
INTRODUCTION
Gene chip [1] which also known as the DNA microarray is an advanced, large-scale, high-throughput detection technology , which has been widely and successfully applied in many fields of disease diagnosis, drug screening[2-3], and will be for human disease diagnosis, treatment and prevention of opening up new way, provide technical support platform for the rapid screening and pharmacogenomics in drug development studies of lead compounds.
Microarray data set contains tens of thousands of genes, but the number of samples are often less than one hundred. In the tens of thousands of genes, most of them have no obvious contribution for cancer classification, only a small amount of closely related genes have relationship with the classification task, and the noise and redundant genes will seriously affect the classification performance and efficiency. In order to figure out this problem, we choose the solution like using genes selection to eliminate the redundant and irrelevant genes, and will reduce the decrease the cost and improve the accuracy of clinical diagnosis, and this method also supply the reliable basis [4-5] for predicting disease .
______________________________________________________________________________
the high dimension, high noise data.
In order to solve this problem, this paper proposes a hybrid method of feature gene selection. The first stage is based on the ReliefF algorithm and calculate the correlation between each gene and categorical attributes. The second phase is using the improved harmony search algorithm to select feature gene. Voice search algorithm (Harmony Search, HS) is a new intelligent optimization algorithm, which simulates the process of the musicians to generate a wonderful harmony by repeatedly adjusting various musical tone. The algorithm has many advantages such as less adjustable parameters, a group of search capability, easy to merge with other algorithms. But the harmony search algorithm has some phenomenon with other intelligent algorithms which is premature. On the basis of [16] this paper, it will optimize harmony search algorithm, and will experiment on 3 public microarray datasets. The experiment results show that the algorithm is a feature gene selection algorithm wich have global search capability, high classification accuracy, and also could eliminate the noise and redundant gene. .
EXPERIMENTAL SECTION
Relief F algorithm:
ReliefF is an extended and more robust version of the original Relief algorithm [12]. In contrast to many heuristic measures for feature selection, ReliefF does not assume conditional independence of the variables. The main idea of ReliefF is to estimate the quality of features based on how good their values discriminate between samples that are close. Consecutively random samples are drawn from the data set. Each time the k nearest neighbors of the same class and the opposite class are determined. Based on these neighboring cases the weights of the attributes are adjusted. As within the two previous algorithms the variables are ranked and different models are built by dropping the variable with the smallest weight. The remaining part of the selection procedure is completely analogous to the one followed in the two previous methods. Although the ReliefF algorithm is computationally more expensive and complex than the previous techniques, the cost of an exhaustive search is still much higher.
Harmony algorithm:
The HS algorithm has been recently developed in an analogy with music improvisation process where musicians in an ensemble continue to polish their pitches in order to obtain better harmony. Jazz improvisation seeks to find musically pleasing harmony similar to the optimum design process which seeks to find optimum solution. The pitch of each musical instrument determines the aesthetic quality, just as the objective function value is determined by the set of values assigned to each decision variable. The steps in the procedure of classical harmony search algorithm are as follows:
Step 1. Initialize the problem and algorithm parameters. The optimization problem is specified as follows:
( ) . . i i, 1, 2, ,
Minimize f x s t x ∈X i= L N
where f x is an objective function; x is the set of each decision variable( ) x ; N is the number of decision i
variables,X is the set of the possible range of values for each decision variable,i Xi:xiL ≤Xi ≤xiU. The HS algorithm parameters are also specified in this step. These are the harmony memory size (HMS), or the number of solution vectors in the harmony memory; harmony memory considering rate (HMCR); pitch adjusting rate (PAR); and the number of improvisations(Tmax), or stopping criterion.
Step 2. Initialize the harmony memory. The HM matrix is filled with as many randomly generated solution vectors as the HMS
1 1 1
1 1 1
1 2
2 2 2
2 2 2
1 1
1 1
( ) ( )
( ) ( )
( ) ( )
N
N
HMS HMS HMS
HMS HMS HMS
N
x x x
x f x f x
x x x
x f x f x
HM
x x x
x f x f x
= =
L L M M L M
M M M
L
Step 3. Improvise a new harmony. Generating a new harmony is called ’improvisation’. A new harmony vector,
' ' ' '
1 2
( , , , N)
x = x x L x , is generated based on three rules: (1)memory consideration, (2)pitch adjustment ,(3)random selection. The procedure works as figure 1. xi'=( ,x x1' 2',L,x'N) is the ith component of x′ , and
1, 2,
( , )
j i
Step 4. Update harmony memory. If the new harmony vector, x'=( ,x x1' 2',L,xN' ) is better than the worst harmony
in the HM, judged in terms of the objective function value, the new harmony is included in the HM and the existing worst harmony is excluded from the HM.
Step 5. Check stopping criterion. If the stopping criterion (maximum number of improvisations) is satisfied, computation is terminated. Otherwise, Steps 3 and 4 are repeated.
Our proposed method:
As with other intelligent algorithm, harmony search algorithm has premature phenomenon. In order to overcome the algorithm later stagnation, this article uses the literature in [16] algorithm, the introduction of the parameters, it increases with the number of iterations and reduce the worst at the early stage of the algorithm, and major updates and curry, late updates the best harmony harmony in the library, this kind of algorithm can effectively prevent the premature phenomenon, and can accelerate the the convergence process. The improved harmony search algorithm and specific steps are as follows:
Step 1: set up parameters: the number of variables N ; the maximum number of iterations Tmax; harmony memory size HMS ; tone tuning probability PAR; the pitch adjusting bandwidth bw ; memory value probability HMCR .
Step 2: initialization of memory HM : According toxi = round rand( (1,N)), the vector is randomly generated, which is composed of ‘0’ and ‘1’ and length is N .The ‘1’ and ‘0’ represent that the corresponding gene is selected
or not selected.
Step 3: calculate each harmony fitness value in HM : training subset and testing subset are produced according
i
x ,and then classification accuracy by using SVM on testing subset is as fitness value of x ,that is i fi = f x( )i ,and the best harmony xbestand worst harmony xworst are found out.
Step 4: generate a random number rand and compare with WSR . If rand>WSR,the worst harmony xworstis selected, that is xnew=xworst;otherwise the best harmony xbestis selected, that is xnew=xbest.
Step 5: generate a new variable. If rand <HMCR,the new variable comes from harmony memory; otherwise, if
rand<PAR,the new variable is adjusted according to xnew=round x( new+ ×(2 rand− ×1) bw), otherwise xnew= round rand( (1,N)).
Step 6: step 5 is repeated until all variables of new harmony are generated.
Step 7: update harmony memory. Firstly, the fitness of new harmony is calculated, that is fnew= f x( new).
Secondly, if the worst harmony is selected, then fnewand fworstare compared. If fnew> fworst,then xworst =xnew. if the best harmony is selected, then fnewand fbestare compared. If fnew> fbest,then xbest =xnew.
Step 8: check the algorithm termination conditions. If termination conditions is achieved, the best harmony is outputted, otherwise goto step 3.
EXPERIMENTAL DATA AND METHODS
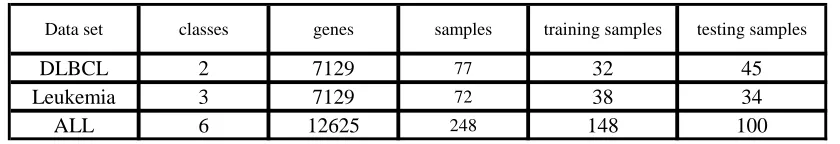
[image:3.595.97.517.599.671.2]To evaluate performance of our proposed method, eight benchmark microarray datasets are selected and used in our experiments. The three datasets are described in table 1.
Table 1 three benchmark cancer microarray datasets
Data set classes genes samples training samples testing samples
DLBCL 2 7129 77 32 45
Leukemia 3 7129 72 38 34
ALL 6 12625 248 148 100
Experimental results and analysis:
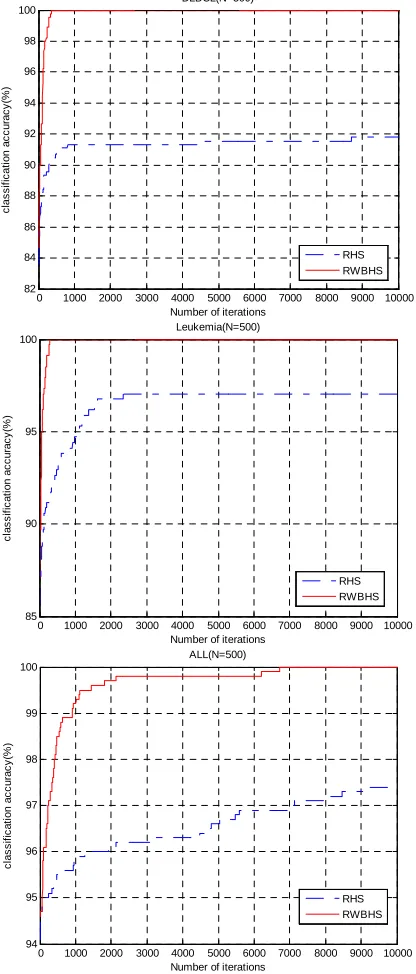
In order to easy to study the RWBHS algorithm, it takes primary gene subsetN=500 and N=1000, and gives the result of freature gene selection method based on the classical harmony search algorithm (RHS). In order to avoid the influence of randomness of algorithm, RWBHS algorithm and RHS algorithm will runs 10 times.
(1) The classification accuracy
______________________________________________________________________________
convergence of RWBHS algorithm is superior than RHS algorithm from the chart. The average classification accuracy on 3 datasets are higher than RHS algorithm, it means that RWBHS algorithm has better global search capability.
0 1000 2000 3000 4000 5000 6000 7000 8000 9000 10000 82 84 86 88 90 92 94 96 98 100
Number of iterations
c la s s if ic a ti o n a c c u ra c y (% ) DLBCL(N=500) RHS RWBHS
0 1000 2000 3000 4000 5000 6000 7000 8000 9000 10000 85
90 95 100
Number of iterations
c la s s if ic a ti o n a c c u ra c y (% ) Leukemia(N=500) RHS RWBHS
0 1000 2000 3000 4000 5000 6000 7000 8000 9000 10000 94 95 96 97 98 99 100
Number of iterations
[image:4.595.203.411.120.607.2]c la s s if ic a ti o n a c c u ra c y (% ) ALL(N=500) RHS RWBHS
Figure 1 The average classification accuracy of iterative curve (N=500)
Table 2 Comparison of classification accuracy (N=500)
Best(%)
Worst(%)
average(%
)
Best(%)
Worst(%)
average(%)
DLBCL
75.6
93.3
91.1
91.8
100
100
100
Leukemia
55.9
97.1
94.1
96.8
100
100
100
ALL
68
98
97
97.4
100
100
100
Data set SVM(%)
[image:4.595.77.537.655.757.2]Table 2 is the results of classification accuracy. We can observe that the accuracy rate of RWBHS algorithm can reach 100% in each experiment in the 3 data sets classification, it means that the algorithm has very strong stability.
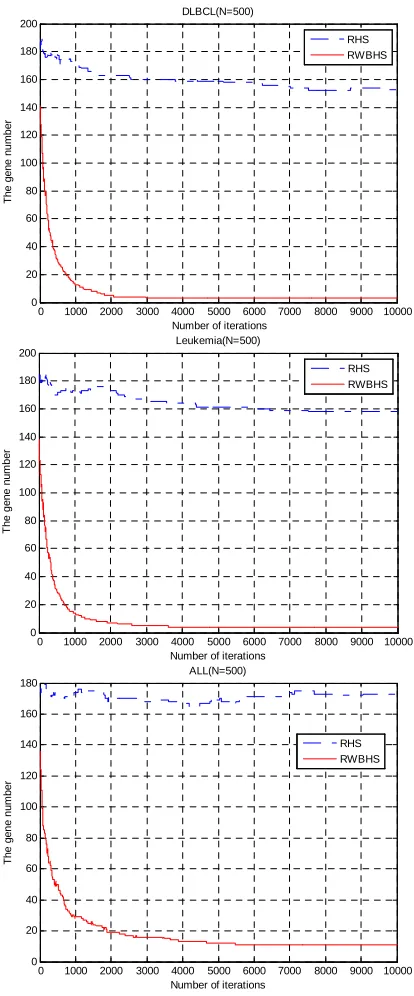
[image:5.595.203.410.160.658.2](2) The number of feature gene
Figure 2 shows the iterative process feature gene subset algorithm of N=500. We can see from the figure above, RWBHS algorithm convergence curve more smooth, the number of feature gene optimal feature search to the syndrome factor set was much less than that of RHS algorithm.
0 1000 2000 3000 4000 5000 6000 7000 8000 9000 10000 0
20 40 60 80 100 120 140 160 180 200
Number of iterations
T
h
e
g
e
n
e
n
u
m
b
e
r
DLBCL(N=500)
RHS RWBHS
0 1000 2000 3000 4000 5000 6000 7000 8000 9000 10000 0
20 40 60 80 100 120 140 160 180 200
Number of iterations
T
h
e
g
e
n
e
n
u
m
b
e
r
Leukemia(N=500)
RHS RWBHS
0 1000 2000 3000 4000 5000 6000 7000 8000 9000 10000 0
20 40 60 80 100 120 140 160 180
Number of iterations
T
h
e
g
e
n
e
n
u
m
b
e
r
ALL(N=500)
RHS RWBHS
Figure 2 Average feature gene subset iterative curve (N=500)
______________________________________________________________________________
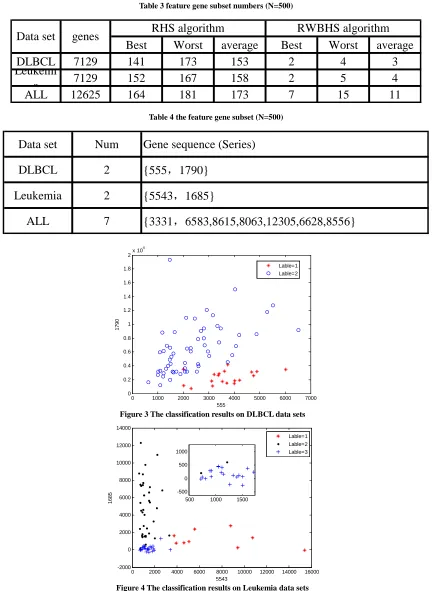
Table 3 feature gene subset numbers (N=500)
Best
Worst
average
Best
Worst
average
DLBCL
7129
141
173
153
2
4
3
Leukemi
a
7129
152
167
158
2
5
4
ALL
12625
164
181
173
7
15
11
Data set
genes
RHS algorithm
RWBHS algorithm
Table 4 the feature gene subset (N=500)
Data set
Num
Gene sequence (Series)
DLBCL
2
{555
,
1790}
Leukemia
2
{5543
,
1685}
ALL
7
{3331
,
6583,8615,8063,12305,6628,8556}
0 1000 2000 3000 4000 5000 6000 7000 0
0.2 0.4 0.6 0.8 1 1.2 1.4 1.6 1.8
2x 10
4
555
1
7
9
0
Lable=1 Lable=2
Figure 3 The classification results on DLBCL data sets
0 2000 4000 6000 8000 10000 12000 14000 16000 -2000
0 2000 4000 6000 8000 10000 12000 14000
5543
1
6
8
5
Lable=1 Lable=2 Lable=3
500 1000 1500 -500
0 500 1000
Figure 4 The classification results on Leukemia data sets
Figure 3 shows 2D {555,1790} scatter diagram which the optimal RWBHS algorithm searched in DLBCL data
side, it can be seen that the second class two data and third kinds of data are very close and easy to cause the classification error.
Based on the test results, we get the following conclusions: 1) RWBHS algorithm is better than RHS algorithm in classification accuracy. 2) The number of feature gene obtained by RWBHS algorithm are significantly less than RHS algorithm.
CONCLUSION
This paper presents a hybrid method of feature gene selection. The first stage is based on the ReliefF algorithm, the sort of microarray data set, the ranking of N genes constitute the primary gene subset, second phase using the improved harmony search algorithm to select feature gene. Through simulation experiments on 3 public microarray data sets, results show that the classification accuracy of the algorithm can reach 100%, the number of feature gene and search less, is a feature gene selection algorithm, worthy of further theoretical study.
Acknowledgement
This paper is supported by National Natural Science Foundation of China (81160183, 11305097) and Scientific Research Program Funded by Shaanxi Provincial Education Department.
REFERENCES
[1]Schena M,Shalon D,Davis R W,Brown P O. Science, 1995, 270(5235): 467-470
[2]Ben-Dor A, Bruhn L, Friedman N, et al. Journal of Computational Biology, 2000, 7(3-4): 559-583 [3]Wu Bin, Shen Ziyin. Chinese Journal of Digest, 2006, 14(1): 68-74
[4]TaoChen. Journal of Chemical and Pharmaceutical Research,2014,6(6):15-28 [5] Chen Tao. Journal of Computer Applications,2011,31(5),1331-1335
[6]Inza I,Larranaga P,Blanc R,et al. Artificial Intelligence in Medicine,2004,31(2):91-103 [7] Zhao Hui. International Journal of Security and Its Applications, 2013,7(5),193-204 [8]Baldi P,Long A D.Bioinformatics,2001,17(16):509-519
[9] Furey T S,Cristianini N,Duffy N.Bioinformatics,2000,16(10):906-914 [10]Kononenko I. Los Alamitos, CA: IEEE Computer Society, 1994: 171-182
[11] Rao R V, Savsani V J, Vakharia D P. Computer-Aided Design, 2011,43(3),303-315 [12]PENG S H,XU Q H,FEN G X, et al. FEB S Letters, 2003,555 ( 2) :358- 362 . [13] Chen Tao. Application Research of Computers.2011,28(1),139-141
[14]SHE N Q , SHI W M , KON G W , e t a l . Talanta, 2007, 71 ( 4 ) : 1679- 1683 .
[15]Chen Tao, Hong Zeng-Lin. Software Engineering and Knowledge Engineering: Theory and Practice,
2012,585-592