International Journal of Emerging Technology and Advanced Engineering
Website: www.ijetae.com (ISSN 2250-2459, ISO 9001:2008 Certified Journal, Volume 7, Issue 8, August 2017)
Modeling of Two-Tier Cellular Network Using Channel Sub
Rating CAC
Pankaj Goel1, D K Lobiyal2School of Computer and Systems Sciences, JNU, New Delhi
Abstract– Call admission control in cellular network is one
of challenging issues. In this paper, call admission control problem is addressed by considering a two tier cellular network design problem as an optimization problem. In this, we propose to estimate the optimal number of microcells and macrocells that results in minimum network design cost. The cost of the network design has been constrained by the limits of call dropping, call blocking probability and voice quality degradation ratio. Admission of calls both new arriving calls and handoff calls in maicrocell and macrocell has been modeled with channel sub-rating using one-dimensional and two-dimensional Markov chain respectively. This optimization problem has been solved by using genetic algorithm. The results of the proposed solution are compared with the results of Simulated Annealing and GA based algorithm with guard channels.
Keywords–Cellular Network, Tier, Channel sub-rating
CAC, Genetic Algorithm, Simulated Annealing, Markov Chain ,GASCN
I. INTRODUCTION
In recent years there is tremendous increase in mobile cellular users. To see prospective users many new network operators come in market which put pressure on bandwidth. In present scenario Quality of Service(QoS) become important agenda between the different mobile operators. Ever-present mobile coverage and lower power usages are also play important role to select the mobile operator by the users.
Availability of limited frequency spectrum makes Quality of Service a challenging task. Therefore, Multi-tier networking becomes vital in providing QoS. To improve the spatial reuse of frequency spectrum multi-tier architecture plays an important role. The whole coverage area is cover by two layers of cells, one is macrocell and other is microcell. One macrocell have many microcells. Each cell have base station (BS) which have the control of cells and transmit signals for mobile terminals. According the transmission power constraints and availability of spectrum, a group of channels are assign to each cell.
When a user initiates call but BS is unable to assign a channel then this is said to be call blocking .During a call when user is moving sometime user cross the boundary of cell and enter another cell than control should transfer to other cell BS this process is said handoff.
If no channel is available in other BS than ongoing call is block and this process is said call dropping. To design two-tier cellular network, call blocking and call dropping probabilities are two important Quality of Service measures.
In this paper, we are using channel sub-rating call admission control policy. We are presenting two-tier cellular networks problem as an optimization problem with call blocking, call dropping probability, mean degradation ratio of the voice quality in microcell and macrocell and number of microcell covered by a macrocell as odd integer as constraints and minimizing the implementation cost of the network. Further we are proposing to solve the optimization problem using Genetic Algorithm.
The remaining of the paper is as follows. Research work related to two-tier cellular network carried out in the literature is presented in section 2. The mathematical model developed in this work is explained in section 3. Genetic Algorithm used for solving the sub-rating CAC optimization problem in Cellular Network (GASCN) is presented in section 4. Numerical results obtained are discussed in section 5. Finally the work presented in paper is concluded in the last section.
II.RELATED WORK
International Journal of Emerging Technology and Advanced Engineering
Website: www.ijetae.com (ISSN 2250-2459, ISO 9001:2008 Certified Journal, Volume 7, Issue 8, August 2017) Goel and Lobiyal find minimum cost for two tier
cellular network design using genetic algorithm[6] . Preserving the new call blocking probability while reducing the handoff probability may be achieved using channel sub-rating strategy. Xiaolong et al. in their paper [7] proposed a call admission control scheme for HCN based on channel sub-rating using 1-D Markov process in microcell and 2-D Markov process in Macrocell. Martin Taranetz evaluated the performance of typical indoor users in urban two-tier heterogeneous mobile networks with indoor-deployed small cell base stations (BSs) and normal outdoor BSs. In this indoor and outdoor environments are
partitioned by walls with a certain penetration loss[8]. An
optimal allocation scheme for an integrated wirelesscellular model with handoff priority and handoff guarantee services is designed by Madhu Jain & Ragini Mittal[9].The millimeter-wave (mmWave) frequency band is seen as a key enabler of multigigabit wireless access in future cellular networks.MAC layer issues, such as synchronization, randomaccess, handover, channelization, interference management, scheduling, and association for mmWave frequency band are discuss by HosseinShokri-Ghadikola et al.[10].Optimal channel assignment in mobile communications using Genetic algorithms is proposed by Lipo Wang, S. Arun kumaar& Wen Gu[11].
III. MATHEMATICAL MODEL
In this paper, a two tier cellular network design problem is considered. In the first tier, network consists of macrocells. The next tier contains a number of microcells overlayed by a macrocell. Slow mobility calls arrive in the microcell whereas fastmobility new calls arrive in the macrocell. The blocked calls and dropped handoff calls from microcell are also dealt by the overlayed macrocell. To handle the calls in excess of number of channels available, channel sub-rating is used. In the designing two tier cellular network, it is important to determine the optimal number of microcells and macrocells to achieve the high performance. Therefore, in this paper we have formulated it as an optimization problem to estimate the cost of designing a two tier cellular network.
3.1 Model assumptions
For constructing mathematical model, we have made the following assumptions:
1) The whole service area is covered by macrocells and a macrocell has odd number of microcells within it. 2) The radius of a macrocell and a microcell are
approximately 0.5 km and 1.5 km, respectively. 3) Two mobility classes - slow mobility and fast
mobility are considered.
4) Microcell takes slow mobility calls and macrocell takes fast mobility calls as well as overflowed slow mobility calls from microcells.
5) The mean velocity of fast mobility users ( as well as slow mobility users are considered as exponentially distributed and remain same for the entire call duration.
6) Random distribution of all available channels between microcell and macrocell is considered.. 7) The time spend by a user in a cell is called dwell
time and calculated as in [12]
8) and are call arrival rate of slow and fast
users and they follow Poisson distribution.
9) When all channels are occupied by new calls and/or handoff calls, a full rate channel is temporarily divided into two channels said as sub-rating channels, one to serve existing call and other to serve new incoming handoff call.
10) The division of full rated channels into sub-rating channels is restricted to total no of channels in a particular cell.
11) In a microcell, if all full-rating channels are busy than new call is blocked and overflowed to overlaying macrocell.
12) Similarly, if all channels are sub-rated, then handoff calls are blocked and overflowed to overlaying macrocell.
13) Any call from macrocell to microcell is not allow in any situation.
14) In a macrocell, if all full-rating channel are busy, then a newcall is blocked and only handoff calls are served by sub-rating channels. A handoff call is also blocked if no full-rating channel is available for sub-rating.
3.2 Model formulation and parameter
3.2.1. Performance analysis of microcell
Microcell layer of two-tier cellular network can be modeled in terms of one-dimensional Markov chain[6]. The variables used in modeling are defined as follows
:slow mobility call arrival rate in microcell : slow mobility asymptotic handoff rate in
microcell
: dwell time of the slow mobility user in
Microcell
r :microcell radius R: macrocell radius
:mean speed of slow mobility user
International Journal of Emerging Technology and Advanced Engineering
Website: www.ijetae.com (ISSN 2250-2459, ISO 9001:2008 Certified Journal, Volume 7, Issue 8, August 2017)
: call arrival rate per second per for slow mobility user
: Microcell call blocking probability : Microcell call dropping probability
Where
A Markov chain for a microcell with m channels is presented in Fig 1
2c 1 c a
0 …...a
mc
a b
(m+1)c
…….. b
2mc
2m 2m - 1 b
(2m-1)c Figure 1. Transition diagram for microcell with m channels
m
In Fig.1, number of calls served by a microcell corresponds to a state. Each microcell consists of m channels. Anew slow call or a handoff call is accepted by a microcell if the number of busy channels in the microcell are less than or equal to m. If number of busy channels are greater than m, then channels are subrated and these subrated channels are used by handoff calls. When the system is in ith state greater than m, all new slow calls are blocked. There are (2m-i) full rate and 2(i-m) half rate channels available for All handoff calls are blocked for From the state diagram in fig-1 the steady state probabilities in microcell is given as follows:
( )
( )
∑
The Asymptotic handoff rate is calculated
iteratively until difference between two iteration is less than 0.0000005 using the following formula
∑
The slow new calls in the microcell are blocked after all m channels are busy and calls are blocked. Therefore, the call blocking probability in microcell can be represent as
∑
The slow handoff calls in the microcell are dropped, if all channels are sub rated..The call blocking probability
is given as
The blocked slow calls in microcell overflow to the macrocell with rate and dropped handoff calls
overflow to the macrocell with rate .The overflow call rate and overflow handoff rate are given as
Where ,
(9)
Due to sub-rating of channels, voice quality degrades. Therefore, in the designing, while sub rating, voice quality parameter may be considered to allow permissible degradation of voice quality. It can be taken care of by calculating the degradation ratio of voice quality as given in [7].
The expected number of the busy channels in the microcell layer, [ ] is given as
[ ] ∑
The expected number of the sub-rated channels
[ ]in the microcell layer, is given as
[ ] ∑
The voice quality degradation ratio [ ]in microcellis given as
[ ]
∑
3.2.2. Performance analysis of macrocell
International Journal of Emerging Technology and Advanced Engineering
Website: www.ijetae.com (ISSN 2250-2459, ISO 9001:2008 Certified Journal, Volume 7, Issue 8, August 2017)
: Fast mobility call arrival rate in a macrocell : Fast mobility asymptotic handoff rate in a
Macrocell
: Slow mobility asymptotic handoff rate once
they enter a macrocell
: Dwell time of the slow mobility user in the
Macrocell
: Dwell time of the fast mobility user in the
Macrocell
Mean call duration
: Mean speed of fast mobility user
: Number of channels in a macrocell
: Call arrival rate per second per for fast mobility users
Call blocking probability in a macrocell Call dropping probability in a macrocell
Where
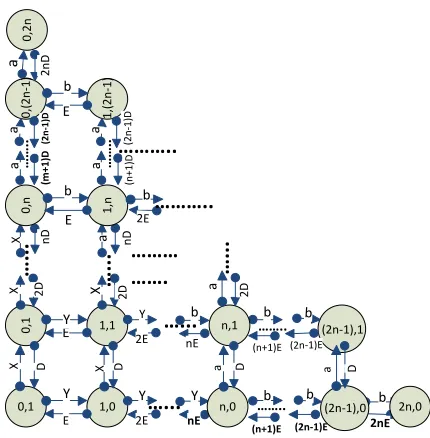
A Markov chain for a macrocell with n channels is presented in fig 2.
(2n-1)E 0,1 0 ,1 D X 2E 1,0 E Y
…...
nE Y b (n+1)E …….. b 2nE 2n,0 (2n-1),0 b n,0 Y 2E 1,1 E Y…...
nE b b (n+1)E …….. (2n-1),1 b (2n-1)E n,1 YX D a D a D
2
D
X
…
..
.
nDX a (m +1 )D … … .. a 0 ,2 n 0 ,( 2 n -1 ) a (2 n -1 )D 0 ,n 2 D X
…
..
.
nD [image:4.612.61.276.440.659.2]a a (n +1 )D … … .. 1 ,( 2 n -1 ) a (2 n -1 )D 1 ,n a 2 D
…
..
.
b b E 2E b E………
…….
………..
Figure 2. Transition diagram for macrocell with n channels
2
n
D
………..
In this figure a state corresponds to the number of fast users i and slow users j served by a macrocell. Using state transition diagram given in figure 2, the equilibrium equations can be written as follows
International Journal of Emerging Technology and Advanced Engineering
Website: www.ijetae.com (ISSN 2250-2459, ISO 9001:2008 Certified Journal, Volume 7, Issue 8, August 2017) The Asymptotic handoff rate and are
calculated iteratively with accuracy of 0.000005 using the following equations
∑ ∑
∑ ∑
The equilibrium equations form 10 to 25are solved using Gauss Jordon numerical method for calculating the steady state probabilities .
The voice quality degradation ratio in a macrocell is calculated as given [7].
The expected number of the busy channels [ ]in the
macrocell layeris given as
[ ] ∑
The expected number of the sub-rated channels
[ ]in the macrocell layeris given as
[ ] ∑
The voice quality degradation ratio , [ ] in macrocellis given as
[ ]
∑
The call blocking probability, andcall dropping
probability, in macrocell is calculated as follows:.
∑ ∑
∑ ∑
The total call blocking ( and call dropping ( probabilities are calculated using the following equations
(34)
(35)
3.2.3. Formulation of Optimization Problem
We have considered a cost minimization problem for two-tier cellular network. The minimum cost problem can be formulated as follows:
[ ] [ ]
[ ] [ ]
Where C is total cost of designing a micro-macro cell system. The cost of designing one unit of microcell and macrocell are respectively. The number of microcells and macrocells in the system are respectively.
The radius of microcell and macrocell are represented by
and respectively. and are maximum acceptable value of call blocking and call dropping probabilities respectively. [ ] and
[ ] are maximum acceptable mean degradation
ratio of the voice quality in microcell and macrocell respectively. C is the total cost of designing a system.
Inequality constraints in equation (37) and (38) represent the call blocking and call dropping probabilities which should be less than the given limits. Inequality constraints in equation (39) and (40) represent mean degradation ratio of the voice quality that should be less than the given limit. Inequality constraints in equation (41) and (42) represent total coverage area. Inequality constraints in equation (43) represents that there should be integer number of covering microcells in a macrocell. We solve the above optimization problem by using a Genetic Algorithm.
IV. PROPOSED GASCNALGORITHM
International Journal of Emerging Technology and Advanced Engineering
Website: www.ijetae.com (ISSN 2250-2459, ISO 9001:2008 Certified Journal, Volume 7, Issue 8, August 2017)
Step-1:Initialized population
First we considered genes of 4 cell with field
Ch1 Ch2 r R
Where
Ch1 is number of channels in a microcell
Ch2 number of channels in a macrocell
r radius of a microcell
R radius of a macrocell
The population is initialized by generating randomly Ch1, Ch2 , r and R..For example a gene C1 can be as follows
18 16 466 1398
Using the fitness function population is accepted if R/r is an odd integer; otherwise again new population is generated. We have considered an initial population of 50 chromosomes.
Step-2:Mutation
Select a gene randomly from the feasible population and then select a random position p between 1-4 in the gene
If(p<=2) then
Generate that particular cell, i.e. 1 or 2 accordingly
Elseif (3<= p <=4 ) then
Generate both cell 3 and 4 such that R/r is odd integer
For example if random gene is C1 and p=2 then new gene C2 is as
18 17 466 1398
If p=3 or 4 then r and R both are generated again such that ratio R/r is an odd integer
Step-3: Crossover
Select two random population e.g. C1 and C2 as follows.
18 16 466 1398
19 20 458 1374
Select random position p between 1-4 e.g. p=2 then new genes are
18 16 458 1374
19 20 466 1398
Step-4 :Apply the fitness function
Step-5: Evaluate the population
Step-6 : Check the stopping criteria
If(stopping criteria is not satisfied) then Go to step no 2
else end
V. EXPERIMENTATION AND RESULTS
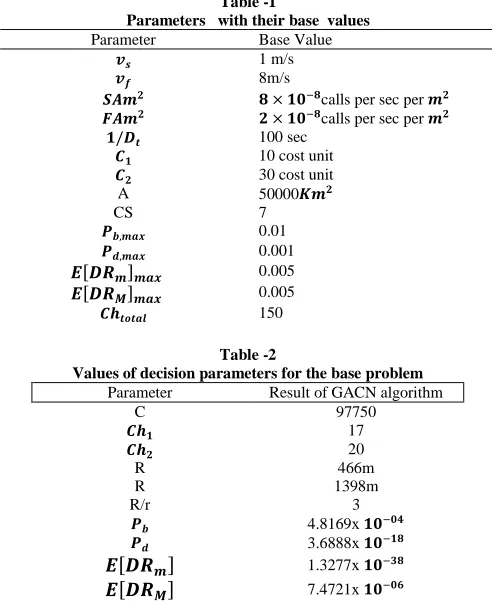
[image:6.612.65.287.124.748.2]The proposed GASCN algorithm is used to solve the optimization problem described in 3.2.3 as follows. First an initial population of 50 is generated. Ch1 and Ch2 are randomly generated between (11,20). Let the radius of microcell(r) is approximately 0.5 km meters and the radius of macrocell (R) is between 800-1400meters. Radius r and R are randomly generated between 200-600 and between 800-1400 respectively. We apply GASCN algorithm for the base problem using the parameters given in Table 1. The results of the experiments are given in table 2.
Table -1
Parameters with their base values
Parameter Base Value
1 m/s 8m/s
calls per sec per
calls per sec per
100 sec
10 cost unit 30 cost unit
A 50000
CS 7
0.01
0.001
[ ] 0.005
[ ] 0.005
150
Table -2
Values of decision parameters for the base problem
Parameter Result of GACN algorithm
C 97750
17
20
R 466m
R 1398m
R/r 3
4.8169x 3.6888x
[ ] 1.3277x
[ ] 7.4721x
[image:6.612.320.566.367.668.2]International Journal of Emerging Technology and Advanced Engineering
Website: www.ijetae.com (ISSN 2250-2459, ISO 9001:2008 Certified Journal, Volume 7, Issue 8, August 2017) This shows that our model with GASCN algorithm gives
better result than the result of GACN and GA. In the above result it can be seen that mean degradation ratio of the voice quality in microcell and macrocell are within the given threshold limit used in modeling.
To observe the convergence of GASCN algorithm, total cost is evaluated for a large number of iterations which is shown in figure 1. Results in Figure- shows that for GASCN algorithm in the starting total cost decreases, but after 420 iterations, the cost observed remains almost the same. In other word, there is no significant change in cost as number of iterations increases beyond 420. But GACN algorithm with guard channels converges after 400 iterations. The cost of our model is better than other models, although our model converge later than other models with GACN algorithm.
Now we study the effect of some other parameters on the cost. First we study, change of slow mobility call arrival rate from to calls per sec per with a step size of calls per sec per .In figure 2, the resultsare compared with SA algorithm and GACN algorithm .
In above graph it is shown that when slow mobility call arrival rate increase, the system cost also increase. In GA algorithm rate of change of cost is more than our perposed model with GASCN algorithm.
To examine the effect of fast mobility user arrival rate on the total cost, we considered the fast mobility user arrival rate from to calls per sec per with a step size of calls per sec per . The results are shown in Figure 3
Now, we study change in total cost as we change the average speed of slow mobility user from 0.25m/s to 2.25 m/s taking step size 0.25 m/s. We compared the resultsof proposed algorithm with ofSA algorithm [5] and GACN[6] algorithm as shown in Figure4.
In figure 4, when slow mobility speed increases, the cost of system in GA algorithm increases approximately from 146000 to 155000.I In our model using GASN algorithm cost increases approximately from 77000 to 97000 because in sub-rating CAC policy more handoff calls served by microcell, therefore, the change in system cost is smaller as compared to guard channel CAC policy. 0 50 100 150 200 250 300 350 400 450 500
0.95 1 1.05 1.1 1.15 1.2 1.25 1.3x 10
5
Number of iteration
T
o
ta
l C
o
s
t
Figure:1 Number of iteration vs Total Cost
Subrating(GASCN) GACN
4 5 6 7 8 9 10 11 12 13 14 x 10-8 0.9
1 1.1 1.2 1.3 1.4 1.5 1.6 1.7 1.8 1.9x 10
5
slow mobility call arival rate
T
o
ta
l
C
o
s
t
Figure:2 slow mobility call arival rate vs total Cost
GA GACN Subrating(GASCN)
1 1.5 2 2.5 3 3.5 4 4.5 5 x 10⁻⁸ 0.95
1 1.05 1.1 1.15 1.2 1.25 1.3x 10
5
Fast mobility call arival rate
T
o
ta
l
C
o
s
t
Figure:3 Fast mobility call arival rate vs total Cost
GACN subrating(GASCN)
0 0.5 1 1.5 2 2.5
0.9 1 1.1 1.2 1.3 1.4 1.5 1.6x 10
5
slow mobility user speed(m/s)
T
o
ta
l
C
o
s
t
Figure:4 slow mobility user speed vs total Cost
International Journal of Emerging Technology and Advanced Engineering
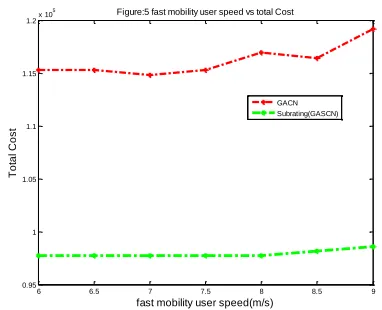
Website: www.ijetae.com (ISSN 2250-2459, ISO 9001:2008 Certified Journal, Volume 7, Issue 8, August 2017) Similarly, we study the change in total cost as we change
the average speed of fast mobility user from 6 m/s to 9 m/s taking step size 0.50 m/s. We compared the results with of GACN[6] algorithm as shown in Figure 5.
In figure 5, results shows that our proposed model of sub-rating CAC and solve using GASCN algorithm give better result with respect to Guard channel CAC with GACN.
[image:8.612.306.580.129.368.2]The comparison of the results of GASCN algorithm with Simulated annealing (SA), Grady search (GS) algorithm and GACN algorithm with base values with changed values of parameter are given in Table-3.The total cost obtained using sub-rating CAC with GASCN algorithm is 97750, GACN algorithm is114240, SA algorithm is 152060 by using GS is 155390. It shows that our model using sub-rating CAC with GASCN algorithm gives better result in comparison to guard channel model using different algorithms. By conducting separate experiments, we have evaluated total cost by changing the total area, slow mobility user speed and slow & fast mobility arrival rate. The results of these experiments are presented in table 3.
Table 3
Result obtained with GACN, SA ,GS& GASCN algorithm
. N
description GACN SA GS GASC
N
1 Base problem 114240 152060 155390 97750
2 Area=1000 22980 30990 30380 19550
3 Area=50 1160 1550 1660 1010
4 Slow mobility, speed
=0.25 m/s
113210 147000 154050 97750
5 Slow mobility, speed
= 3 m/s
116390 157200 161260 99000
6 fast mobility, speed =
5 m/s
115870 149900 154540 97750
7 fast mobility, speed =
20 m/s
113210 162440 165560 98150
8 Slow mobility,
arrival rate= 2x
102960 112590 118280 97750
9 Slow mobility,
arrival rate=
15x
116390 1955400 195860 98150
10 fast mobility, arrival rate= 5x
113730 76990 77380 97750
VI. CONCLUSION
In this work, we make a model using sub-rating CAC policy and total minimum cost of two-tier cellular network calculated using GASCN algorithm. We also compared GASCN algorithm with SA algorithm and GACN algorithm. Our results show that this model with GASCN algorithm gives better results in most of situation with respect to SA and GACN.
REFERENCES
[1] “More Than 50 Billion Connected Devices”, Ericsson White Paper,
February 2011 available at
http://www.akosrs.si/files/Telekomunikacije/Digitalna_agenda/Inter netni_protokol_Ipv6/More-than-50-billion connected-devices.pdf [2] C. Hartmannn and O. Schelegelmilch, “Hierarchical cell structures
with adaptive radio resource management,” in Proceedings IEEE Vehicular Technology Conference, pp. 1764-1771, 2000.
[3] H. S. Dhillon, R. K. Ganti, and J. G. Andrews, “Modeling and Analysis of K-Tier Downlink Heterogeneous Cellular Networks,” IEEE Journal on Selected Area in Communications, VOL. 30, NO. 3, APRIL 2012.
6 6.5 7 7.5 8 8.5 9
0.95 1 1.05 1.1 1.15 1.2x 10
5
fast mobility user speed(m/s)
T
o
ta
l
C
o
s
[image:8.612.69.260.188.343.2]t
Figure:5 fast mobility user speed vs total Cost
International Journal of Emerging Technology and Advanced Engineering
Website: www.ijetae.com (ISSN 2250-2459, ISO 9001:2008 Certified Journal, Volume 7, Issue 8, August 2017)
[4] W. H. Shan and P. Z. Fan, “Performance evaluation of a hierarchical cellular system with mobile velocity-based bidirectional call-overflow scheme,” IEEE Transactions on Parallel and Distributed System, Vol. 14, pp. 72-83, 2003.
[5] Eylem Ekici and Cem Erosy , “Multi-tier cellular networking dimensioning” ,Wireless Network 7,401-411,2001
[6] P. Goel and D. K. Lobiyal. "Minimize the Cost of Two-Tier Cellular Network Using Genetic Algorithm", International journal of control Theory and Application, Vol. 10, No. 6,pp375-387,2017
[7] Xiaolong WU, Min HE, Fei WANG, Jun ZHENG et al.,
“Performance Analysis of Sub-Rating for Handoff Calls in HCN” ,I. J. Communications, Network and System Sciences, Vol. 2 No. 1,pp 1-89,2009.
[8] Martin Taranetz, Robert W. Heathand Markus Rupp, “Analysis of urban two-tier heterogeneous mobile networks with small cell partitioning”, IEEE Transactions on wireless communication, Vol. 15, No. 10, Oct 2016.
[9] Madhu Jain & Ragini Mittal, “Adaptive call admission control and resource allocation in multi server wireless/cellular network”, Journal of Industrial Engineering International, March 2016, Volume 12,No.1 , pp 71–80.
[10] Hossein Shokri-Ghadikolaei, Carlo Fischione, Gábor Fodor, Petar Popovskiand Michele Zorzi, “Millimeter Wave Cellular Networks: A MAC Layer Perspective” IEEE Transactions on communications, Vol. 63, No. 10, OCTOBER 2015.
[11] Lipo Wang, S. Arun Kumaar and Wen Gu, “ Genetic algorithms for
optimal channel assignment in mobile communications”, Neural Information Processing, 2002. ICONIP '02. Proceedings of the 9th International Conference on18-22 Nov. 2002.
[12] L. Orthigoza-Guerrero and A.H. Ahgvami, “On Optimal spectrum partitioning in a microcell/macrocell layout with overflow”, in:
Proceedings of the IEEE Global Telecommunications
Conference(IEEE GLOBECOM’97), Arizona (1997)
[13] D. Bertsekkas and R. Gallager, Data Networks, 2nd ed. (Prentice – Hall, Englewood Chiffs, NJ, 1992)
[14] G. Boggia, P. Camarda, and N. Di Fonzo, “Tele traffic analysis of hierarchical cellular communication networks, ”IEEE Transactions on Vehicular Technology, Vol. 52, pp.931-946, 2003.