International Journal of Emerging Technology and Advanced Engineering
Website: www.ijetae.com (ISSN 2250-2459,ISO 9001:2008 Certified Journal, Volume 4, Issue 11, November 2014)
375
Investigation on Depth of Cut by Varying Cutting Parameters
for Multiple Pass Cutting on CO
2
Laser
A. M. Varsi
1, A. A. Shaikh
21
Assistant Professor, S. N. Patel Institute of Technology & Research Centre, Umrakh, Bardoli, India
2Associate Professor, S. V. National Institute of Technology, Surat, India
Abstract—This paper deals with the study of the potential
of the CO2 lasers for cutting material like acrylic by varying
cutting parameters like power and traverse speed. To achieve the desired depth of cut in the material by the laser beam is not possible by the single pass of cut. Hence, to achieve the required depth, multiple pass cutting will be required. An attempt is made to develop an analytical model which allows predicting the depth of cut as a function of cutting parameters like power, transverse speed and number of passes for a multiple pass of cut. The experimental data of depth of cut shows moderate agreement with the theoretical predictions given by the model.
Keywords —
Laser cutting, multiple pass
I. INTRODUCTION
Laser (light amplification by stimulated emission of radiation) is a coherent and amplified beam of electromagnetic radiation. CO2 lasers have wavelength of 10 µm in infrared region. It has high average beam power, better efficiency and good beam quality. It is suitable for fine cutting of sheet metal at high speed [1]. Laser machining is accomplished when the work piece absorbs laser energy and this photon energy gets converted into thermal energy. The high peak intensity of the pulse generates strong evaporation pressure which is responsible for ejection of this molten material and material loss at the surface due to evaporation for generation of machined depth [2]. A. Kaldos, et al [3] had showed that laser machining provides a number of advantages over the traditional electro discharge machining (EDM) in die making. It eliminates the expensive manufacture of electrodes, radically shortens the number of operations, reduces lead time from mould design to manufacture and provides excellent productivity and cost efficiency with good surface finish. B. Tirumala Rao, et al [4] studied the dynamic behavior of melt ejection in laser cutting of 1mm thick titanium sheet and obtained dross-free cuts with minimum heat affected zone (HAZ).
International Journal of Emerging Technology and Advanced Engineering
Website: www.ijetae.com (ISSN 2250-2459,ISO 9001:2008 Certified Journal, Volume 4, Issue 11, November 2014)
376 It was found that the depths of groove crack region are about 0.63 and 0.43 mm for the cutting speeds of 1 and 2 mm/s, respectively.C. Bedrin, et al [10] undertook a study of laser cut surfaces morphology which deals with micro-geometry of surfaces cut by a continuous wave CO2 laser, with oxygen jet assistance, from metallic sheets. It was observed that the roughness values decrease mainly with the increase of speed. But when speed is even more increased, the roughness value in the lower zone increases as well, since some burrs then occurs in this part. H. Huang, et al [11] studied the effects of femto-second laser machining on surface characteristics and subsurface microstructure of a Nitinol alloy. For a given beam spacing, a higher beam power would cause deeper cuts where the beams overlap and thus the surface would be rougher. It was seen that a higher power produced a surface with more distinct and deeper grooves than that with a lower power. Hongtao Ding, et al [12] developed laser-assisted machining (LAM) process with a larger material removal rate to replace the currently used hard turning and grinding operations for machining hardened steel shafts. Compared to conventional machining, the specific cutting energy during LAM drops by about 20% as the temperature increases to above 200 oC. Miroslav Radovanovic, et al
[13] have focused on reviewing the experimental
investigation concerned with analysis on effects of laser input process parameters on cut quality. In 54 % of the reviewed papers the authors have determined optimal cutting parameters settings for cutting the given material through simple analysis of the experimental results or by using statistical and regression analysis (RA). C. Y. Jiang, et al [14] established a theoretical model to predict the depth of machining by considering the laser beam intensity distribution and the interaction of the beam with the material. The experimental results show that the depth of cut increases with the increasing number of pulses at the beginning and then a saturation state is reached. G. Chryssolouris, et al [15] discusses a method for estimating the groove depth in laser machining processes based on temperature measurements. It was found that the estimated depth is very sensitive to changes in the thermal diffusivity and this property is itself very sensitive to the material temperature. Miloš Madić, et al [16] presented empirical modeling of surface roughness in CO2 laser cutting of mild steel using the multiple regression analysis (MRA) and artificial neural network (ANN). It can be observed that the surface roughness is highly sensitive to the selected laser cutting parameters. An increase in the cutting speed leads to the decrease in the surface roughness.
This is due to the fact that as the cutting speed increases, the interaction time between laser beam and work-piece material decreases, hence the thermal energy available at the work-piece surface decreases, which results in minimum side burning of the cut edge. An increase in the laser power improves the surface roughness. Now, in order to achieve the required depth of cut in a specimen, the single pass of the laser beam will not be sufficient to achieve the required depth. Hence, the laser beam has to be traversed number of times on the same shape to create the required depth and thus, the number of passes of cut is also to be included in determining depth of cut apart from other parameters like power and traverse speed. Thus, the present work deals with cutting of acrylic sheet on CO2 laser by varying machine parameters like power, cutting speed and number of pass for obtaining depths and finally, using the set of data, an analytical model is formulated to predict depth of cut for a given combination of parameters.
II. EXPERIMENTAL WORK
The experiments were carried out on CO2 laser of continuous-wave type along with 5 cm focal length lens producing laser beam of 0.015 cm diameter. A blower system is used to expel the molten material away from the machined zone. The work-piece material considered is an acrylic sheet since its absorptivity is unity. The cutting parameters considered are laser power (p) from 10 to 100% of maximum capacity 25 watt, cutting speed (v) from 10 to 100% of maximum capacity of 42 ips (1066 mm/sec) and number of passes (n) from 1 to 10. Similar type of experiments were performed by A. A. Shaikh, et al [17] on acrylic sheet by varying power and traverse speed for a single pass cutting but the present experiment is planned for multiple pass cutting to observe generation of depth of cut. Laser cutting modes are of two types: (i) Raster and (ii) Vector. The schematic diagram for the path of motion of laser beam in raster mode is shown in fig. 1.
[image:2.612.413.476.577.656.2]International Journal of Emerging Technology and Advanced Engineering
Website: www.ijetae.com (ISSN 2250-2459,ISO 9001:2008 Certified Journal, Volume 4, Issue 11, November 2014)
[image:3.612.305.581.160.531.2]377 In order to perform cutting on laser machine, a higher version of interfacing software is used. The present work attempts creation of cavity of 10 mm diameter with raster mode so that the machine can create circular cavity of 10 mm with certain value of depth based on the set of parameter combinations. After performing machining operations, the specimens appear as shown in fig. 2 for various combinations of speed and power. During the experiment, for the particular constant power, say 100%, the cut is obtained for various cutting speeds like 10%, 19%, 28%, 37%, 46%, 55%, 64%, 73%, 82%, 91% and 100%. For each combination of constant power and variable speed, cut is obtained for 10 passes.
Fig. 2 Acrylic specimens after machining at 100% power and different speeds for 10 passes
The measurement of depth of cut for all cavities were carried out on Rolland make needle scanner to read each spot as point and gives collective information as point cloud data. The interfacing software continuously provides the detail of building of point cloud data which can be easily visualized on screen.
[image:3.612.102.248.292.421.2]The table 1 below shows the values of depth of cut for 100% power and different speed combinations for 10 varying passes. Similarly, other sets of data are obtained for various power and speed combinations. The reported value of depth of cut for each combination of cutting parameter is further used for developing predictive model for multiple pass cutting.
TABLE I
Scanned Depths for 100% Power (in mm)
No. of passes (n)
V
% 1 2 3 4 5 6 7 8 9 10
10 0.95 1.8 2.62 3.47 4.32 5.32 6 6 6 6
19 0.4 0.82 1.1 1.6 1.95 2.35 2.75 3.3 3.62 4.0
28 0.25 0.52 0.77 0.95 1.25 1.55 1.62 1.8
57 2.15
2.4 2
37 0.17 0.32 0.45 0.62 0.77 0.9 1.07 1.2
7 1.42
1.5 2
46 0.15 0.25 0.35 0.42 0.55 0.7 0.75 0.8
7 1.0
1.1 5
55 0.12 0.17 0.27 0.35 0.4 0.5 0.57 0.6 0.7 0.8
7
64 0.1 0.15 0.22 0.25 0.32 0.37 0.4 0.4 0.52 0.6
73 0.07 0.1 0.15 0.2 0.22 0.3 0.32 0.3
5 0.4 0.5
82 0.07 0.1 0.12 0.15 0.17 0.2 0.22 0.2
7 0.3
0.3 5
91 0.02 0.02 0.07 0.1 0.12 0.15 0.17 0.2 0.25 0.2
7
10
0 0.02 0.05 0.05 0.07 0.07 0.1 0.1
0.1
2 0.15 0.2
III. DEVELOPMENT OF ANALYTICAL MODEL
During the process of cutting with CO2 laser, it was found that for a multiple pass of cut, as power increases, depth of cut increases while as speed increases, depth of cut decreases. Also, depth of increases as number of pass increases. Thus, depth (d) is directly proportional to power
International Journal of Emerging Technology and Advanced Engineering
Website: www.ijetae.com (ISSN 2250-2459,ISO 9001:2008 Certified Journal, Volume 4, Issue 11, November 2014)
378 Mathematically,
d α P ---(1) d α n ---(2) and d α
V
1
---(3) Therefore, removing the proportionality sign and placing constant k,
V P n k
d * * ---(4)
In the above equation (4), d is a dependent variable while P, n and V are independent variable. Hence, by doing multi-variable regression analysis, the constant k can be obtained.
The multivariable linear equation is given by [18]
b
X
M
X
M
X
M
Y
1*
1
2*
2
...
...
n*
n
--(5) Where, M1, M2, ...,Mn are constants.X1, X2,...,Xn are independent variables. b is a constant.
For one independent variable, sum of the squares will be
2
1 1*X b M
y
S i i ---(6)
Taking b=0 and differentiating above equation (6) w.r.t constant, we get
0 ) * (2 1 1 1
1
i i
i y M X
X M
S ---(7)
On solving the above equation (7), the constant M1 will be known.
On comparing equation (4) and equation (5), we get Y = d
---
(8)
M1 = k = constant---(9) X1 =
V
P
n
*
= independent variable---(10) Finally, equation (5) can be written as
Y = M1 * X1---(11) This is the linear form of equation (4).
Using the above methodology, the calculations pertaining to the set of data obtained for multiple pass depth of cut for various power and speed combinations is done and finally, the value of constant k is obtained. Hence, equation (4) can be rewrite as
k * n * P
d
V
---(12)Where, k = 0.075025622
The above equation (12) gives the value of depth of cut for a particular power and speed for a multiple pass. Derived over a range of power from 10 to 100%, speed from 10 to 100% and number of passes from 1 to 10 and calculating the depth from the above equation (12) and doing the regression with the experimental depth value, the value of bias comes to be 35.6%.
IV. RESULTS AND DISCUSSION
The results obtained by cutting experiments are analyzed and discussed in this section. This is done in two parts: (i) Influence of number of pass on depth of cut for different speeds for constant power (=100%) and (ii) Influence of number of pass on depth of cut for different powers for constant speed (=10%).
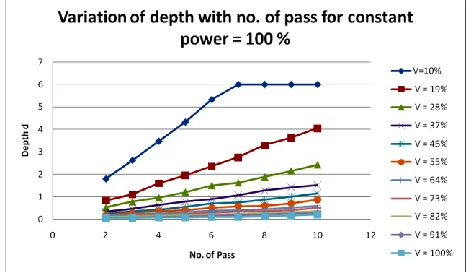
[image:4.612.326.562.465.601.2]4.1 Variation of depth with number of passes for different speeds and constant power = 100 %
Fig 3 Effect of number of pass on depth of cut for power=100%
International Journal of Emerging Technology and Advanced Engineering
Website: www.ijetae.com (ISSN 2250-2459,ISO 9001:2008 Certified Journal, Volume 4, Issue 11, November 2014)
379 Similar effect is observed for depth of cut with number of passes for constant power and different speeds as shown in fig. 4.
(a)
International Journal of Emerging Technology and Advanced Engineering
Website: www.ijetae.com (ISSN 2250-2459,ISO 9001:2008 Certified Journal, Volume 4, Issue 11, November 2014)
380
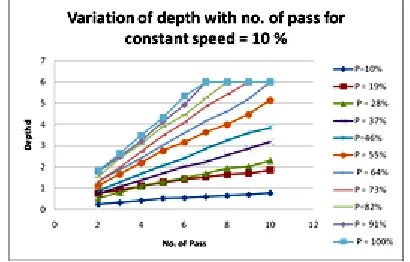
4.2 Variation of depth with number of passes for different powers and constant speed = 10 %
As shown in Fig. 5 below, as number of passes increases, depth of cut increases for particular power.
[image:6.612.65.270.444.575.2]
Fig. 5 Effect of number of passes on depth of cut for speed = 10%
As the value of power increases, the trend of the graph goes up showing the increase in thevalue of depth of cut as amount of energy transfer also increases. Similar effects are observed for depth of cut with number of passes for constant speed and different powers as shown in fig. 6.
International Journal of Emerging Technology and Advanced Engineering
Website: www.ijetae.com (ISSN 2250-2459,ISO 9001:2008 Certified Journal, Volume 4, Issue 11, November 2014)
[image:7.612.88.251.141.630.2]381 (h)
Fig. 6 Effect of number of pass on depth of cut for speed (a) V = 19% (b) V = 28% (c) V = 37% (d) V = 46% (e) V = 55% (d) V =
64% (g) V = 73% (h) V = 82% (i) V = 91% (j) V= 100%
4.3 Assessment of Predictive Depth for Multiple Pass
Depth is the function of power, speed and number of passes. Hence, from the mathematical model given in section 3, the resultant equation for predicted depth for multiple pass is given by:
P d 0.075025622* n *
V
---(13)
Using the above formula, the comparison of experimental depth with predicted depth is shown in the graph below for constant powers and different speeds.
(a)
(b)
Fig. 7 Comparison of experimental depth with predicted depth for P=100% and (a) V=10%, V=19%, V=28%, V=37%, V=46%, V=55%,
[image:7.612.326.564.277.628.2]International Journal of Emerging Technology and Advanced Engineering
Website: www.ijetae.com (ISSN 2250-2459,ISO 9001:2008 Certified Journal, Volume 4, Issue 11, November 2014)
382 Fig. 7 (a) and (b) shows the variation of experimental depth and predicted depth with number of passes for constant power of 100% and different speeds. From the figure, it can be seen that for low speed, as number of passes increases, depth of cut also increases but as speed increases, depth of cut also decreases and the trend line goes down. Experimental observations are almost all converging except for the few cases which may be due to uncertainty in data obtained during the experiment. Similar observations were found for other values of powers. Since, the machined specimens consists of blind holes, there was no effective utilization of blower and air compressor system to evaporate the material quickly out of the machine. For low power, the material removal is very less and before it gets sucked by compressor, it gets settled down on the surface which undergoes machining for further passes. This leads to material sticking to the surface and results in uncertainty of data. Hence, in order to have effective utilization of predicted model in laser machining with less deviation, it is recommended to choose high power and low speed combination.
V. CONCLUSION
The experiments carried out during the reported work includes laser cutting of acrylic specimens by varying cutting parameters like Power (P), Speed (V) and number of pass (n). The set of data obtained was useful in developing a predictive model for predicting depth of cut for multiple pass cutting for various combinations of speed and power. It was found that depth of cut increases with increase in power and number of pass whereas depth of cut decreases with increase in speed. The value of bias error obtained is 35.6% which shows variation of predicted model from the actual to be moderate and hence, it can be applied for high power and low speed combination for any shape.
REFERENCES
[1] Avanish Kumar Dubey, Vinod Yadava, 2008, ―Laser beam machining—A review‖, International Journal of Machine Tools & Manufacture Vol. 48 pp. 609 – 628.
[2] I. Black, S.A.J. Livingstone, K.L. Chua, 1998 ―A laser beam machining (LBM) database for the cutting of ceramic tile‖, Journal of Materials Processing Technology Vol. 84, pp. 47–55.
[3] A. Kaldos, et al, 2004 ―Laser machining in die making: a modern rapid tooling process‖, Journal of Materials Processing Technology Vol. 155–156, pp. 1815–1820.
[4] B. Tirumala Rao, Rakesh Kaul, Pragya Tiwari, A.K. Nath, 2005 ―Inert gas cutting of titanium sheet with pulsed mode CO2 laser‖,
Optics and Lasers in Engineering, Vol. 43, pp. 1330–1348. [5] A.A. Cenna, P. Mathew, 2002 ―Analysis and prediction of laser
cutting parameters of fibre reinforced plastics (FRP) composite materials‖, International Journal of Machine Tools & Manufacture, Vol. 42, pp. 105–113.
[6] F. Quintero, et al, 2011 ―CO2 laser cutting of phenolic resin boards‖,
Journal of Materials Processing Technology, Vol. 211, pp. 1710– 1718.
[7] B. S. Yilbas & Z. Yilbas, 1988 ―Effects of Plasma on CO2 Laser
Cutting Quality‖, Optics and Lasers in Engineering, Vol. 9, pp. 1-12. [8] B.S. Yilbas, S.S.Akhtar, 2012 ―Laser cutting of Kevlar laminates and thermal stress formed at cutting sections‖, Optics and Lasers in Engineering, Vol. 50, pp. 204–209.
[9] Chwan-Huei Tsai, Hong-Wen Chen, 2003 ―Laser cutting of thick ceramic substrates by controlled fracture technique‖, Journal of Materials Processing Technology, Vol. 136, pp. 166–173.
[10] C. Bedrin, S. F. Yuan, M. Querry, 1988 ―Investigation of Surfaces Microgeometry in Laser Cutting‖, Annals of the ClRP, Vol. 37, pp. 157-160.
[11] H. Huang, H.Y. Zheng, G.C. Lim, 2004 ―Femtosecond laser machining characteristics of Nitinol‖, Applied Surface Science, Vol. 228, pp. 201–206.
[12] Hongtao Ding, Yung C. Shin, 2010 ―Laser-assisted machining of hardened steel parts with surface integrity analysis‖, International Journal of Machine Tools & Manufacture, Vol. 50, pp. 106–114. [13] Miroslav Radovanovic, Milos Madic, 2011 ―Experimental
Investigations Of CO2 Laser Cut Quality: A Review‖,
Non-conventional Technologies, Review – no. 4, pp. 35-42.
[14] C. Y. Jiang, et al, 1993 ―On the Maximum Depth and Profile of Cut in Pulsed Nd: YAG Laser Machining‖, Annals of the ClRP, Vol. 42, pp. 223-226.
[15] G. Chryssolouris (I), A. Yablon, 1993 ―Depth Prediction in Laser Machining with the Aid of Surface Temperature Measurements‖, Annals of the ClRP, Vol. 42, pp. 205-207.
[16] Miloš Madić and Miroslav Radovanović, 2012 ―Comparative modeling of CO2 laser cutting using multiple regression analysis and
artificial neural network‖, International Journal of Physical Sciences, Vol. 7, pp. 2422 – 2430.
[17] A. A. Shaikh, A. M. Varsi, 2014 ―Investigation on depth of cut by varying cutting parameters for single pass cutting on CO2 laser‖,
International Journal of Innovative Research in Science, Engineering and Technology, Vol. 3, Issue. 9.