A CONCEPTUAL FRAMEWORK FOR PROJECT
MANAGERS TO IMPROVE PROJECTS PERFORMANCE
Georgios KAPOGIANNIS
Georgios KAPOGIANNIS
School of the Built Environment
College of Science and Technology
University of Salford, Salford, UK
i | P a g e Contents
List of Figures ... iii
List of Tables ... vii
Acknowledgments ... ix
Declaration ... x
Abstract ... xi
Chapter 1 – Introduction ... 1
1.1. Motivation ... 1
1.2. Research Aim and Objectives ... 4
1.3. Contribution to Knowledge ... 5
1.4. Thesis Structure ... 6
1.5. Summary ... 6
Chapter 2 - Literature Review ... 7
2.1. Management of Construction Projects ... 7
2.2. Construction Project Managers’ Roles ... 9
2.3. Challenges of Managing Construction Projects ... 12
2.3.1. Analysis of Technological Challenges ... 12
2.3.1.1. Information Maturity ... 13
2.3.1.2. Integrated Collaborative Technologies ... 15
2.3.2. Analysis of Behavioural Challenges ... 20
2.3.2.1. Team Collaboration in construction projects ... 20
2.3.2.2. Proactive Construction Project Managers ... 31
2.3.3. Analysis of Contextual Challenges ... 35
2.4. Summary ... 40
Chapter 3 – Research Design ... 41
3.1. The Importance of Planning a Research Design Framework ... 41
3.2. Developing the Research Design Framework ... 42
3.2.1. Philosophical Worldview ... 42
3.2.2. Testing the inter–relationships ... 44
3.2. Research Process ... 49
3.3. Research Design ... 50
3.4. Research Sample ... 53
3.5. Research Ethical Considerations ... 53
3.6. Conceptual Framework ... 55
3.7. Chapter Summary ... 57
Chapter 4 – Impact of Integrated Collaborative Technologies on Team Collaboration ... 57
4.1. Research Purpose ... 57
4.1.1. Research Hypothesis ... 57
4.1.2. Questionnaires ... 58
ii | P a g e
4.2. Primary Research Data Analysis and Discussion ... 60
4.3. Values of Integrated Collaborative Technologies and Team Collaboration ... 120
4.4. Summary ... 130
Chapter 5 -Impact of Team Collaboration on Proactive Behaviour ... 132
5.1. Research Purpose ... 132
5.1.1. Inter–relationships to be tested ... 132
5.2. Secondary Research Data Analysis and Discussion ... 133
5.3. Summary ... 145
Chapter 6: Impact of Proactive Behaviour on Project Performance ... 146
6.1. Research Purpose ... 146
6.1.1. Research Hypothesis ... 146
6.1.2. Questionnaires ... 148
6.1.3. Research Methodology ... 149
6.2 Primary Research Data Analysis and Discussion ... 150
6.2.1. Flexible Role ... 150
6.2.2. Co-Worker Trust ... 159
6.2.3. Self-Efficacy ... 166
6.2.4. Control Appraisal ... 175
6.2.5. Change Oriented... 183
6.2.6. Job Autonomy ... 191
6.2.7. Proactive personality ... 198
6.2.8. Supportive Supervision ... 206
6.3 A Comparative Proactive Behaviour and Project Performance Data Analysis ... 214
6.4 Summary ... 218
Chapter 7 -Conclusion and Contribution to Knowledge ... 219
7.1. Thesis Summary ... 219
7.2. Research Assessment ... 219
7.2.1. Integrated Collaborative Technologies’ Impact on Team Collaboration ... 219
7.2.2. Impact of Team Collaboration on Proactive Behaviour ... 219
7.2.3.Impact of Proactive Behaviour on Construction Project Performance ... 221
7.3. Research Contribution and Impact... 223
7.4. Recommendations for Future Work... 224
7.5. Concluding Comments ... 225
References ... 226
Appendixes ... 237
Appendix I – Research’s impact ... 237
Appendix II – Interviewees Comments ... 239
Appendix III – Questionnaire ... 242
iii | P a g e
List of Figures
Figure 1.1. Illustration of research relationships ... 4
Figure 1.2. Research Structure ... 6
Figure 2.1: Learning and support mechanisms by Nonaka and Von Krogh et al. (2002) ... 13
Figure 2.2.Innovative Interactive Project Information Maturity ... 14
Figure 2.3: Comparing Technologies adapted from D70 (CoSpaces Project) ... 16
Figure 2.4. Building Information Modelling (BIM) Roadmap adapted by BIM Task Group (2011) ... 17
Figure 2.5.: Final version of team collaboration model adopted by Patelli et al., 2012 ... 21
Figure 2.6. Proactive Model illustrated by Parker et al. (2006)... 34
Figure 2.7. Key Performance Indicators’ Resource, adopted from Mbgua et al., (1999). ... 35
Figure 3.1. The Four Worldviews adapted by Creswell (2009), Saunders et al.(2009) & Sexton (2002) ... 42
Figure 3.2. Research Design Process ... 50
Figure 3.3. Dimensions of researcher philosophy adapted by Saunders et al.,(2009) & Sexton (2002) ... 51
Figure 3.4. Research Interview Process ... 52
Figure 3.5. Research Data Analysis Process ... 53
Figure 3.6. Conceptual Framework ... 55
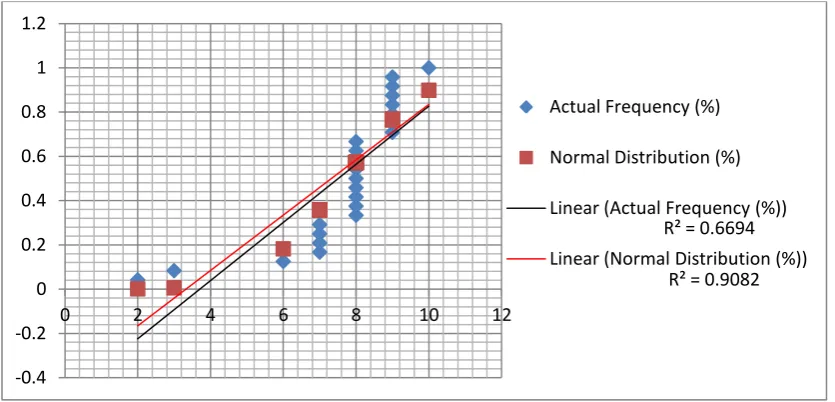
Figure 3.7. Normal Distribution and Descriptive Statistical Analysis for the Potential Conceptual Framework ... 56
Figure 3.8. Coefficient of Determination for Conceptual Framework ... 57
Figure 4.1 The sub hypotheses between integrated collaborative technologies and team collaboration ... 59
Figure 4.1a. Normal Distribution and Descriptive Statistical Analysis for sub-hypothesis - H1a ... 61
Figure 4.1b. Coefficient of Determination for sub-hypothesis H1a ... 61
Figure 4.2a. Normal Distribution and Descriptive Statistical Analysis for sub-hypothesis - H1b ... 65
Figure 4.2b. Coefficient of Determination for- H1b ... 66
Figure 4.3a. Normal Distribution and Descriptive Statistical Analysis for sub-hypothesis - H1c ... 69
Figure 4.3b. Coefficient of Determination for sub-hypothesis H1c ... 70
Figure 4.4a. Normal Distribution and Descriptive Statistical Analysis for sub-hypothesis - H1d ... 73
Figure 4.4b. Coefficient of Determination for sub-hypothesis H1d ... 74
Figure 4.5a. Normal Distribution and Descriptive Statistical Analysis for sub-hypothesis H1e ... 77
Figure 4.5b. Coefficient of Determination for sub-hypothesis H1e ... 78
Figure 4.6a. Normal Distribution and Descriptive Statistical Analysis for sub-hypothesis H1f ... 81
Figure 4.6b. Coefficient of Determination for sub-hypothesis H1f ... 82
iv | P a g e
Figure 4.7b. Coefficient of Determination for sub-hypothesis H1g ... 85
Figure 4.8a. Normal Distribution and Descriptive Statistical Analysis for sub-hypothesis H1h ... 87
Figure 4.8b. Coefficient of Determination for sub- hypothesis H1h ... 88
Figure 4.9a. Normal Distribution and Descriptive Statistical Analysis for sub-hypothesis H1i ... 91
Figure 4.9b. Normal Distribution and Descriptive Statistical Analysis for sub-hypothesis H1i ... 92
Figure 4.10a. Normal Distribution and Descriptive Statistical Analysis for sub-hypothesis H1j ... 95
Figure 4.10b. Coefficient of Determination for sub-hypothesis H1j ... 96
Figure 4.11a. Normal Distribution and Descriptive Statistical Analysis for sub-hypothesis H1k ... 99
Figure 4.11b. Coefficient of Determination for sub-hypothesis H1k ... 100
Figure 4.12a. Normal Distribution and Descriptive Statistical Analysis for sub-hypothesis H1l ... 103
Figure 4.12b. Coefficient of Determination for sub-hypothesis H1l ... 103
Figure 4.13a. Normal Distribution and Descriptive Statistical Analysis for sub -hypothesis - H1m ... 107
Figure 4.13b. Coefficient of Determination for sub-hypothesis H1m ... 108
Figure 4.14a. Normal Distribution and Descriptive Statistical Analysis for sub-hypothesis - H1n ... 110
Figure 4.14b. Coefficient of Determination for sub-hypothesis H1n ... 111
Figure 4.15a. Normal Distribution and Descriptive Statistical Analysis for the sub-hypothesis - H1o ... 113
Figure 4.15b. Coefficient of Determination for sub-hypothesis H1o ... 114
Figure 4.16a. Normal Distribution and Descriptive Statistical Analysis for sub-hypothesis H1p ... 117
Figure 4.16b. Coefficient of Determination for sub-hypothesis H1p ... 117
Figure 4.17: Strength Values of Integrated Information Technologies and Team Construction Collaboration ... 125
Figure 5.1. Potential impact of team collaboration on the development of proactive behaviour... 144
Figure 6.1. The sub hypotheses between proactive behaviour and project progress ... 149
Figure 6.1a. Normal Distribution and Descriptive Statistical Analysis for sub hypothesis H3a ... 151
Figure 6.1b. Coefficient of Determination for sub-hypothesis H3a ... 151
Figure 6.2a Normal Distribution and Descriptive Statistical Analysis for sub hypothesis H3b ... 152
Figure 6.2b. Coefficient of Determination for sub-hypothesis H3b ... 153
Figure 6.3a. Normal Distribution and Descriptive Statistical Analysis for sub hypothesi H3c ... 154
Figure 6.3b. Coefficient of Determination for sub-hypothesis H3c ... 154
Figure 6.4a. Normal Distribution and Descriptive Statistical Analysis for sub hypothesis H3d ... 155
Figure 6.4b. Coefficient of Determination for sub-hypothesis H3d ... 156
Figure 6.5a. Normal Distribution and Descriptive Statistical Analysis for sub hypothesis H3e ... 159
Figure 6.5b. Coefficient of Determination for sub-hypothesis H3e ... 160
v | P a g e
Figure 6.6b. Coefficient of Determination for sub-hypothesis H3f ... 161
Figure 6.7a. Normal Distribution and Descriptive Statistical Analysis for sub hypothesis H3g ... 162
Figure 6.7b. Coefficient of Determination for sub-hypothesis H3g ... 163
Figure 6.8a. Normal Distribution and Descriptive Statistical Analysis for sub hypothesis H3h ... 164
Figure 6.8b. Coefficient of Determination for sub-hypothesis H3h ... 164
Figure 6.9a. Normal Distribution and Descriptive Statistical Analysis for sub hypothesis H3i ... 167
Figure 6.9b. Coefficient of Determination for sub-hypothesis H3i ... 168
Figure 6.10a. Normal Distribution and Descriptive Statistical Analysis for sub hypothesis H3j ... 169
Figure 6.10b. Coefficient of Determination for sub-hypothesis H3j ... 169
Figure 6.11a. Normal Distribution and Descriptive Statistical Analysis for sub hypothesis H3k ... 170
Figure 6.11b. Coefficient of Determination for sub-hypothesis H3k ... 171
Figure 6.12a. Normal Distribution and Descriptive Statistical Analysis for sub hypothesis H3l ... 172
Figure 6.12b. Coefficient of Determination for sub-hypothesis H3l ... 172
Figure 6.13a. Normal Distribution and Descriptive Statistical Analysis for sub hypothesis H3m ... 176
Figure 6.13b: Coefficient of Determination for sub-hypothesis H3m ... 176
Figure 6.14a. Normal Distribution and Descriptive Statistical Analysis for sub hypothesis H3n ... 177
Figure 6.14b. Coefficient of Determination for sub-hypothesis H3n ... 178
Figure 6.15a. Normal Distribution and Descriptive Statistical Analysis for sub hypothesis H3o ... 179
Figure 6.15b. Coefficient of Determination for sub-hypothesis H3o ... 179
Figure 6.16a. Normal Distribution and Descriptive Statistical Analysis for sub hypothesis H3p ... 180
Figure 6.16b. Coefficient of Determination for sub-hypothesis H3p ... 181
Figure 6.17a. Normal Distribution and Descriptive Statistical Analysis for sub hypothesis H3q ... 183
Figure 6.17b. Coefficient of Determination for sub-hypothesis H3q ... 184
Figure 6.18a. Normal Distribution and Descriptive Statistical Analysis for sub hypothesis H3r ... 185
Figure 6.18b. Coefficient of Determination for sub-hypothesis H3r ... 185
Figure 6.19a. Normal Distribution and Descriptive Statistical Analysis for sub hypothesis H3s ... 186
Figure 6.19b. Coefficient of Determination for sub-hypothesis H3s ... 187
Figure 6.20a. Normal Distribution and Descriptive Statistical Analysis for sub hypothesis H3t ... 188
Figure 6.20b. Coefficient of Determination for sub-hypothesis H3t ... 188
Figure 6.21a. Normal Distribution and Descriptive Statistical Analysis for sub hypothesis H3u ... 191
Figure 6.21b. Coefficient of Determination for sub-hypothesis H3u ... 192
Figure 6.22a. Normal Distribution and Descriptive Statistical Analysis for sub hypothesis H3v ... 193
vi | P a g e
Figure 6.23a. Normal Distribution and Descriptive Statistical Analysis for sub hypothesis H3w ... 194
Figure 6.23b. Coefficient of Determination for sub-hypothesis H3w ... 195
Figure 6.24a. Normal Distribution and Descriptive Statistical Analysis for sub hypothesis H3x ... 196
Figure 6.24b. Coefficient of Determination for sub-hypothesis H3x ... 196
Figure 6.25a. Normal Distribution and Descriptive Statistical Analysis for sub hypothesis H3y ... 199
Figure 6.26a. Normal Distribution and Descriptive Statistical Analysis for sub hypothesis H3z ... 200
Figure 6.26b Coefficient of Determination for sub-hypothesis H3z ... 201
Figure 6.27a. Normal Distribution and Descriptive Statistical Analysis for sub hypothesis H3aa... 202
Figure 6.27b. Coefficient of Determination for sub-hypothesis H3aa... 202
Figure 6.28a. Normal Distribution and Descriptive Statistical Analysis for sub hypothesis H3ab ... 203
Figure 6.28b. Coefficient of Determination for sub-hypothesis H3ab ... 204
Figure 6.29a. Normal Distribution and Descriptive Statistical Analysis for sub hypothesis H3ac... 207
Figure 6.29b. Coefficient of Determination for sub-hypothesis H3ac... 207
Figure 6.30a. Normal Distribution and Descriptive Statistical Analysis for sub hypothesis H3ad ... 208
Figure 6.30b. Coefficient of Determination for sub-hypothesis H3ad ... 209
Figure 6.31a. Normal Distribution and Descriptive Statistical Analysis for sub hypothesis H3ae... 210
Figure 6.31b. Coefficient of Determination for sub-hypothesis H3ae... 210
Figure 6.32a. Normal Distribution and Descriptive Statistical Analysis for sub hypothesis H3af ... 211
Figure 6.32b. Coefficient of Determination for sub-hypothesis H3af ... 212
Figure 6.33. Comparing KPI values between KPIs and Proactive behaviour antecedents. ... 215
vii | P a g e
List of Tables
Table 2.1. Key Behavioural Factors captured from Pinto and Morris (2009) ... 11
Table 2.2: Success Factors using Integrated Collaborative Technologies ... 19
Table 2.3: External factors of collaboration at work ... 24
Table 2.4: Internal factors of collaboration at work ... 27
Table 2.5. Team Collaboration Factors within the Construction Environment ... 31
Table 2.6.Key Performance Indicators published by the UK Government (2000) ... 39
Table 3.1: Questions which have to be answered, adapted by Sexton (2002) ... 41
Table 4.1. Features and factors supporting the sub - hypothesis H1a ... 64
Table 4.2. Features and factors supporting the sub-hypothesis H1b ... 68
Table 4.3. Features and factors supporting sub-hypothesis H1c ... 72
Table 4.4. Features and factors supporting sub-hypothesis H1d ... 76
Table 4.5. Features and factors supporting sub-hypothesis H1e ... 80
Table 4.6. Features and factors supporting sub-hypothesis - H1f ... 83
Table 4.7. Features and factors supporting sub-hypothesis H1g ... 87
Table 4.8. Features and factors supporting sub-hypothesis - H1h ... 90
Table 4.9. Features and factors supporting sub-hypothesis - H1i ... 94
Table 4.10. Features and factors supporting sub-hypothesis - H1j ... 98
Table 4.11. Features and factors supporting sub-hypothesis - H1k ... 101
Table 4.12. Features and factors supporting sub-hypothesis - H1l ... 105
Table 4.13. Features and factors supporting sub-hypothesis - H1m ... 109
Table 4.14. Features and factors supporting sub-hypothesis - H1n ... 112
Table 4.15. Features and factors supporting sub-hypothesis - H1o ... 115
Table 4.16. Features and factors supporting sub-hypothesis - H1p ... 119
Table 4.17: Integrated Collaborative Technologies and Team Collaboration. ... 129
Table 5.1. Team collaboration impacts on proactive behaviour ... 144
Table 6.1. Impact of flexible role orientation antecedent on project performance ... 158
Table 6.2. Impact of co-worker trust antecedent on project performance ... 166
Table 6.3. Impact of self - efficacy antecedent on project performance ... 175
Table 6.4. Impact of control appraisal antecedent on enhancing project progress ... 182
Table 6.5. Impact of control appraisal antecedent on enhancing the project progress ... 190
ix | P a g e
Acknowledgments
This research is dedicated to those people who supported me in committing to writing
up my research. In particular, I would like to specially thank my Family (Theodora,
Theodoro and Angelina), my supervisors, Professor Terrence Fernando and Professor
Mike Kagioglou, Professor Vian Ahmed and Jesus’s Mother Maria (Zoodoxou Pigi)
for their continuing support all these years. From the depth of my heart, God bless
you all!
In addition I would like to thank my good friends and colleagues for their support all
these years: Athanasio Bistola, Christo Papadopoulo, Chisto Anagnostopoulo,
Professor Ari Syntheto, Dr Yianni Polychronaki, Dr Apostolo Antonacopoulo, Dr
Georgio Papoulaki, Colin Piddington, Dr Elia Economou, Dr Ioanni Moraitaki, Matar
Alzahmi, Andy Turner, Hanneke Van Dijk, Erika Kenyon, Professor Ghassan Aouad
Dr Dimitrio Tsouka, Dr Athanasio Tsouka and Chetan Narsih. I wish you all every
success.
Special thanks are due to the European funded CoSpaces project for supporting this
PhD research and my mentors: Professor Georgio Giagli, Professor Christos Makri
x | P a g e
Declaration
I declare that the research contained in this thesis was solely carried out by me. It has
not been previously submitted to this or any other institute for the award of a degree
xi | P a g e
Abstract
The Architecture, Engineering and Construction (AEC) sector often encounters
difficulties in attaining satisfactory project performance. The secondary data in this
research (literature review) clearly shows that an inability to pre-identify problems
leads to projects becoming ‘risky’. This can be due to a lack of meeting certain project
targets, i.e., a lack of predicting ‘accurate’ project time and costs, a failure to raise the
project’s quality issues and failures in predicting a project’s return on investment. In
addition, it has been shown that a major lack of anticipating problems within a
construction project can occur because of a lack of providing accurate
data/information and a lack of team collaboration between project stakeholders. Much
research has been conducted in order to anticipate construction project problems and
to attempt to offer technological solutions, including information maturity models.
However, in spite of all this, research projects still run into risks.
Therefore, this thesis aims to investigate a conceptual framework to support
construction project managers in order to enhance project performance. This
conceptual framework brings together three main entities: Integrated Collaborative
Technologies, Team Collaboration and Proactive Behaviour. These three notable
entities are used to support project managers’ strategies in order to successfully fulfil
the project. In order for this to be achieved the researcher has met the following
objectives: an investigation as to how proactive behaviour impacts on the progress of
construction projects, an investigation into how team collaboration relates to proactive
behaviour and an investigation into how team collaboration and integrated
collaborative technologies can support proactive behaviour.
The research design includes primary mixed data analysis and secondary data analysis
from the literature review. In order to gather data, semi-structured interviews and a
questionnaire have been undertaken by the researcher. The proposed conceptual
framework was tested by asking professional experts whether the proposed
framework was applicable within a construction project environment. The research
shows that there is a relationship between integrated collaborative technologies and
team collaboration, and team collaboration and proactive behaviour, and hence these
xii | P a g e achieve a successful outcome, a project requires stakeholders to learn how to
collaborate with the support of integrated collaborative technologies. Throughout this
‘iterative process’ construction project managers can enhance their proactive
behaviour at an individual level and thus can enhance their ability to pre-identify
construction related problems. Arguably, this behavioural change will impact
Chapter 1 - Introduction
1 | P a g e
Chapter 1 – Introduction
1.1.Motivation
The Architecture, Engineering and Construction (AEC) sector often encounters
difficulties in achieving satisfactory project performance. Atkinson et al. (1997) states
that successful construction project performance is achieved when stakeholders meet
their requirements, individually and collectively. Project performance consists of
indicators that help to measure project and organisational performance.
The Chair of the Construction Task Force, Sir John Egan (1998), in his ‘Rethinking Construction Report’ to the then Deputy Prime Minister John Prescott, identifies 10
parameters for benchmarking projects in order to achieve a good performance:
construction cost; construction time; defects; client satisfaction with the product and
service; profitability and productivity; promotion of result-orientated thinking;
predictability of both design and construction cost and time; and health and safety.
Since the year 2000 records on construction project performance have existed in the
Department of Business Innovation and Skills. In the latest report (2012 edition) it is
noted that there has been a significant improvement in project performance, although
profitability has fallen to 2.7% - in contrast to the 9.9% recorded in 2009. In addition
the report shows that there are still difficulties in predicting time, cost and profits.
Despite the reality of the construction industry’s performance during the last decade,
researchers in the academic world are trying to analyse the relevant factors and to
understand how this environment could be significantly improved. Koskela (2002)
states that the deficiencies in a construction project are, amongst others, poor
investigation of customer requirements at the outset; the process of requirement
clarification and change leading to disruption in the progress of the project, which
starts to drift from the plan; tasks begun without all inputs and prerequisites at
hand, leading to decreased efficiency or task interruption and; the performance
baseline becoming counterproductive. In addition to the above challenges, the
National Audit Office and the Office of Government Commerce in the United
2 | P a g e between the project and the organisation’s key strategic priorities; lack of effective
engagement; lack of skills and proven approach to project management and risk
management; too little attention paid to breaking development and implementation
into manageable steps; evaluation of proposals driven by price rather than price and
quality; lack of understanding of project and client requirement; lack of contact with
the supply industry and lack of effective project team integration. More recently, the
Frederic Deposit Insurance Cooperation mentioned that construction projects often
fail because of one or more of the following five reasons: poor planning; lack of
leadership; inadequate knowledge, people problems and lifecycle problems. The
challenges, therefore, relate to the skills and behaviour of team stakeholders and their
access to information.
During the last two decades software solutions have been introduced to construction
stakeholders with the intention of eliminating and controlling all of the above
challenges. The most recent is the development of Integrated Collaborative
Technologies. In the construction sector the current state-of-the-art is Building
Information Modelling (BIM). (BIM) is a process of generating and managing
building data during the project life cycle (Lee et al., 2006). Eastman (2009) gave a
better understanding of the philosophy of BIM:
“BIM involves representing a design as objects – vague and undefined, generic or product-specific, solid shapes or void-space oriented (like the shape of a room), that carry their geometry, relations and attributes. BIM design tools allow for extracting different views from a building model for drawing production and other uses. These different views are automatically consistent – in the sense that the objects are all of a consistent size, location, specification – since each object instance is defined only once, just as in reality. Drawing consistency eliminates many errors.”
Typically BIM uses three-dimensional, real-time dynamic building modelling
software in order to increase productivity in building design and construction. In
addition to this the process produces the Building Information Model, which includes
Chapter 1 - Introduction
3 | P a g e “due to elimination of many of the uncertainties found during the construction phase since they can be found during the design phase of the project and fixed so they do not occur during the actual construction phase. Also, any changes during construction will be automatically updated to BIM and those changes will be made in the model.”
Current pilot practices of BIM in construction projects in the United States of
America (USA), France and Australia have shown competitive advantages for all
project stakeholders in both project and organisational environments. The American
Institute of Steel Construction (2012) found that, amongst others, the following are
highly beneficial: improved visualisation, embedding and linking of vital information
such as vendors for specific materials, location of details and quantities required for
estimation and tendering, improved productivity due to easy retrieval of information,
increased speed of delivery, increased coordination of construction documents and
reduced project costs. Hence, in May 2011, the United Kingdom Government decided
that all construction projects with a budget exceeding £5M must use BIM by 2016,
with the aim of controlling and improving project performance. However, the biggest
challenge according to the latest Key Performance Indicators (KPIs) report is the need
to predict ‘accurate’ time and cost, to raise quality issues and to predict return on
investment (ROI) where profit has significantly fallen (2012). These four
sub-indicators impact the progress of the project life cycle and consequently reflect on
companies’ viability. The challenge, therefore, is not only to share and access
information but also to understand how to gather this information in order to predict
more “accurately” the project indicators that will impact on construction project
progress.
Trends or facts from the manufacturing industry have been transferred and observed
within the construction industry. Parker et al. (2006) believed that, in order to predict
performance indicators, including uncertainties and consequences, in manufacturing
projects, “proactive behaviour” should be enabled and developed for product/project
managers, which would, in turn, impact on production progress. In the same research
paper proactive behaviour antecedents were captured: flexible role orientation;
co-worker trust; job autonomy; control appraisal, proactive personality; change
orientation and supportive supervision. It was shown that the more product/project
4 | P a g e Summing up from the above, it can be seen that integrated collaborative technologies,
team collaboration and proactive behaviour can be instrumental in achieving better
project performance KPIs. This research aims to explore the interrelationships between
these elements and to investigate how integrated collaborative technologies can support
team collaboration, how team collaboration relates to proactive behaviour; and how
proactive behaviour impacts on the progress of construction projects. In order to
illustrate these relationships a conceptual framework is proposed as presented in Figure
1.1.
Figure 1.1. Illustration of research relationships
1.2. Research Aim and Objectives
The aim of this research is to test the relationships is illustrated in the conceptual
framework as is presented in figure 1.1. Specifically, this research aims to investigate
whether team collaboration and integrated collaborative technologies support
proactive behaviour which subsequently leads to increased efficiency and
effectiveness in construction project performance.
[image:18.595.106.491.254.518.2]Chapter 1 - Introduction
5 | P a g e
To investigate if integrated collaborative technologies impact on team
collaboration
To investigate how team collaboration could impact on proactive behaviour
To investigate if proactive behaviour impacts on project performance
The scope of the research within the broad project management life cycle (PMLC)
focuses on the design, schedule and construction phase of a project.
1.3.Contribution to Knowledge
The main contribution of this research is in enhancing the understanding of the
relationships between integrated collaborative technologies, team collaboration,
proactive behaviour and project performance. This research has made assumptions
that integrated collaborative technologies can enhance team collaboration, that team
collaboration can enhance proactive behaviour and that proactive behaviour can
consequently enhance project performance. It has tested these assumptions and
elaborated the fundamental characteristics of team collaboration, proactive behaviour
and project performance to explain their impact on project performance.
Elaboration of the basic features of collaboration, proactive behaviour and project
performance provided the author with a conceptual framework that illustrates how
various features could lead to the enhancement of project performance. The research
conducted also validated the “strength of influence” of these characteristics as well as
answered the question of “how” these features could lead to proactive behaviour and
project performance. This research captures the subjective view of many experienced
project managers and provides a conceptual framework that can be used by project
managers to deploy the various key characteristics, identified, enhancing their
proactive behaviour and leading to improved project performance.
Moreover, the development of a collaborative culture in a construction project is a
further contribution to knowledge. This culture presents the main features of
integrated collaborative technologies, collaboration, proactive behaviour and
performance indicators, including the interrelationships between them. Hence, the
developed collaborative culture could be incorporated in existing construction
6 | P a g e 1.4.Thesis Structure
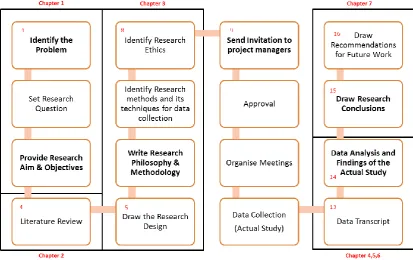
The thesis is organised into 7 chapters, as illustrated in Figure 1.2. Chapter 1
explains the research problem, and gives the research questions, aim and objectives,
including the PhD thesis structure. Chapter 2 discusses the secondary data of this
research: construction project managers, team collaboration in construction projects,
proactive project managers and the state-of-the-art in integrated collaborative
technologies. Chapter 3 contains the research design and methodology to be followed
in order for the data to be scientifically correct. Chapters 4, 5 and 6 consist of the
primary and secondary research data analysis. In particular, in Chapter 4 the strength
of integrated collaborative technologies in supporting construction project team
collaboration is tested. In Chapter 5 the strength of team collaboration and proactive
behaviour is tested. In Chapter 6 the strength of integrated collaborative technologies
in construction project team collaboration is tested. Chapter 7 includes the research
assessment, the contribution to knowledge, impact and future work. References and
appendices relevant to the research can be found at the end of this chapter.
Figure 1.2. Research Structure
1.5.Summary
This chapter introduces the foundation and motivation (research problem) for this
PhD research, as well as the aim and objectives of the research. In addition, the
structure of the thesis is outlined. In the next chapter, the discussion of the secondary
Chapter 2 – Literature Review
7 | P a g e
Chapter 2 - Literature Review
2.1. Management of Construction Projects
Academics and industry experts attempt to define what project management is from
different points of view. Meredith et al. (2012, 2006) defined Project Management
from a managerial approach, whilst Kerzner (2006) identified project management as
oriented processes similar to the traditional project management methods such as
PMBoK introduced by the Project Management Institute. Another opinion comes
from Morris (1994) who argued that if a manager wants to manage a project
efficiently and effectively, a human centric approach should be adopted, while
Shenhar (2004) and Stacey (2007) saw project management as a strategic approach.
At the same time Koskela (2002) believed that the current definitions of project
management are obsolete, while Morris et al. (2006) believed that there is not yet an
adequate definition (Morris et al., 2006). It would appear from the above that, at the
very least, the definition is incomplete.
According to Kerzner (2006) and Egbu (1999) a project manager should bring
together three principles: responsibility, accountability and authority. They argue that the project manager has the responsibility to collect specific resources (capital,
materials, equipment, facilities, information, and personnel) as inputs in order to
achieve the outputs effectively and efficiently (Morris et al., 2006). The weak link, as
identified by Baron and Besanko (1984), is between information, control and
organisational management, with this weak link acting as a barrier to the achievement
of set objectives. As a result a project manager cannot be accountable, which leads to
the lack of trust between team members. Arguably, the communication link between
team members (stakeholders) is not efficient and effective, and consequently this
affects the decision making and management (process) control within a project and an
organisation (Williams et al., 2004).
8 | P a g e project or a process due to the thirst for power. Thomas (2006:92) suggested that
project management increases process control during the progress of a work/task
(Project Life Cycle – PLC) and subsequently over the people who are involved as a
part of the project life cycle. Henceforth, this situation affects how the group of
people work together collaboratively. This team collaboration impacts on internal
communication and thus on the project life cycle performance or project performance
(the key performance indicators, introduced by the United Kingdom Government in
2000).
Team collaboration aims to bridge communication gaps within a team.
Communication requires access to data, information and knowledge in order to assist
humans in making efficient decisions. These are the principles of the hierarchy of
human understanding as required by Tuomi (2000). As a result a team has to have
access to data, information and knowledge. This access to data and information
mainly helps project managers to enhance their knowledge in terms of pre–
identifying, understanding and dealing with problems. For this reason, project
managers focus on and invest in capital and time in the conceptual phase of a project
(Dinsmore, 2006; Morris 2005). As a result construction companies estimate that a
problem solution in the later phases of a project can cost 10 times more to rectify than
when identified earlier (KPI, 2011). Therefore, the need to pre-identify problems is a
major priority in the construction sector.
During the last two decades information and communication technologies (ICTs) have
played a significant role in helping construction project managers to pre-identify
construction projects. The state-of-the-art is collaborative technologies that allow
team members to enhance team collaboration by sharing data and information
between construction project stakeholders. Building information modelling (BIM) is
collaborative technology that can support sharing documentation, files, and drawings
in 3D/4D/5D dimensions interactively between the stakeholders (Kiviniemi, 2010).
The biggest challenge, however, is to use integrated collaborative technologies to
fulfil the need of project managers to gather data and information from other systems,
e.g. Enterprise Resource Planning Systems (ERPs). In these systems the following
Chapter 2 – Literature Review
9 | P a g e project human resources, project financial resources, project information flow, project
supply chain, etc. (Hosein, 2004). This is the aim of the BIM Strategy, Level 3,
published by the BIM Task Group in March 2011, which helps all stakeholder
members to be involved at an early stage so as to design the project according to the
client’s requirements with the project manager being in control.
Arguably, there is a need to identify a model/framework that could support
construction project managers to enhance project performance by using these
integrated collaborative technologies. However, before this can be discussed further,
it is vital to understand the role of a construction project manager and what he/she
requires in order to satisfy project performance.
2.2. Construction Project Managers’ Roles
In order to focus on successful project management a number of key behavioural
factors have emerged. Slevin & Pinto (2008) identify 12 factors that are crucial in
impacting on the behavioural issues relating to project management. These
state-of-the-art factors range from micro (individual) issues to more macro (organisational)
issues and, due to the increasing needs of new businesses, create a challenging
environment. As a result of the state-of-the-art analysis of project management, it is
evident that there is no activity which addresses the impact of globalisation, which has
little control over the lower levels of resources and relies on inter-organisational trust.
The 12 factors mentioned above are listed in table 2.1. For further information see
10 | P a g e KEY BEHAVIOURAL FACTORS
Twelve Key Behavioural Factors for Successful
Projects
Definitions
MICRO 1. Personal Characteristics
It has been suggested for some time that project management skills are closely related to key general management skills. The 12 dimensions are: planning and organising, technical and professional knowledge, oral communications, listening, written communication, sensitivity, group leadership, job motivation, analysis, judgments, and initiative.
2. Self–Motivation The project manager must be a motivational genius. He/she must have a high level of self-motivation and also be quite skilful at motivating the project team, often under situations of inefficient resources, low team member commitment and morale, and formal authority.
3. Leadership Leadership is crucial for effective project management in terms of team building and its control across the varying phases of the project life cycle.
4. Communication Every time information is exchanged, time is expended and project resources are consumed. Communication of a project vision to all affected stakeholders can be a tremendously important step in the process.
5. Staffing Careful staffing of an organisation has long been known as a secret to success.
6. Cross–functional Cooperation
Chapter 2 – Literature Review
11 | P a g e functional cooperation.
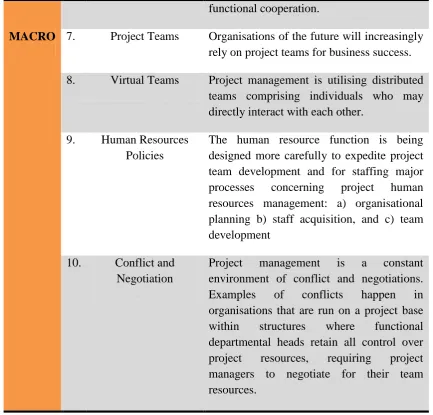
MACRO 7. Project Teams Organisations of the future will increasingly rely on project teams for business success.
8. Virtual Teams Project management is utilising distributed teams comprising individuals who may directly interact with each other.
9. Human Resources Policies
The human resource function is being designed more carefully to expedite project team development and for staffing major processes concerning project human resources management: a) organisational planning b) staff acquisition, and c) team development
10. Conflict and Negotiation
[image:25.595.81.515.93.508.2]Project management is a constant environment of conflict and negotiations. Examples of conflicts happen in organisations that are run on a project base within structures where functional departmental heads retain all control over project resources, requiring project managers to negotiate for their team resources.
Table 2.1. Key Behavioural Factors captured from Pinto and Morris (2009)
What is observed so far is the importance of human contribution to the excellence of a
project. Human involvement is the enabler of the successful completion of projects.
What makes the difference in enhancing the success of a project is the interaction
between humans. This interaction between the project manager and his/her team
members is known as team collaboration. According to Montiel-Overall (2005), team
collaboration is defined as a repeated process where two or more people or
organisations work together in pursuit of joint common goals, i.e., creation in nature
by sharing knowledge, learning and building consensus. Most collaboration requires
leadership, although the form of leadership can be social within a decentralised and
12 | P a g e and recompense with different types of resources (i.e., financial). Successful teams
are those where collaboration is engaged not only to solve a problem (Greene, 2004)
but which is capable of anticipating a problem and thus making efficient decisions
(Voiklis, 2009). This engagement is the biggest challenge. In order to validate the
above an in-depth analysis of managing construction project challenges will be
discussed in the following section.
2.3. Challenges of Managing Construction Projects
The researcher has been influenced by the ‘Eye of Competence’, introduced by the International Project Management Association (IPMA) (1999, 2001 and 2006), to
analyse construction project management challenges. These challenges are listed
below:
Technical Challenges (Technological Challenges): the unstructured process and
the transformation of the information among the tasks into the project
management life cycle.
Human Behavioural Challenges (Social Challenges): acting as barriers between
people communicating during the project management life cycle.
Contextual Environment Challenges (Knowledge Challenges): the
non-constructive structure of a project during the design phase of the project - before
entering into the project management life cycle.
2.3.1. Analysis of Technological Challenges
So far the importance of linking human skills and technology with the intention of
benefitting the management of projects within the organisational context has been
widely observed. As a result, at organisational level, the orientation of information
needs to be highlighted. Marchand et al. (2001, 2007) suggests that a way to achieve
this is with strong IT practices, competent management of information and good
information behaviours and values. These three elements must be well-built and
function well together in order to achieve business goals and to address information
Chapter 2 – Literature Review
13 | P a g e
2.3.1.1. Information Maturity
Information maturity leads to making more effective and efficient decisions. As
regards the hierarchy of human understanding (from Data to Information then to
Knowledge and finally Wisdom) learning is enabled as the catalyst for the transfer
from information to knowledge and to wisdom and, arguably, to making decisions.
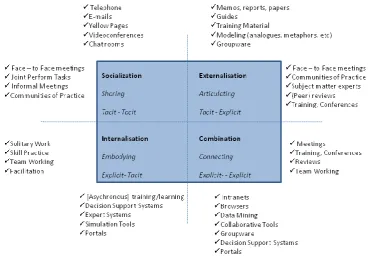
Nonaka and Von Krogh (2002) illustrate what is known as the SECI Model (figure
2.1). This model could be useful in enhancing the technical challenges in managing
projects more effectively and efficiently as, by resolving and using technical
challenges, human behaviour changes.
Figure 2.1 Learning and support mechanisms by Nonaka and Von Krogh et al. (2002)
By using this model concept, ideas and facts are easier to be understood by project
managers and their clients, stakeholders, suppliers and shareholders during the project
[image:27.595.126.495.314.574.2]14 | P a g e innovation. As a direct result, the need arises to develop a space in which
stakeholders, including the project manager and clients, can share their intellectual
capital. In this scenario the team’s intellectual bandwidth should work as a function
not only of the members’ capacity to transfer data into wisdom but of their ability to
collaborate.
Considering all the above, with the combination of the five mentioned elements, data,
information, knowledge, integrated collaborative technologies and human
understanding, changes will occur at both organisational and operational (project)
level which reflect interactively all these elements. In particular, collaborative
environments work as enablers in order to enhance the information, the human
behaviour and the context of a project. At this stage it should be mentioned that the
context relates to information. Information is a term with many meanings depending
on context (Liu et al., 2004). Thus three elements - information maturity, human
behaviour and integrated collaborative technologies – have been used up to this stage.
The following figure (2.2) illustrates how these 3 elements interrelate in order to
establish an innovative interactive project information maturity “model”.
Figure 2.2.Innovative Interactive Project Information Maturity
By using the above interaction the above mentioned changes are taking place in team
members’ behaviour. This occurs as learning processes are activated so that humans
will understand information in a better manner. When humans feel more confident
with information and can understand in detail a task of a project, they develop skills
such as anticipation, change-orientation and self-initiative (Grant and Ashford, 2008);
Integrated
Collaborative
Technologies
Chapter 2 – Literature Review
15 | P a g e these skills enable the team member and the project manager to behave in a more
proactive mode (Grant and Ashford, 2008). More will be discussed on the subject of
human (social) challenges later.
2.3.1.2. Integrated Collaborative Technologies
In 2002 Wainhouse Research & First Virtual Communication Inc stated that,
‘integrated collaboration environments allow enterprises to realise a number of competitive advantages by using their existing computers and network infrastructure for group and personal collaboration. These new fully-featured environments take the best features of both traditional videoconferencing and web collaboration and combine them to enable teams to work together interactively through a browser-based interface’.
Ibrahim (2011), Steven et al. (2009) and Kiviniemi (2009) mention that integrated
collaborative technologies (ICTs) consist of:
Collaborative software designed to improve the performance of teams by
supporting the sharing and flow of information. It allows for real-time
collaboration and conferencing but also asynchronous collaboration.
Workflow systems facilitate the automation and management of business
processes.
Documentation management systems manage a document through all the stages
of its processing.
Peer-to-peer collaboration software permits users to communicate in real time
and share files without going through a central server.
Knowledge management systems are information technology (IT) systems that
support the capture, organization, and distribution of knowledge (know-how).
Social network systems are IT systems that link people to others they know and,
from there, to the people their contacts know. They are a way to leverage personal
and professional contacts.
Collaborative Design allows project stakeholders to design construction projects
16 | P a g e Collaborative tools help facilitate action-oriented teams working together over
geographic distances by providing tools that aid communication, collaboration and the
process of problem solving. Technology Integration is the use of technology tools in
general content areas in businesses in order to allow stakeholders to apply computer
and technology skills to learning and problem-solving. Collaboration requires
individuals working together in a coordinated fashion, towards a common goal.
Arguably Integrated Collaborative Technologies are those tools that can help
stakeholders work collectively towards problem solving without considering
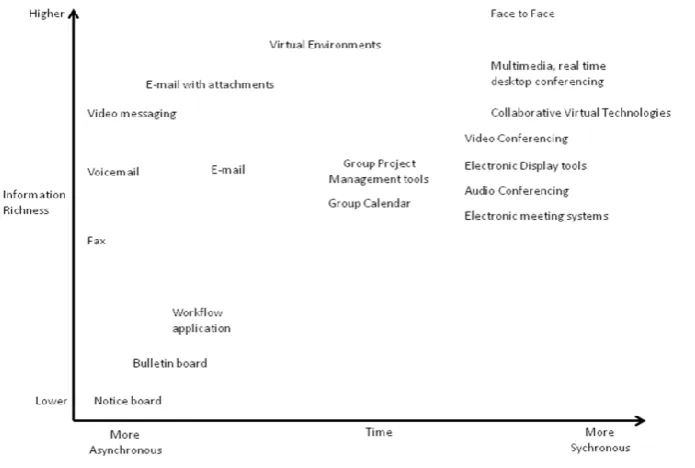
geographical distance. These technologies could work either in a synchronous (real
time) or asynchronous (not real time) manner, so allowing the stakeholders or the
team members to share documents or files from anywhere at any time (figure: 2.3.).
Figure 2.3: Comparing Technologies adapted from D70 (CoSpaces Project, 2010)
There is a great demand to design and deploy integrated collaborative environments
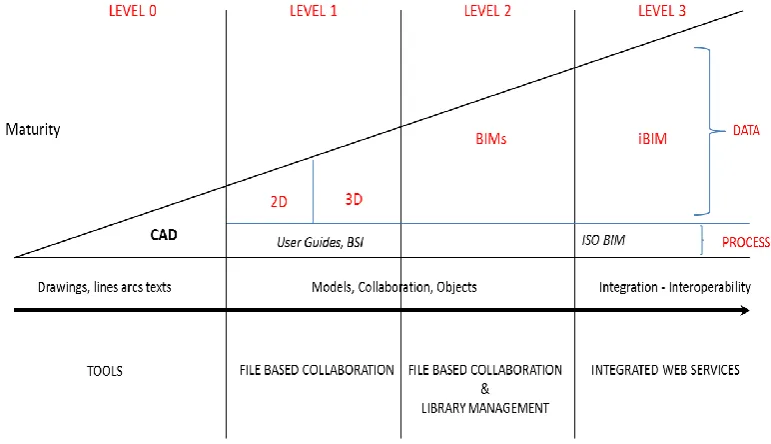
within the construction industry and, based on the UK Government Building
Information Roadmap (figure 2.4), the implementation of BIM in national industry is
“almost” at level 2 and requires to be implemented by 2016 (Philips, 2012). At this
level there is a need to use construction commercial data managed by an ERP
(Enterprise Resource Planning Systems) and this is where the need for the
[image:30.595.114.462.333.567.2] Chapter 2 – Literature Review
[image:31.595.114.500.95.317.2]17 | P a g e Figure 2.4. Building Information Modelling (BIM) Roadmap adapted by BIM Task
Group (2011)
Furthermore, in order to be implemented successfully, BIM requires transition from
the traditional management theory to lean management theory.
The statements made by Winch in both his books (2001 and 2010) on Lean
Management and BIM in the context of managing construction projects were refuted
by Ballard and Koskela (2011) who have the opinion that:
Lean construction is a form of bureaucracy, as opposed to the professionalism Winch advocates.
Lean construction has its roots in high-volume lean manufacturing and is thus constrained to “high volume construction”, rather than one-off projects.
Lean construction is limited to site construction, and separates designing and making (implementation).
Lean construction is applicable only to slow, simple and certain projects.
Lean construction is limited to the production of standard products.
Therefore BIM and Lean Management could cooperate when a project manager sees
the task as a project and thus will be in a position to reduce the bureaucracy, to
separate the design and the implementation stage of a project and to control the
18 | P a g e collaborative environment, are the mechanisms that are developed to focus on trust
and relationships between team members (stakeholders).
At this stage the author brings forward some principles and understanding of how
BIM and Lean Management benefit a construction project. In particular, Dave (2013)
stated primarily that it is at the early project design stage where a project manager can
define project value(s) to the client, quickly evaluate alternative solutions, identify
procurement strategy and target value design. An additional benefit is to be found in
detailed design where team collaboration plays a significant role in supporting
collaborative design, constructive feedback, intellectual property rights and clash
detection. Nevertheless, a significant consideration is the validation of information
from a trusted resource. Construction benefits from the use of Lean and BIM tools
and processes lie in the co-location of the supply chain, collaborative production
planning using 4D and 5D, and model based prefabrication that helps to achieve the
goals of waste minimisation and value retention (and generation). Moreover, the main
focus is in avoiding the creation of conflicts and duplication of processes. During
construction, it is important to monitor the progress of construction work to compare
planned activities with work completed to allow the stakeholders to focus on tasks
that have fallen behind schedule (Harty et al., 2010). Facilities and Operation
Management benefits are that the BIM process workflow enables the recording and
delivery of as-built information which can be linked with facilities management
systems and processes. Therefore, two main principles of the above analysis are the
deployment of trust and information management.
Suppa (2008) states that development of trust is an integral component of effective
teams, successful partnering and implementing new technology. Building and
maintaining trust between contracting parties can lower costs, improve performance
and minimize disputes. According to Nikas et al., (2007) the construction industry is
entering a new era where using technologies can improve collaboration on
construction projects. Collaboration is an intended process that creates value beyond
communication and is dependent on the trust of the collaborators (Vangen and
Huxham, 2003). It is driven by a desire to solve problems, create solutions, or to
Chapter 2 – Literature Review
19 | P a g e primary research. Moreover Nikas et al. (2007) found that collaborative technologies
foster collaboration in the construction industry with the intention of improving
project management, information management, transaction time, transparency of
project information, relationships between partners, communication, schedule, costs
and profitability. However, collaborative technologies are not widely used and are
perceived as ineffective due to the lack of trust in the technologies and/or the lack of
trust between the collaborators (Brown et al., 2004; Panteli and Duncan, 2004; Peters
and Manz, 2007). As a result there is a need to change the mind-set of stakeholders in
construction projects in a manner which supports and enhances trust between the team
members. The following table 2.2. illustrates the factors that could be enhanced
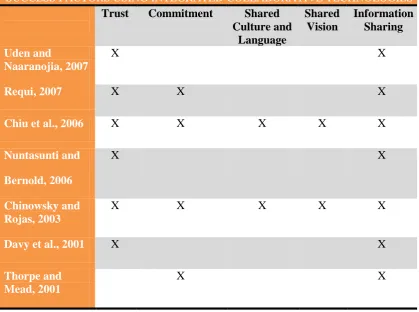
through Integrated Collaborative Technologies.
SUCCESS FACTORS USING INTEGRATED COLLABORATIVE TECHNOLOGIES
Trust Commitment Shared
Culture and Language
Shared Vision
Information Sharing
Uden and
Naaranojia, 2007
X X
Requi, 2007 X X X
Chiu et al., 2006 X X X X X
Nuntasunti and Bernold, 2006
X X
Chinowsky and Rojas, 2003
X X X X X
Davy et al., 2001 X X
Thorpe and Mead, 2001
[image:33.595.86.506.343.655.2]X X
Table 2.2: Success Factors using Integrated Collaborative Technologies
Uden and Naaranojia (2007) state that trust is defined as the willingness of a party to
be vulnerable to the action of another party based on the expectation of a favourable
20 | P a g e as synchronous discussion with the ability to exchange project information and real
time data manipulation and exchange. Commitment is defined as the participation and
follow-through of a project team (Thorpe and Mead, 2001) where the shared language
and culture is the common understanding between team members, allowing them to
gain access to the information they require (Chiu et al., 2006). The same authors in
the same article state that shared vision is a bonding mechanism that helps different
team members focus their resources on common goals. Thus integrated collaborative
technologies assist project stakeholders in achieving the above features towards
attaining a common goal.
Hence it is clear that the use of integrated collaborative technologies in construction
projects could potentially benefit all project stakeholders in encouraging sharing and
trust by being collaborative and consequently proactive.
2.3.2. Analysis of Behavioural Challenges
This section discusses the two main behavioural challenges that arose in the previous
section 2.3.1: team collaboration and proactive behaviour within the construction
sector.
2.3.2.1. Team Collaboration in construction projects
Research into collaboration spans a number of disparate fields such as organisational
and social psychology, human factors, computer science, management science,
education, and healthcare. In March 2009 the University of Nottingham, a partner in
the European Funded project CoSpaces, published the attributes which influence and
form part of collaborative work as well as developing an explanatory, descriptive
model in order to enable a unified understanding of what it is to collaborate, and how
best to communicate this to industry and to support collaborative work based on this
understanding.
The technique/method followed to check the validity of this research was
semi-structured interviews with the CoSpaces user partners, and through drawing on the
broad experience of working with a range of industrial organisations. The main
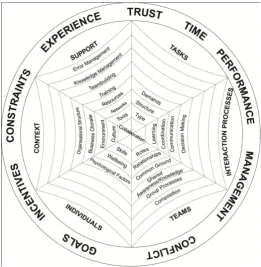
factors (individuals, teams, interaction processes, tasks, support, context and
Chapter 2 – Literature Review
21 | P a g e their relevance and importance to collaborative work. In addition, in order to assess
how meaningful the factors in the model are, a series of card sorting exercises with
human factors experts took place. This study showed that there was general
agreement on the main factors proposed for the model of collaboration. Moreover,
groups of human factors experts were also asked to review the 27 different
representational styles for a model of collaborative work which incorporated the
factors that had been considered during the card sort. The outcome of this research is
[image:35.595.167.429.267.535.2]illustrated in figure 2.5.
Figure 2.5.: Team collaboration model adopted by Patelli et al. (2012)
In particular, the external factors that influence building collaboration in a business
environment and in a project are: trust, time, performance, management, conflict,
22 | P a g e
EXTERNAL FACTORS OF TEAM COLLABORATION
FACTORS DESCRIPTION
Trust Trust aims to engage and enable people in business with
each other. Trust and willingness to communicate and
share information openly indicate collaboration. Face to
face communication is most important in building and
boosting trust amongst colleagues, including social
interactions and regular communication.
Time In a business environment time is crucial due to the
nature of helping to organise and structure how teams
work, its influence on the team climate (motivation) and
the quality of individuals’ experiences. Deadlines exist
in order to help to structure work and time pressure and
make employees work effectively. In addition, real time
contribution to a team process can lead to team
prosperity.
Performance Within the performance factor the following activities
should be included: perspective including keeping to
project budgets and deadlines, profits, time saved,
meeting or improving the required quantity and quality
of product/service, improving work processes,
innovation, achieving goals, meeting requirements,
improving relationships, extending professional
networks, generating new business, learning, individual
and team satisfaction and wellbeing, improving trust and
commitment, reducing errors, high level of safety,
Chapter 2 – Literature Review
23 | P a g e
Management Management requires improved work productivity, team
effectiveness, employee satisfaction, clear direction and
guidance to individuals and teams, and communication
of any necessary constraints on team behaviour. In the
project management world management consists of
setting communication goals and objectives, forming
and maintaining teams, planning tasks, assigning tasks,
setting deadlines, monitoring status of tasks and
resources, ensuring that the work delivered is of the
required quality and performance and within the allotted
budget and timeframe, monitoring and reviewing
changes in the environment and adapting the team,
objectives, tasks, processes and strategies as necessary,
setting performance expectations, providing feedback on
individual and team performance, coaching the team,
creating a positive working atmosphere, and managing
conflict.
Conflict Conflict results when there is an incompatibility
between people’s values. However, conflict may have a
positive impact due to the nature of causing people to be
creative due to the wider discussion and understanding
of issues and alternatives as well as increasing
participation in work and effective decision making.
Goals Goals aim to present a clear understanding of task and
organisational objectives. and employees should be
aware of any changes in priorities over time. In a
modern business environment it is key for a group of
people to work collaboratively in order to satisfy
company objectives and aims.
24 | P a g e business/project environment may include financial
rewards, recognition of contributions to work,
enhancing visibility or improving status within the
workplace, more/shared responsibility, shared risks,
interesting work, reduction of workload, building
professional and personal relationships with others, and
the satisfaction of having achieved something.
Constraints Constraints in a business or project can be: at an
individual and team level; at a process and task level;
resources including finance, personnel and materials;
culture and barriers such as hierarchy.
Experience Experience involves individual, team and organisational
familiarity with the business and with project process,
tasks and technologies. Experience matters in making
effective and efficient decisions as well as in helping
employees to predict each other’s behaviour with the
intention of reducing the demand in communication and
workload.
Table 2.3: External factors of collaboration at work
The internal factors influencing the building of collaboration in a business are: teams,
individuals, context, support, tasks and interaction processes (Table 2.4). In order for
external and internal factors to be applied during the project management life cycle a
Chapter 2 – Literature Review
25 | P a g e
INTERNAL FACTORS OF TEAM COLLABORATION
FACTORS DESCRIPTION
Tasks Types of task must be identified in term of scope,
demands, strategies and communication. Task structure
involving collective activities require input from multiple
individuals simultaneously or frequent interaction between
individuals or teams. There are tasks which require input
coordination and communication, the effectiveness of
which will impact on productivity. Tasks differ in the
demand they make on individuals, teams and processes
which, in turn, impact on employee wellbeing and
productivity.
Interaction process The key actions and behaviours across the interaction
process lead to the learning that incorporates the
development and improvement of new skills, to new
knowledge to satisfy team task performance, to being
flexible and dynamic, and to improving the quality of
working life. In addition to this, coordination assists in
meeting goal settings, managing and integrating people
and information, setting and managing time schedules and
planning and managing divisions. Communication as an
additional behaviour enables people to understand the
nature of a problem coherently and to share information
synchronously or asynchronously. Furthermore, the
decision making process as an action involves both
intellectual and judgmental tasks influencing team
outcomes.
Teams Team relationships refer to group dynamics, interpersonal
cohesion, task cohesion, professional, social and personal