DATA ENVELOPMENT ANALYSIS FOR MEASURING THE
EFFICIENCY OF HEAD TRAUMA CARE IN ENGLAND AND WALES
by
Afaf Nafea Alrashidi
This thesis is submitted in partial fulfilment of the requirements for the degree of
Doctor of Philosophy at the University of Salford Manchester
Salford Business School
Table of Contents
CHAPTER ONE: INTRODUCTION AND STRUCTURE
1.1Introduction…...………..1
1.2Background………...……….1
1.3 Research Aims and Methodology…...……….3
1.4 Data Source……...……….5
1.5 Study Outline…...………..6
CHAPTER TWO: APPROACHES FOR MEASURING EFFICIENCY IN HOSPITALS 2.1 Introduction………...…9
2.2 What is Performance Measurement? ………...…..10
2.3 Need to Measure Performance………...………...11
2.4 Concept of the Production Frontier and Efficiency………...13
2.5 The Measurement of Efficiency………....…….15
2.6.Methods of Efficiency Measurement………...18
2.6.1 Ratio Analysis...19
2.6.2 Regression Analysis………...19
2.6.3 Frontier Analysis...21
2.6.3.1 Parametric Frontier Analysis...21
a. The Deterministic Parametric Frontier………...22
b. Stochastic Frontier Analysis (SFA)...………....23
2.6.3.2 Non-parametric Frontier Analysis...24
a. Non-parametric Deterministic Frontier………....…25
a. 1 Data Envelopment Analysis (DEA).………25
a.2 Free Disposal Hull (FDH).……….25
b. Non-parametric Stochastic Frontier (Stochastic DEA)………....26
2.7 Empirical Studies on Measuring Efficiency in Health Care………...27
2.7.1 Identifying a Hospital Production Model (Inputs and Outputs)………...……31
2.8 Explaining the Differences in Technical Efficiencies among Hospitals…………...…….33
2.9 Conclusion...……….35
CHAPTER THREE: RESEARCH METHODOLOGY 3.1 Introduction………...37
3.2 Data Envelopment Analysis (DEA)………...38
3.2.1 Charnes, Cooper and Rhodes (CCR) Model………...40
3.2.3 Bootstrapping DEA………...51
3.2.3.1 The Concept of Bootstrapping………...52
3.2.3.2 Studies using DEA and Bootstrapping Approaches………...55
3.3 DEA based Malmquist Productivity Index………...56
3.4 Other Methodological Considerations………...62
3.4.1 Choosing Inputs and Outputs...……….62
3.4.2Input/OutputOrientations………...66
3.4.3Returns to Scale………...………...………..66
3.5Sample Selection.………...……...………..68
3.6Conclusion………...………...……….69
CHAPTER FOUR: DATA ENVELOPMENT ANALYSIS WITH MISSING DATA 4.1Introduction………...………...70
4.2 Background………....…………...………..70
4.3 Methods for Dealing with Missing Data in DEA………...………...………70
4.4 Multiple Imputation………...……….72
4.4.1 Specification of the Imputation Model………...…...74
4.4.1.a. Imputation Using the Multivariate Normal Model………...74
4.4.1.b. Imputation Using the Chained Equations Approach………....…...74
4.4.2 Advantages of MICE and Comparison with MVN...……….75
4.5 Adaption of MICE for DEA Applications………...76
4.6 Methodology………...………...77
4.7 Empirical Analysis: A Case of HTI Hospital Efficiency in 2009………...84
4.8 Conclusion………...88
CHAPTER FIVE: INTEGRATED DEA WITH STRUCTURAL EQUATION MODELLING 5.1 Introduction..………..90
5.2 DEA with Environmental Variables………...………...90
5.3.1 Introduction of Structural Equation Models………...95
5.3.2 Direct, Indirect and Total Effect………...96
5.3.3 DEA with SEM Methodology………...97
5.4 Tobit Regression………....98
5.5 Example Empirical Study: DEA with SEM: A Case of HTI Hospital Efficiency...…..100
5.5.1 Variables Description………100
5.5.2 Stage 1: DEA Analysis……….101
5.5.3 Stage 2: Structural Equation Models (SEM) Analysis……….……….101
5.6 Results and Discussion……….104
5.6.1 Influence of Demographic Variables on Severity Patient Variables……….………....104
5.6.2 Influence of the Severity Injures on Efficiency Score………..105
5.6.3 Influence of Demographic Variables on Efficiency Score………....105
5.6.4 Influence of Neurosurgical Unit in Treating Hospitals on Efficiency Score...106
5.6.5 Influence of Years on Efficiency Score………....107
5.6.6 Direct, Indirect and Total Effect………..………..107
5.7 Conclusion………...……….108
CHAPTER SIX: EMPIRICAL STUDY: DATA DESCRIPTION AND ANALYSIS 6.1 Introduction………...………...110
6.2 Data Description………...110
6.3. Missing Data Replacement: Imputation by Chained Equations………...112
6.4 DEA Efficiency Results..…...………...118
6.4.1 Pure Technical Efficiency…………...………...……….119
6.4.2 Reference (Peer) Groups………...122
6.5 Targets……….………...…125
6.6.Improvements………...127
6.7 Analysis of Robustness and Stability of Efficiency Scores Over Time………...129
6.8 Characteristics of Hospitals………...…………...134
6.8.1 Efficiency Across Hospital Operating Type………...………...….134
6.8.2 Malmquist Productivity Index Results………...……….136
6.8.3 Technical Efficiency Change………...………..137
6.8.4 Technological Change………...………....139
6.8.5Total Factor Productivity………...……….140
6.9 Second Stage: SEM Analysis………...……….144
6.9.2. Structural Equation Models…...……….146
6.9.3 Results of SEM and GSEM Estimates of Inefficiency and Bootstrap-Inefficiency Scores………...………....148
6.9.4 Influence of Demographic Variables on Severity of Injured Patients Variables ………...……..150
6.9.5 Influence of the Severity of Injured Patients on Efficiency………...…….151
6.9.6 Influence of Demographic Variables on Efficiency…………...………...151
6.9.7 Influence of the Neurocritical Unit on Efficiency………...152
6.9.8 Influence of Time (years) on Efficiency………...152
6.9.9 Indirect and Total Effect...………152
6.10 Conclusion………...……….153
CHAPTER SEVEN: RESEARCH FINDINGS AND CONCLUSIONS 7.1 Introduction………...156
Overview of the Research Findings………...156
First Stage Results………...156
7.2.2 Malmquist Productivity Index Finding...………...159
7.2.3 Second Stage Results………...160
7.3 Recommendations………...161
7.4 Contributions of the Study………...163
7.5 The Study’s Limitations………...165
7.6 Directions for Future Research………...166
7.7 Concluding Remarks………...168
References………...169
List of Tables
Table 1.1: Assessment of injury severity (adapted from Hawley et al., 2004)………...2
Table 1.2: Glasgow Outcome Scale (adapted from Jennett and Bond, 1975)……...2
Table 2.1: Examples of hospital inputs………...32
Table 2.2: Examples of hospital outputs………...33
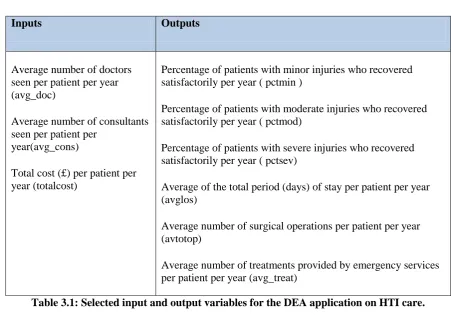
Table 3.1: Selected input and output variables for the DEA application on HTI care………...……….63
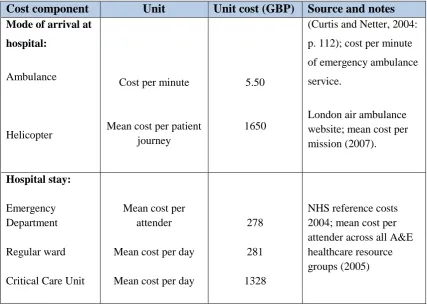
Table 3.2: Unit costs used for DEA analysis………...……….64
Table 3.3: Environmental variables………...65
Table 4.1: Imputation models for different types of variables………...76
Table 4.2: List of inputs and outputs………...….78
Table 4.3: MICE scenarios and MAE………...80
Table 4.4: MICE scenarios and RMSE………...82
Table 4.5: MICE scenarios and MAX-AE………...83
Table 4.6: Descriptive statistics for input and output data………...86
Table 4.7: Summary of hospitals’ technical efficiencies……….88
Table 5.1: Environmental variables………100
Table 5.2: Descriptive statistics of the input and output variables………...101
Table 5.3: Summary of hospitals’ technical efficiencies………...101
Table 5.4: Descriptive statistics of the environmental variables………...102
Table 5.5: Correlation between environmental variables and DEA inputs……...103
Table 5.6: SEM for inefficiency score using ML estimation………...106
Table 5.7: Direct, indirect and total effect of gender and age variables on efficiency………...…………..107
Table 6.1a: Percentage of missing data………...…….113
Table 6.1b: Pattern of missing data………...113
Table 6.2: Descriptive statistics on input and output data………...118
Table 6.3: Annual average pure technical efficiency scores………...…120
Table 6.4: Distribution of level of pure technical efficiency (%)………...121
Table 6.5: Reference groups of hospitals over the study period………...…123-124 Table 6.6: Improvement level for inefficient HOSPITAL- 13 (2009)………...128
Table 6.7: Annual average bootstrap and original efficiency scores………...129
Table 6.8: Spearman correlations for efficiency scores over the period of study……...130
Table 6.10: Summary statistics of Model 1 and Model 2………...…….132
Table 6.11: Spearman correlations for efficiency scores of Model 1 and Model 2……...132
Table 6.12: Spearman correlations for efficiency scores over the period of study……...133
Table 6.13: Friedman's test of DEA efficiency by year………...…133
Table 6.14: Annual average pure technical efficiency scores by hospital types………...134
Table 6.15: Mann-Whitney test for 2009- 2012 results………...…135
Table 6.16: The Average Technical efficiency change and its decomposition………...…137
Table 6.17: Cumulative decomposition of technical efficiency change………...138
Table 6.18: Technological change and cumulative technological change………...140
Table 6.19: Decomposition of Malmquist productivity indices………...141
Table 6.20: Cumulative Malmquist indices………...142
Table 6.21: Malmquist productivity indices and its components………...…143
Table 6.22: Environmental variables………...146
Table 6.23: Descriptive statistics of the environmental variables………...146
Table 6.24: Correlation between environmental variables and DEA inputs…………...148
Table 6.25: SEM and GSEM for inefficiency score using ML estimation………...149
Table 6.26: SEM and GSEM for bootstrap-inefficiency score using ML estimation………...150
Table 6.27: Indirect and total effect for inefficiency scores………...153
List of Figures
Figure 1.1. Thesis Structure………...6
Figure 2.1: The production frontier………...14
Figure 2.2: Farrell's efficiency measures….………...16
Figure 2.3: Regression analysis………...20
Figure 2.4: The deterministic production frontier...………...23
Figure 2.5: The stochastic production frontier………...24
Figure 2.6: The FDH approach to efficiency………...26
Figure 3.1: The CCR production frontier...………..45
Figure 3.2: BCC Technical efficiency model………...………..49
Figure 3.3: The difference between the CRS and VRS production frontiers……...……..50
Figure 3.4: The input-based Malmquist productivity index………...57
Figure 4.1: Multiple imputation process………..72
Figure 4.2: MICE scenarios and MAE.………...81
Figure 4.3: MICE scenarios and MSE83………...83
Figure 4.4: MICE scenarios and MAX-AE………...84
Figures 4.5.a to 4.5.c: Distributions of variables with missing data before and after imputation ……….……….87
Figure 5.1: Example of path diagram for SEM………...96
Figure 5.2: Path diagram for SEM...………...104
Figures 6.1a to 6.1c: Normal q-q plots of the missing variables………...………..114
Figures 6.2a to 6.2c: Histograms of observed and imputed values for variables with missing data………...…………115
Figures 6.3a to 6.3c: Distributions of variables with missing data before and after imputation (2009)………...…117
Figure 6.4: Distribution of pure technical efficiency scores (2009-2012)…………...122
Figure 6.5: Average target level of the input variable over the study period………...126
Figure 6.6: Average target level of the input variable over study period (2010-2012) ………...127
Figure 6.7: Average pure technical efficiency by hospital types…………...…………135
Figure 6.8: Technical efficiency change and its components………...…….138
Figure 6.9: Cumulative Technical efficiency change and its components…...……….139
Figure 6.10: Malmquist Indices for HTI hospitals………...….141
i
Acknowledgements
First of all, I would like to thank my parents for their conditioned love and support in making me the person that I have become, and to give my endless thanks for their persistent encouragement throughout the duration of my education, both past and present, although my appreciation cannot compare with the sacrifices and unconditional motivation that they have instilled
I also need to state my unwavering gratitude to my supervisor at the University of Salford, Professor David Percy, who has provided me with perpetual support, expert advice and overall guidance on the structure and evaluation of my writing.
Next, in relation to the provided data, I owe a special debt of gratitude to The Trauma Audit Research Network (TARN), as without their support it would not have been possible to complete this research.
ii
Declaration
iii ABSTRACT
This research develops a comprehensive model for evaluating the efficiency and productivity of the sector of head trauma injury (HTI) care in England and Wales, in order to reduce the costs associated with trauma care. After assessing the advantages and disadvantages of various efficiency measurement approaches, the data envelopment analysis (DEA) methodology is chosen for this research, including both the DEA-based Malmquist index model and the bootstrapping DEA model.
Since the variables selected for these models include some missing data, the approach known as multiple imputation by chained equations (MICE) is proposed to deal with such missing data situations, in order to ensure the accuracy of the inferential and predictive results that our analyses generate. In addition, an experimental study is provided to simulate this approach, in order to investigate its validity as a methodology for replacing such missing values within DEA applications. This experimental study is based on a real data set of 66 hospitals provided by the Trauma Audit and Research Network (TARN), within Salford Royal NHS Foundation Trust. The results of this experimental study show that MICE works well and gives an acceptable estimate of true efficiency.
Furthermore, this research introduces a framework that combines DEA with structural equation modelling (SEM) in order to investigate the effects of uncontrollable variables on efficiencies. While the use of DEA provides valuable results, our SEM analysis reveals additional findings that were not identified in previous studies. For example, unlike previous second stage analysis studies in DEA that focused on only the direct effects of environmental factors on the efficiency scores, this study uses SEM to investigate further any indirect effects and the total effects of these uncontrollable factors on the efficiencies. This additional information is shown to be more useful and more informative than the results generated by the previous studies.
1
CHAPTER ONE: INTRODUCTION AND STRUCTURE
1.1 Introduction
Trauma is a major cause of death worldwide, with an estimated 5 million deaths each year. In the United Kingdom, at least one million patients, or 10% of all patients attending Accident and Emergency (A&E) services, present in hospitals each year with head injuries (Morris et al., 2008). Evaluations in recent times in regards to the trends of survival for post-trauma within the UK have indicated that minimal improvement has been achieved following 1994 (Lecky et al., 2002). It has been recommended by The Royal College of Surgeons and The British Orthopaedic Association that a system of trauma service should be implemented throughout the country which will be founded upon trauma systems of a geographical nature for the entirety of Britain (The Royal College of Surgeons, 2000). The idea was an attempt to improve the quality of trauma care by ensuring that the routine clinical practice of trauma in the UK is fully documented. This process involves the measurement of certain outcomes and costs involved.
Trauma care is expensive and a huge burden on healthcare systems, as well as national economies. There are many studies that have estimated and examined the cost of trauma (Haeusler et al., 2006; Morris et al., 2007; Morris et al., 2008). However, none of these studies examined the issue of reducing this cost for trauma care.
This current thesis uses an innovative approach to efficiency measurement, which is known as Data Envelopment Analysis (DEA), with the primary aim to calculate the minimum possible costs, which would allow optimal efficiency in trauma care. The approach is a relative technical efficiency measurement based on mathematical programming. DEA compares the performance metrics of a particular organisation, such as a hospital, with the relevant ‘best practice’ standards. Moreover, it can identify targets, improvements and practices required to help particular organisations to enhance their overall performance.
2
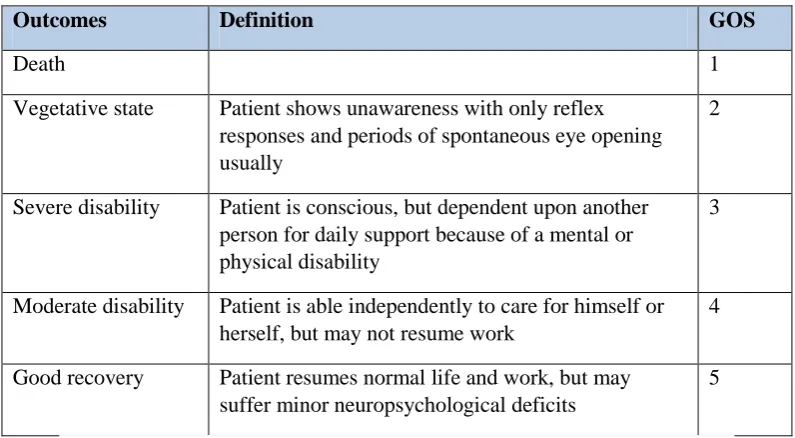
Head trauma injury (HTI) is a specific type of sustained brain injury, which is sometimes referred to as traumatic brain injury (TBI). It can happen when the brain receives damage from a sudden trauma. There are various incidents that can result in HTI, such as when the head suddenly comes into contact with an object in a violent manner, or in a moment that a particular object penetrates the brain tissue through the casing of the skull. Moreover, depending on the extent of the damage to the brain, the definition of TBI is often classified as mild, moderate, or severe. This classification of injury severity is evaluated by using the Glasgow Coma Scale (GCS), which is a measure of consciousness and it was developed by Teasdale and Jennett (1974), as seen in Table 1 (adapted from Hawley et al., 2004). Subsequently, the outcome after BTI is assessed by the Glasgow Outcome Scale (GOS), which was developed by Jennett and Bond (1975), as shown in Table 2.
Severity of HTI Definition GCS
Mild An injury causing unconsciousness for less than 15
minutes
13-15
Moderate An injury causing unconsciousness for more than 15 minutes
9-12
[image:14.595.99.497.528.747.2]Severe An injury causing unconsciousness for more than 6 hours 3-8
Table 1.1: Assessment of injury severity (adapted from Hawley et al., 2004)
Outcomes Definition GOS
Death 1
Vegetative state Patient shows unawareness with only reflex responses and periods of spontaneous eye opening usually
2
Severe disability Patient is conscious, but dependent upon another person for daily support because of a mental or physical disability
3
Moderate disability Patient is able independently to care for himself or herself, but may not resume work
4
Good recovery Patient resumes normal life and work, but may suffer minor neuropsychological deficits
5
3
The National Institute for Health and Clinical Excellence (NICE) guidelines, which were published in 2014, provided statistics associated with HTI in England and Wales (NICE, 2014). Firstly, the statistics showed that the most frequent cause of both premature death and disabilities was from head injuries for people aged between 1 and 40 in England and Wales. Indeed, 1.4 million people are attended to accident and emergency A&E departments annually due to head injuries in England and Wales. In total, the average percentage of these patients being children under 15 years old stands at 33%-50%.
The second factor from (NICE, 2014) statistics is that around 200,000 people are admitted to other hospital departments (not A&E) on an annual basis with injuries to the head, of which about one-fifth present with a degree of skull fracture or an evidential nature of damage to the brain. Additionally, there are certain patients who experience disabilities of a long-term nature, as well as those who occasionally fail to survive the onset of complications that could be potentially eradicated through early detection and appropriate treatment. Nevertheless, the majority of patients do in fact recover without a course of specialised intervention, and the death rates caused by injuries to the head remain low, as the statistics stand at 0.2% of all admitted patients into A&E from head trauma. Comprehensively, only 5% of all those who attend A&E from a head injury are categorised in the moderate or severe head injury groups. Hence, 95% of patients who attend the emergency department due to a head injury have a conscious level that is defined as normal or minimally impaired (GCS greater than 12). Finally, 25–30% is the estimated figure for children aged below 2 years old who are hospitalised suffering from head injuries that have resulted from direct abuse.
1.3 Research Aims and Methodology
4
evaluation of the efficiency and productivity of head trauma care. Therefore, the present study ultimately aims to extend the established literature on healthcare efficiency using DEA in the UK healthcare sector and, more specifically, the relevant literature on reducing head trauma care costs.
In order to measure the efficiency of HTI hospitals by using DEA, input and output variables should be defined. One of the most important input variables can be seen in relation to the total cost of hospital, which is usually distinguished from the number of beds as a proxy for this input variable. However, a better proxy for this particular input is used in this research, which is an economic methodology proposed by Morris et al. (2008) for estimating the total cost associated with HTI care. In addition, during the process of choosing the data, some were found to be missing and for this reason an appropriate methodology was required in order to deal with such missing data. As the most suitable method, imputation is proposed by the chained equations approach to handle these missing data, which is the first time that this approach has been adapted in a DEA context.
Moreover, this study attempts to estimate the impact of the uncontrollable factors (environmental variables) on HTI hospital efficiency. These factors include the characteristics of hospitals and certain characteristics of head trauma patients. The exploration reveals many available models that can be used to study “uncontrollable” (environmental) variables, and their impact on efficiency scores that are estimated through using data envelopment analysis (DEA), but these approaches provide limited information, as well as a failure of agreement to which is the best method to achieve this. Consequently, a new methodology in the DEA context is adapted from recent research in other areas and applied to the second stage in order to evaluate the impact of the environmental variables on the efficiency scores. This approach is referred to as Structural Equation Modelling (SEM), which allows the possibility not only to investigate the direct effect of various characteristics of both HTI hospitals and patients on the efficiency differences among hospitals, but also the indirect impact of these different characteristics of patients.
5
study concluded that future DEA studies that include extensive uncertainty analysis are needed in order to fill this gap in the literature. In the current study, the DEA analysis results are followed by an extensive uncertainty and robustness analysis, which includes a combination of the bootstrap DEA (Simar and Wilson, 1998, 2000, 2007), internal validity (sensitivity analysis) and external validity tests (Parkin and Hollingsworth, 1997), together with statistical testing such as Friedman's test. Conducting these extensive analyses and tests will add to the literature, which could assist in filling the gap that is associated with the limited application of uncertainty analysis methodology in the DEA literature.
The implementation of the above methodology, in order to meet the objectives of the current research, results in contributions to the literature of DEA in terms of theory and practice, which could be considered as the primary motivation for this study.
1.4 Data Source
The Trauma Audit Research Network (TARN) kindly agreed to provide access to relevant data for the current study, as TARN’s data had been utilised in different studies of health care that investigated specific trauma care trends and traits (Lecky, 2002). Moreover, neurosurgical care effects upon head injury outcomes (Patel et al., 2005) were investigated, outcome prediction within trauma (Bouamra et al., 2006), the costs of acute treatment for brain trauma (Morris et al., 2008) as well as mortality comparisons between Australia and the UK that followed hospitalisation (Gabbe et al., 2011). To the best of the researcher’s knowledge, this is the first study to use a TARN dataset to investigate the possibility of reducing the costs of head trauma care while still maintaining efficiency.
6 1.5 Study Outline
This thesis includes seven chapters altogether as presented in Figure 1.1.
7
methodological tools that will be implemented in the current study, as well as the rationale for conducting it.
In-depth, Chapter Two provides an overview of the approaches that have been taken in performance measurement and presents the efficiency measurement concepts as a foundation for the approach that is applied in the current study. A full methodological overview is provided in respect of the utilised form of efficiency measurements, which also documents a brief summary of various relevant methods of analysis, as well as an extensive review of previous empirical DEA studies in healthcare that are illustrated. The aim of the overview of techniques in efficiency measurement is to identify the most feasible and consistent approach in order to estimate efficiency of HTI care in the present research.
Chapter Three begins with the selection of research methodology. More precisely, the previous research and analysis indicate that the DEA approach should be employed in the empirical analyses of the current study. Therefore, full details of the DEA approach is presented in this chapter. Following this approach, bootstrapping DEA methodology and the DEA-based Malmquist index are discussed in order to be utilised for measuring efficiency and productivity of HTI hospitals. Furthermore, the data sources, including the choice of the relevant inputs and outputs for the empirical analysis of HTI hospital efficiency, are also described.
Chapter Four includes a background and literature review of missing data in DEA and multiple imputations through the use of the chained equations (MICE) approach as the proposed methodology for dealing with missing data in this research. A designed experiment to demonstrate this proposed method by using the actual data with artificially induced absent data is also presented. This designed experiment investigates the effects upon the DEA efficiency scores that are associated with different rates of absence.
Chapter Five introduces current methods to deal with the environmental factors in DEA and proposes a new method called structural equation modelling (SEM) to deal with such factors and provides a real example to highlight the advantage of the proposed method.
8
performance in particular years. In order to ascertain a further comprehensive view of how hospital efficiency changes over time, extended investigation of the change in productivity of the hospitals over the period 2009-2012 is undertaken using the DEA-based Malmquist index. Finally, the proposed SEM approach is applied to this specific chapter as a second stage post-DEA in order to investigate the effects of some environmental factors on the DEA efficiency scores.
9
CHAPTER TWO: APPROACHES FOR MEASURING EFFICIENCY IN
HOSPITALS
2.1 Introduction
The aim of this chapter is to review development theory, and to evaluate efficiency measurement techniques and hospital efficiency, which will also incorporate empirical literature, as the focus of the current research is to measure HTI care and its overall efficiency in order to reduce accumulated expenditure. Invariantly, a clear comprehension of the main components of performance measurement is needed and these are analysed in a general sense, with particular focus on efficiency measurements. Subsequently, it becomes feasible to apply assessment techniques for determining efficiency performance. Moreover, this chapter conveys an intricate summary and evaluation of the accumulated empirical literature regarding the efficiency of hospitals. Indeed, the principal intended insight of the present review is to analyse hospital efficiency, which is indelibly conducive to the set objective of the current research study, as the review focuses purely on hospital studies, with no reference to any separate health facility or research sector. Furthermore, the hospital production models are presented and evaluated, as they provide an important form of measurement for the efficiency of hospitals. Thus, an applicable guide process for the additional chapters will be implemented to comprehend the use of appropriate methods and variables, which will be devised from an extensive methodology review, empirical studies, and production models.
10
analysis. In Section 8, the differences of efficiencies among hospitals are explained. Finally, a conclusion of the whole chapter is provided.
2.2 What is Performance Measurement?
Performance measurement is a structured process through which an organisation identifies, measures, and monitors important programs, systems, and processes. Hospitals could be commercial organisations, and other than the social impact they have, hospitals are expected to use their resources in an efficient manner, and show profits. The profits help the hospital to invest in infrastructure and equipment, and to hire resources (Cameron, 2010).
The term performance measurement is associated with the manufacturing industry, and it was identified by financial measures such as liquidity, leverage ratios and net profit. Commercial organisations are cost driven, and an organisation’s performance is a function of its efficiency and productivity. These are measured as the ratio of costs of inputs required to the cost of the product (Shaw, 2003). However, these measures have been criticised for various reasons, even though they have also provided a slightly greater understanding of performance in operations. For instance, internal comparisons of costs and revenues have been emphasised by financial measures, although they have failed to demonstrate different factors of importance that can result in positive organisations (Otley, 2002). Additionally, when financial measures are the only utilised form in measuring performance measurement, it may be implied that cost reduction is the only focus from organisations, as well as profit margins and decision-making in the short-term, while ignoring a variety of environmental factors (both internal and external) that could be imperative to achievement in the long-term (Bourne
et al., 2003).
Therefore, different definitions of the performance measurement for organisations are provided and several financial and non-financial measures are available to identify this organisational performance (Thor et al., 2007).
11
patients, but may still be inefficient, as far as consuming resources and giving the desired output are considered. The term 'efficiency' therefore is complex, and subject to qualitative and quantitative interpretations.
Hofer (1983) argues that performance measurement is important since it forms an important component of the management decision-making process. Before taking up strategic planning, an organisation must first evaluate the performance. Results of the evaluation act as the basis for further management decisions. If the results are not satisfactory, then the problem areas can be identified and mitigation actions taken (Avkiran, 2002). However, measurement of organisational performance is not easy and straightforward, as mentioned previously. The problem becomes complex when the performance of non-cost centre departments, such as human resources, maintenance, design and others, must be measured.
Elbashir et al. (2008) agree with these arguments and indicate that organisational performance and organisation processes are related. A firm with low performance usually has inefficient processes. Several points emerge from these arguments, and they have a bearing on measuring the efficiency of the firm. Performance is not explicitly defined, and definitions among researchers differ, based on their objectives (Lebas and Euske, 2002). Performance is multi-dimensional measures with several variables, forming interdependencies. In addition, performance parameters vary among industries, and even among healthcare organisations. The standard financial measures of performance such as profits, leverage ratios, margins, debts, etc., are important. However, these financial ratios restrict themselves to only the financial performance, while ignoring other parameters (Bourne et al., 2005).
This section highlights the complexities of measuring organisational performance. The next section discusses the need to pursue this extensive and complex exercise in order to measure the performance.
2.3 Need to Measure Performance
12
the performance is measured, the organisation understands how good or bad the performance is with reference to internal and external benchmarks. It can then take up steps to consume resources efficiently, improve the quality, ensure higher customer satisfaction, and meet the strategic objectives (Henri, 2004).
Standard financial measures provide assessments of the performance from the cost and financial aspects of the firm. Adopting such performance measures helps firms to look beyond internal cost comparisons and towards other factors. These include utilisation of resources, productivity in terms of availability and time used, waiting time, customer satisfaction, etc. By moving away from financial measures, the firm focuses on internal and external forces that have a long-term impact (Bourne et al., 2005). Many other functions and assets are examined from a different perspective and insight, and they lead to uses that are more efficient.
Measuring performance within the healthcare service sector presents a number of challenges. Hospitals cater to a wide segment of patients, from the poor who require subsidised and free treatment to the rich who can afford premium treatment. Hospitals also operate with multiple business objectives, and deliver a much more diversified range of service offerings, while operating in uncertain political environments (Kutzin, 2013).
Van Peursem et al. (1995) indicate that the basic performance measurement for healthcare must be identified by economy, efficiency, and effectiveness. Economy measures the relationship between the costs or expenses incurred for procuring certain inputs, and the output obtained from them. It represents the number of quality inputs, and the costs needed to complete a healthcare activity. Efficiency is a measure of the ratio between the output and the resources used. It refers to the activities that can be monitored and controlled. Effectiveness specifies the degree to which the required objectives are met. Factors such as the quality and quantity of the results are also important.
13
included epidemiology, resource provision, resource quality, resource costs, process, and outcome.
In contrast, the World Health Organisation (WHO, 2003) provided another set of measures to define the performance of healthcare units. These include efficiency, equity, quality, responsiveness and sustainability. Creteur and Poschet (2002) carried out another study to measure the performance of hospitals. They used indicators such as human resources, efficiency, patient satisfaction, quality of care and financial outcomes. It is thus clear that the measures and indicators must be carefully selected, keeping in mind the strategic objectives of the hospital and the availability of data.
In our research, we decide to use efficiency as a measurement of HTI hospital performance,. The reasons for this choice of method are as follows. Measurement of productive efficiency helps to evaluate the activities controlled by the management. In addition, efficiency explains the manner in which resources are used and the outcome obtained, and this helps to improve organisational performance. These factors help to improve the technical efficiency, increase revenues by increasing productivity, and meet the organisations’ objectives (Smith and Mayston, 1987).
2.4 Concept of the Production Frontier and Efficiency
The concept of production frontier and efficiency was discussed and implemented practically in the work of (Farrell, 1957) for measuring efficiency based on the efficiency definition of (Koopmans, 1951) and (Debreu, 1951). The decision making unit (DMU) is efficient when it is impossible to improve any input or output without worsening some other input or output. In economics, the production process refers to the utilisation on certain inputs in order to generate a particular output. In a hospital setting, one example of an output could be the discharge of in-patients, with inputs such as technology, equipment, labour and number of beds. The production process could refer to the conversion of inputs into health care services with the ultimate goal to treat and discharge patients.
14
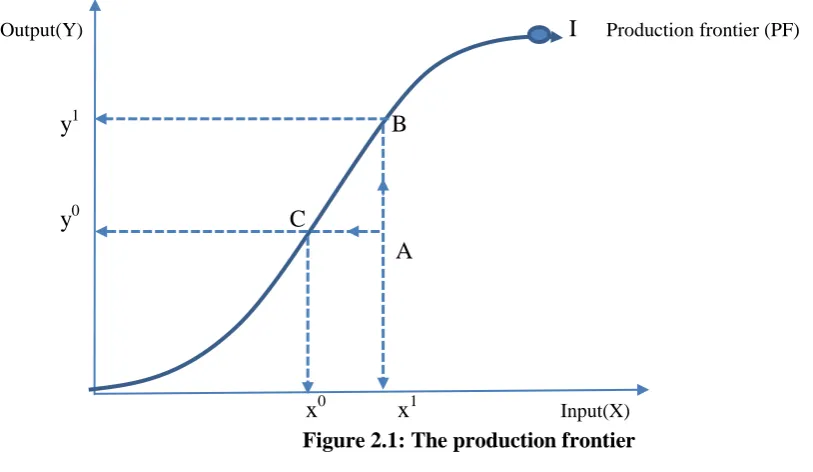
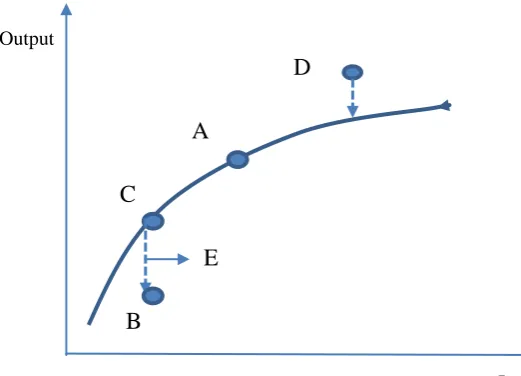
be represented by a curve, as shown in Figure 2.1. The production frontier is the combination of points corresponding to the maximum possible quantity of output that can be achieved at each particular input quantity (‘output-orientation’) and, alternatively, a particular output quantity may be achieved using the minimum possible quantity of input (‘input-orientation’). All of these points correspond to technically-efficient production (technical efficiency).
Therefore, the concept of technical efficiency could be approached using either the “input” or the “output” orientation, as described in this section. In Figure 2.1, technically-efficient points are positioned on the actual production frontier, such as points B and C. However, point A is technically-inefficient because there are ways to generate larger output (y1 > y0) with the same quantity of input (x1) or there are ways to produce the same output (y0) using a smaller quantity of input (x0 < x1). In other words, better capacity utilisation could improve efficiency by moving from point A to point B or point C.
Output(Y) I Production frontier (PF)
y1 B
y0 C A
[image:26.595.72.479.365.601.2]x0 x1 Input(X)
Figure 2.1: The production frontier
On the other hand, allocative efficiency refers to the combination of optimal proportions of inputs and outputs with a given set of prevailing prices. In other words, allocative efficiency aims at maximising the overall social benefit. In both the technical and the allocative
efficiency1, the identification of the ‘best-practice’production frontier (‘best frontier’) may
1
15
provide the benchmark against which each hospital can be compared in order to determine its efficiency levels. In practice, inputs and outputs for hospitals cannot be easily transformed into physical or monetary units. For this reason, many authors focused on the technical aspect of efficiency in an attempt to evaluate hospitals’relative performances (Tobin, 1958; Sahin and Ozcan, 2000; Xue and Harker, 1999). In this study, the focus will be on technical efficiency only.
2.5 The Measurement of Efficiency
16 X2/Y
D F E C
G E' H
B A
C'
[image:28.595.93.416.99.310.2]O X1/Y
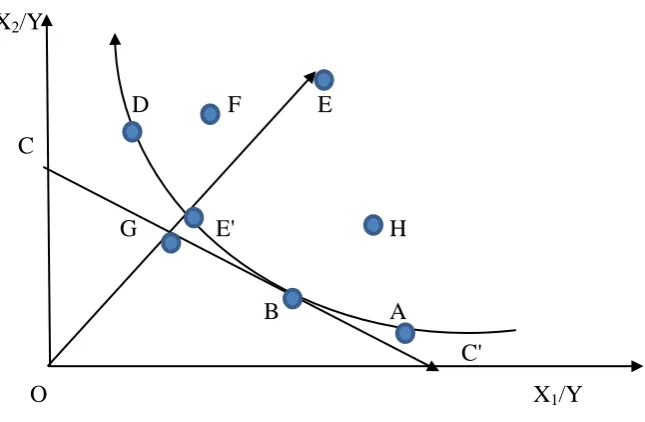
Figure 2.2: Farrell's efficiency measures
In Figure 2.2, the hospitals are assumed to have two variable inputs, X1 and X2. These are
used in different quantities to produce an output Y. The production frontier can be defined by means of the following expression (Hollingsworth et al., 1999):
Y = f(X1, X2)
In Figure 2.2, the points A-H are different hospitals that use different combinations of inputs to produce a given unit of patients for treatment. Assuming that the hospitals work with constant returns to scale, the hospital with the best practice frontier is represented by the curve passing through the points D, B, and A. These hospitals use the least amount of inputs to generate the required outputs. These hospitals are on the efficient frontier and they are technically efficient, since other hospitals cannot produce the same level of output with proportionally fewer inputs. The efficiencies of these hospitals are calculated as the ratios OD/ OD, OB/ OB, and OA/ OA respectively. The efficiencies of these hospitals are therefore all 1.
17
efficiency of hospital E is calculated as OE'/ OE, and this value lies in the finite interval (0,1]. The ratio defines
Technical Efficiency (TE) = OE'/ OE where 0 < TE≤ 1.
The allocative efficiency and economic efficiency can be measured when the prices of inputs and the output units are available. Referring to Figure 2.2, when the line defined by CC' indicates that the ratio of the prices between inputs is known, then the optimal input mix for the hospital to produce a unit of output is at B, which is the tangent point between CC' and the production frontier. In such a condition, the allocative efficiency of E is (Farrell, 1957):
Allocative Efficiency (AE) = OG/ OE' where 0 < AE ≤1.
The above equation signifies the possible percentage reduction in production related costs when hospital B is considered at the allocative point. Hospitals at points D and A are technically efficient. However, they are not allocatively efficient since they do not combine other inputs to lower their production costs. The economic efficiency is made up of allocative and technical efficiency, and a hospital is economically efficient when both these components are efficient. The economic efficiency is therefore defined as follows:
Economic Efficiency (EE) = OG/ OE where 0 <EE ≤1.
In other words,
Economic Efficiency = [Technical Efficiency] x [Allocative Efficiency] or
OG/ OE = OE'/ OE x OG/ OE'
The ratio GE/ OE signifies the production cost reduction that is possible when the hospital shifts from E to G, which is the effect of minimising cost.
18
produced. The output orientation method can also be used, where the two components of the economic efficiency are obtained by increasing the outputs produced from the inputs.
All concepts discussed in this section are developed in order to form the parametric and non-parametric approaches for measurement of efficiency.
2.6 Methods of Efficiency Measurement
It is necessary to stipulate the main approaches for efficiency evaluation as they present the foundation for the methodological framework, which is implemented in our further analytical empirical research. The origins of the term “efficiency”, as a definition and measurement, stem from the research by Koopmans (1951), Debreu (1951) and Shepherd (1953). In particular, originally within the first definition, DMU was distinguished as becoming efficient through the impossibility of producing additional output without creating a reduction of another output (Koopmans, 1951). Subsequently, distance functions in an output-expanding direction were implemented as a form for multiple-output technology modelling, and increasingly as a manner of radial distance measurements of a DMU from a frontier (Debreu, 1951). Additionally, this form of multiple technology modelling was introduced into an input-conserving direction (Shepherd, 1953). Nevertheless, the overall functionality in production had never been realised, which is precisely why observed data through the use of a nonparametric or a parametric function were suggested for estimation (Farrell, 1957). Consequently, as a development from these two approaches, contrasting models were devised. In fact, the selection between the models depends on the predefined purpose for measuring the efficiency within an investigation, as well as on data availability in various instances.
19
determine the underlying concepts and assumptions, together with the strengths and weaknesses, instead of the methodology’s technical details.
2.6.1 Ratio Analysis
Ratio analysis is the simplest approach for measuring the technical efficiency using different indicators as ratios. Common indicators include bed occupancy rate, turnover ratio, turnover interval and average length of stay in hospital (Zere et al., 2006). Efficiency is captured through the effective utilisation of a particular input, and for this reason commonly-used ratios involve a single output and a single input as the nominator and the denominator, respectively. In order to estimate the overall efficiency for a hospital, a number of ratios should be calculated simultaneously.
However, partial indicators of efficiency may provide misleading results (Sherman, 1984; Thanassoulis et al., 1996; Nyhan and Martin, 1999). For example, the bed occupancy rate provides information about the required occupancy of beds every year compared to the availability of beds. This is an indicator of efficiency because too many available beds would indicate a waste of resources, whereas too few available beds would indicate dysfunctionality of some hospital departments. However, an optimum bed occupancy rate may not necessarily be an indicator of efficiency because there are no available data regarding the cost associated with each treated patient. For example, if a different ratio provided information about the average cost per treated patient, and it was found to have increased, the bed occupancy rate would not be very informative in terms of the overall hospital efficiency, Ehreth (1994).
2.6.2 Regression Analysis
Regression analysis involves the exploration of a relationship between a dependent variable (output) and certain independent variables (inputs). This relationship is usually represented by a fixed structural form (function), whose estimation in our context aims at identifying the efficiency.
20
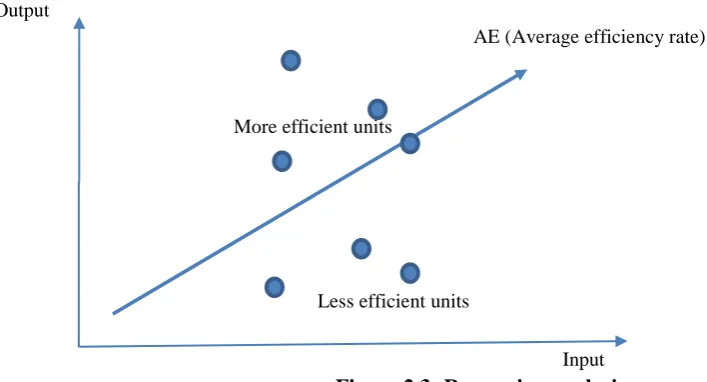
Figure 2.3 shows the simple ‘one-input and one-output’linear regression case. The estimated dependent variable (“output”) essentially provides the expected average quantity of output for each quantity of input used by the DMU, and this is represented by the drawn line segment, which shows the “fitted”values of the regression estimation.
The linear estimated production function could be perceived as the indicator of average technical efficiency2 for every input utilised (average efficiency rate). Therefore, any divergence from the fitted line would correspond to divergence from average efficiency levels, corresponding to a source of inefficiency. Stated differently, the smaller the impact of unobservable factors (random errors), the better the regression estimation and therefore, the more efficient a particular DMU is expected to be.
Output
AE (Average efficiency rate)
More efficient units
Less efficient units
Input
Figure 2.3: Regression analysis
The major advantage of regression analysis is the method’s capability to accommodate multiple independent variables as inputs for a particular output. This is not possible with ratio analysis. However, although regression analysis may involve multiple inputs, it cannot include more than one output in a single investigation. A series of investigations, run simultaneously, could provide information for each different output. Nevertheless, this is a potential disadvantage of the method given that there is no widely-acceptable way for interpreting performance of multiple-source random errors. Multivariate generalisations of
2
21
regression analysis exist, though these models introduce more parameters to represent correlations among the dependent variables, with a corresponding reduction in power and precision. Furthermore, unlike ratio analysis, regression analysis requires a very specific production function associating an output with different inputs. In practice, this is not usually feasible given the extensive nature of the hospital services provided and the large number of inputs and outputs involved in the measurement process.
Nonetheless, the most important drawback of regression analysis in measuring efficiency is the mere fact that the method calculates efficiency in average terms. Although a comparative static analysis of efficiency indicators across different hospitals may be informative, there is no qualitative information available about the particular source of inefficiency in each hospital.
2.6.3 Frontier Analysis
The general method of frontier analysis offers two main approaches for measuring efficiency, based upon nonparametric and parametric frontiers. These approaches were first suggested by Farrell (1957) as practice techniques for measuring efficiency. This measurement approach included the technical efficiency and the allocative efficiency, which were then combined to provide a measure of total economic efficiency. Both of those efficiencies were estimated from the relevant production frontier—the “best frontier”—by using observed data.
2.6.3.1 Parametric Frontier Analysis
22 a. The Deterministic Parametric Frontier
The deterministic parametric frontier approaches the production function as a deterministic relationship between the output and the inputs (Cazals et al., 2008). For this reason, it is essential that a very specific structural form of a production function is defined. The inputs represent independent variables which attempt to explain the variations of the dependent variables, that is the output. The deviation from the frontier (residual) is considered to be the actual technical inefficiency of the DMU. Therefore, the production function is assumed to be fully deterministic in terms of technical efficiency; Smith and Street (2005). There are two techniques for estimating the parameters of inefficiency, the mathematical programming method, first developed by Aigner and Chu (1968), and regression analysis. The second method includes corrected ordinary least squares (COLS) and modified ordinary least squares (MOLS), and are considered by some authors to be conventional methodology (Cazals et al., 2008).
The major advantage of the deterministic parametric frontier method is the fact that there is no need to define the distributional properties of inefficiency. The disadvantage of the method is the assumption that any random errors could be attributed to technical inefficiency without the possibility of accommodating measurement errors and random shocks associated with unobservable or externally-defined variables. Figure 2.4 presents an example of a deterministic parametric frontier. Both of the units (A and C) are technically inefficient as they lie on the production frontier.
23
Output
A C
B
Input Figure 2.4: The deterministic production frontier
b. Stochastic Frontier Analysis (SFA)
The stochastic frontier model was proposed by Aigner et al. (1977) and Meeusen and van den Broeck (1977). The idea of this approach is essentially to expand the deterministic frontier by broadening the component elements included in the random error of the production function. In other words, the units that deviate from the frontier may not be totally under control. Therefore, these two studies suggest that we should add a further random error to the non-negative random variable, to model this inefficiency.
As a result, the main advantage of this method is its capacity to treat separately the component of technical inefficiency and any random shocks or measurement errors, which might have influenced the dependent variables, that is the production output.
24
These are restrictive assumptions, and may present a major challenge to the effectiveness of this method. For example, if the technological function is mis-specified, the ability of the method to separate the effects of technical inefficiency and the effects of the remaining random errors will be eliminated.
Figure 2.5 illustrates the stochastic production frontier case using a simple production function. Point D represents a technically-efficient DMU with a positive stochastic part. This means that the random errors include no inefficiency but rather positive external shocks contribute to higher output. On the other hand, point B represents an under-performing case, which corresponds to a DMU that operates at a technically-inefficient point. Unlike the deterministic approach, line segment BC can now be separated into BE and EC, corresponding to the technical inefficiency and the remaining random errors, respectively.
Output
D
A
C
E
B
Input Figure 2.5: The stochastic production frontier
2.6.3.2 Non-parametric Frontier Analysis
[image:36.595.84.345.353.541.2]25 a. Non-parametric Deterministic Frontier
The non-parametric deterministic methods do not require a specified functional form. There are two representative non-parametric deterministic methods, which are briefly discussed next: data envelopment analysis and free disposal hull analysis.
a.1 Data Envelopment Analysis (DEA)
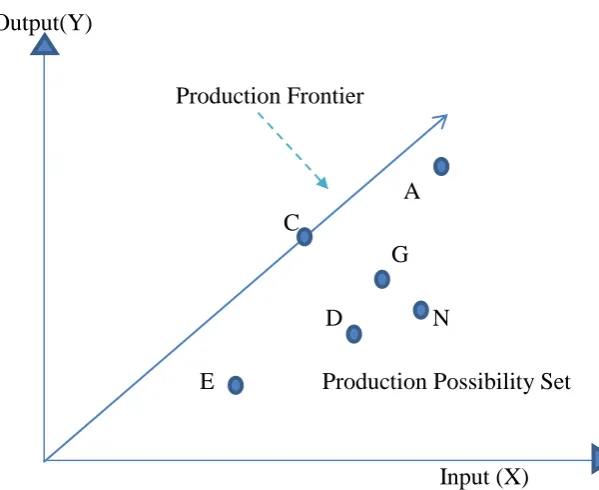
DEA is a non-parametric linear programming method for estimating efficiency and capacity utilisation, effectively identifying the production frontier. The method was first introduced by Charnes et al. (1978) as a measure of efficiency for ‘not-for-profit’ entities participating in public programmes in the United States.
DEA is based on the principle that the performance of each DMU must be compared relative to the ‘best-practice’ frontier, that is a benchmark continuum of highly-efficient, virtual DMUs. The ‘best-practice’ virtual frontier is essentially the convex combination of all efficient points of operation. In this method any deviation from the ‘best-practice’ frontier must be an indication of technical inefficiency. This research uses the DEA method for measuring the efficiency of HTI care in England and Wales and is described in considerably more detail in the next chapter.
a.2 Free Disposal Hull (FDH)
The FDH method relaxes the convexity assumption and, for this reason, it may be considered a more general case of the main DEA modelling approach. It was first introduced by Deprins
et al. (1984).
26
Although the method may be better in terms of approaching the real operational behaviour of a hospital, it may not provide accurate estimates of its efficiency score because the lack of input-substitutability prevents the producer from achieving all of the optimum production points possible.
B A X2/Y
A B
X1/Y
Figure 2.6: The FDH approach to efficiency
In Figure 2.6, the perfect complementarity characterising inputs X1 and X2 corresponds to the
set of points that are shown by the staircase curve AA. The AA curve is essentially the isoquant (indifference curve) representing the fixed (equal) maximum output that can be achieved with different combinations of inputs. As we will see in Chapter 3, the production frontier associated with the main DEA method would generate a convex linear combination of points for different ranges of input quantities. Therefore, one would reasonably expect that the DEA curve would ‘envelop’the FDH curve, as demonstrated in Figure 2.6 by the BB and AA curves respectively.
b. Non-parametric Stochastic Frontier (Stochastic DEA)
As described previously, DEA modelling does not take into account the inherent random errors, due to the fact that its structure is created based only on observed data.
27
empirically the true distribution of the output using resampling methods such as bootstrapping. In other words, this is a simulation process that draws observations out of the set, while allowing repeated draws of the same observations. The bootstrapping procedure could generate many ‘pseudo-samples’ from the original set of observations, and for this reason the approximation of the underlying distribution is expected to be fairly accurate. This could allow the calculation of the production frontier and efficiency scores without the need to derive a specific structural form for the production function. Statistical inference may also follow based on the derived distribution. In this thesis, bootstrap DEA is used and more technical details are provided in the next chapter.
2.7 Empirical Studies on Measuring Efficiency in Health Care
There is a vast amount of literature about the empirical measurement of technical efficiency in different health care sectors, such as primary and secondary care (Hollingsworth, 2003), and in different departments of hospitals (Chilingerian and Sherman, 2004) or different groups of professionals (Hollingsworth et al., 1999).
Hollingsworth et al. (1999) reviewed 91 studies involving DEA modelling for measuring technical efficiency in healthcare. The authors found that most of the studies were focused on measuring hospital efficiency, particularly in the United States. The most important observation was that DEA modelling was found to be more successful and more accurate in measuring overall hospital efficiency, rather than the efficiencies associated with certain departments or groups of medical professionals. For example, it was easier for the DEA linear programmer to calculate the technical efficiency of a hospital as a whole, given certain organisational and managerial restrictions, but it was much more challenging to identify differences in efficiency levels among hospital departments.
28
predominant method used for measuring technical efficiency in the health care sectors. Nonetheless, these comprehensive reviews demonstrated that the availability of systematic data sets may also be a factor explaining why hospitals were found to be more appropriate than other health care institutions in terms of applying alternative methods for measuring technical efficiency.
Along the same lines, Worthington (2004) identified 38 studies which used the frontier analysis for measuring technical efficiency. As noted earlier, the two main methods of frontier analysis are DEA and SFA, and this author noted that DEA is the more frequently-used methodology. In addition to this, the author reported that the most frequently-frequently-used inputs for measuring efficiency were the conventional ones, which are capital and labour. On the contrary, the output selection was much more variable due to the spectrum and different qualities of the health care services provided.
Hollingsworth (2008) offers a review, which is based on the measures of frontier efficiency from 317 independent studies. The principal technique that has been incorporated is through the analysis of non-parametric data envelopment analysis, although the utilisation of parametric techniques (i.e. stochastic frontier analysis) is increasing. Moreover, there has been a re-evaluation and summarisation of the process of application to organisations relating to health care and hospitals. In general, this study defines potential detrimental effects that may be enhanced from considering the conceptualisation of efficiency. Furthermore, this review establishes specific criteria in the assessment of efficient application and implementation, which will potentially assist researchers, together with individuals who are assessing whether to apply published findings to their investigations.
29
it is still a perpetually developing methodology. However, the improvement of the efficiency of PC organisations by policy makers and managers is supported by continual evaluations. Nevertheless, enhanced research remains a requirement to address certain areas of ambiguity in this particular field of investigation. For instance, the standardisation of methodologies and the development of outcome research in PC require improvement and clarification. Likewise, it is conclusive that additional research will have to be structured from beneficial evidence-based rationales and incorporate substantial uncertainty analyses. The researchers hav proposed to different academics and scholars that various considerations should be analysed in order to understand the process of decision making in PC from the utility of efficiency measurement.
Most of the literature reviews conducted for the measurement of efficiency in health care found that there is a lot to be learned from empirical studies, particularly regarding the interpretation of outcomes derived from frontier analysis. These studies exploring the technical efficiency in health care used their findings to inform policy decisions, such as to identify ways of achieving resource savings and possible improvement of efficiency scores. For example, Faze et al. (1989) evaluated the plant capacity of hospitals by applying non-parametric DEA modelling and using ‘number of beds’as the proxy for capacity. The authors found that there were no major differences between rural and urban hospitals, in terms of ‘capacity utilisation’ and ‘cost efficiency’. However, they did find that urban hospitals employed more doctors and other medical staff than rural hospitals.
A study by Ozcan et al. (1996) considered the efficiency levels of psychiatric hospitals as a separate group and compared those with hospitals of acute care for the time period 1986-1990. The study included ‘not-for-profit’and ‘for-profit’hospitals. The psychiatric hospitals appeared to be less efficient than acute care hospitals, while there were no statistically significant differences between the ‘not-for-profit’and ‘for-profit’groups of hospitals.
30
Several smaller studies used non-parametric DEA modelling in order to assess the technical efficiency of general hospitals, such as those by Ersoy et al. (1997) on Turkish general hospitals, Giokas (2001) on Greek general hospitals, and Al-Shammari (1999) and Sarkis and Talluri (2002) on Jordan general hospitals. All these studies indicated that there was a significant improvement of efficiency levels over the years. The studies identified similar factors, which might have contributed to this improvement, such as better organisation of resources and better resource utilisation. It is interesting that the ‘bed occupancy rate’ was found to be inversely associated with the operating hospital cost (Giokas, 2001). This demonstrated the complexity in terms of identifying the most important factors influencing technical efficiency.
A few studies which applied DEA modelling in order to measure efficiency in African hospitals found some similar results (Kirigia et al., 2002, Osei et al., 2005, and Zere et al. 2006), as follows: i. public hospitals were found, on average, to be more efficient than private hospitals; ii. efficiency scores could be improved if the numbers of medical officers and technical staff decreased and the numbers of maternal and child care visits, deliveries and discharges increased; iii. several small-sized hospitals appeared to be more efficient than their capacity had allowed them due to “scale effects”, that is increasing returns to scale might have reduced the magnitude of efficiency loss. For this reason, it was suggested that merging small hospitals in specific geographic areas could significantly improve the overall actual technical efficiency in secondary care.
31
inpatient discharges, outpatient visits and surgical operations that were investigated. The findings indicate that average technical efficiency gains took place because of the significantly improved scale efficiencies, as the average pure technical efficiency slightly improved.
O’Neill et al. (2008) carried out a longitudinal study of 70 research studies published in 12 countries. The findings indicate that in Europe, the focus is more on finding the allocative rather than the technical efficiency. Vitikainen et al. (2009) examined the robustness of efficiency results due to output and case mix measures. The findings indicate that episode measures are generally to be preferred to activity measures. Sahin et al. (2011) examined the efficiency of the Ministry of Health’s 352 general public hospitals during 2005-2008. The results indicate that operational performances of these hospitals have a common tendency that the performance of 2005–2007 progressed over the previous year, while that of 2008 has regressed as compared to 2007. Hu et al. (2012) investigated regional hospital efficiencies in China during 2002–2008 to identify the impact of new policies. The findings indicate that the hospital efficiency is moderately increased slightly, and that a higher proportion of for-profit hospitals and high quality hospitals is helpful to enhance technical efficiency.
Alonso et al. (2015) used the DEA method with bootstrap to analyse and compare efficiency scores in traditionally managed hospitals and those operating with new management formulae. The study indicates that the skills and involvement of the management is a major factor. Mohammadi and Iranban (2015) used DEA to study the hospital efficiency in Iran. Inputs for the study included the costs of materials and service variables, as input indices and the safety standards in the archive, the number of new incoming certificates of the quality, and patient satisfaction were considered as output indices. Wang et al. (2015) used the DEA method to study the efficiency of 18 hospitals in Shanghai for 2008-2013. The study helped to assess the areas of inefficiency and methods to improve the efficiency.
2.7.1 Identifying a Hospital Production Model (Inputs and Outputs)
32
On one hand, hospital inputs can be categorised into recurrent inputs and capital inputs. For example, members of staff and operating expenses are considered to be recurrent, whereas bed capacity and service complexity are considered to be capital inputs (Hollingsworth and Parkin, 1995; Sahin and Ozcan, 2000; Parkin and Hollingsworth, 1997). Table 2.1 summarises the set of inputs used in hospital efficiency studies stated in this section.
Variable used as hospital input
Medical staff Number of beds Operational expenses Total costs
Service complexity
Table 2.1: Examples of hospital inputs