International Journal of Emerging Technology and Advanced Engineering
Website: www.ijetae.com (ISSN 2250-2459,ISO 9001:2008 Certified Journal, Volume 6, Issue 3, March 2016)
100
Effect Of Earth Resistance on Performance of Protective
Relay During Power Swing in IEEE 9 Bus System
Padmini Sharma
1, Dr. R.N. Patel
21Department of Electrical and Electronics CSIT, Durg, India
2
Department of Electrical and Electronics SSCET, Bhilai, India
Abstract—A large disturbance in the power system is the
cause of power swing and due to which mal-operation of distance relay occurs in power system network. This is highly undesirable and if it is not prevented, unnecessary tripping take place and finally blackouts may occur .This paper presents the effect of earth resistance in relay operation in case of power swing. Different cases presented here which show the effect of power swing on relay operation for different magnitude of power swing when different earth resistance is considered in each case. IEEE multi machine nine bus systems is chosen here for simulation purpose and it is done in PSCAD software.
Keywords— power swing, Distance relay, mal-operation,
PSCAD.
I. INTRODUCTION
Transmission line are very important part of dynamic power grid ,used for connecting generator to load .Distance protection relay one of the most common or we can say most widely used relay for protection of transmission and distribution line. Stability is the very important parameter of a power system. Relay performance and power system stability both are related to each other. For maintaining system stability, protective scheme should operate as soon as possible. Power system stability of recent power grid is disturbed in case of power swing. Relay mal-operation due to power swing is the major cause of wild area cascading failure and finally blackout. Opening of healthy line due to power swing is highly undesirable. Whatever be the reason behind the blackout, if it occurs ,take much time to again restart the system .Huge economical loss occur due to this ,so it has to avoided form the system for maintain the continuity of supply and take desired action at the right time[1]. Hence it is desire for new generation protection system; it must identify different condition before operation whether it is ideal condition, fault condition or high amplitude power swing condition.
Power swing basically defines as the ―wide variation of power between two areas of power system‖. It may occur in the power system due to unpredicted event or may be due to large disturbance. This disturbance present due to any of the following reason given below.
1)Sudden fault
2)Line switching
3)Generation disconnection
4)Addition of load
5)Loss of load
6)Paralleling other generator
All above mention situation create disturbance in the system equilibrium condition. It affects the constant power flow from generation end to load end and create wild fluctuation in electrical power, however the mechanical power relatively, and constant. Unbalance between electrical and mechanical power cause oscillation in load angle which create sudden variation in voltage, current, active power P and reactive power Q at relay location and produce power swing [2-3]. Depending upon the type and the disturbance occurrence time, power swing may be stable or may be unstable. It may be possible the power swing stable or unstable, but if its amplitude is high it affect the relay performance at different location and unwanted tripping disturb the continuity of supply which further convert into cascading outages and power blackout[4].
Generally the system blackout is the result of mal-operation of relay. With the help of present paper we can see the relay performance in different condition. Relay operation in fault condition at relay location as well as the relay performance when the disturbance occurs in any other part of power system network.
In this paper general feature of IEEE multi machine nine bus systems is discussed in section II. Then section III discussed the simulation model of IEEE nine bus systems in PSCAD. In section IV discuss the different cases and examine the relay response in various condition. Conclusion of presented paper is discussed in section V.
II. NINE BUS SYSTEM
International Journal of Emerging Technology and Advanced Engineering
Website: www.ijetae.com (ISSN 2250-2459,ISO 9001:2008 Certified Journal, Volume 6, Issue 3, March 2016)
101
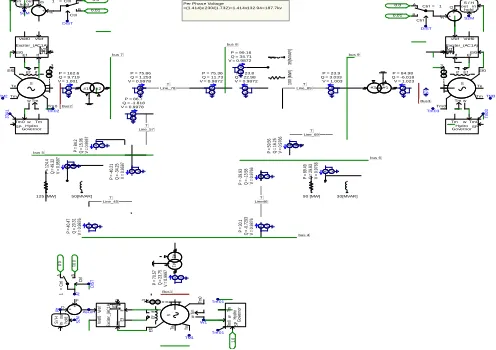
Three generator units connected to bus number 1, 2 and 3 respectively through step-up transformer at 230KV in nine bus systems. Generating voltage of first generate is 16.5KV at 247.5 MW, generating voltage of second generate is 18 KV at 163.2MW and generating voltage of third generate is 13.8 KV at 108.8MW. Three large R-L-C loads load A, load B and load C connected to bus number 5, 6, and 8 respectively. Load connected from A is 134.629MVA; Rating of load B is94.868 MVA and load C rating is 105.948 MVA. The three step-up star/delta connected transformer with proper data connected between buses 1-4, 2-7 and 3-9.
Fig. (1) Single line diagram of IEEE 9 bus system
III. SIMULATION MODEL OF TEST SYSTEM
The IEEE 9 bus test system is simulated in PSCAD/EMPT with mostly data taken from power system control and stability by Anderson and Found and rest are assumed .For modeling the transmission line Bergeron model is used for entering the positive sequence line resistance and reactance. The one line diagram (OLD) of the simulated test system in PSCAD is shown in fig1 [6-7]. The data of generator and line parameter are given in appendix. Load A is connected to bus number 5, load B is connected to bus number 6 and load C is connected to bus number 8. The total generation of 9 bus system is ideally consider about 519.6 MW and the total connected load is 315 MW.G1 is connected to bus number1,G2 is connected to bus number 2 and G3 is connected to bus number 3. Six transmission lines connecting the bus bars of test system and through step up transformer generator is connected to transmission line at 230 KV.
Simulation model is run for various conditions and examine the relay performance for various condition.
1)Normal and healthy
2)When single line to ground fault created in the
transmission line near to bus number4.
3)Three phase fault is created in bus number 5 and
examine the performance of relay due to power swing.
4)Single phase line to ground fault created in bus
number 5and observed the relay response which is connected between buses 4-6.
5)Single phase line to ground fault again created in bus
number 5, when increases the magnitude to ground
resistance. S Te 3 A V Tm Tm 0 Ef0 Tm w EfIf VT IT3 If Ef Ef0 Vref Exciter_(AC1A) Vref0 S / H in
holdout D
+ F + A B Ctrl Ctrl = 1 0.0 0.01 S2M DIST TM2 Tm 02 Hydro Governor Tm w Tm 0 SP Tm0 2 #1#2 P = 162.6 Q = 9.719 V = 1.001 V
A Line_78
T P = 75.86 Q = 1.253 V = 0.9978 V A
P = 75.36 Q = 11.73 V = 0.9872 V A
35
[MVAR
]
P = 99.16 Q = 34.71 V = 0.9872 V A 10 0 [MW ] Line_89 T P = 23.8 Q = 22.98 V = 0.9872 V A
P = 23.9 Q = 3.033 V = 1.003 V
A #2 #1
P = 84.98 Q = -6.018 V = 1.023 V A S Te 3 A V Tm Tm 0 Ef0 Tm w Ef If VT IT 3
If EfEf0 Vref Exciter_(AC1A) Vref0 D + F +
S / H in hold out S2M A B Ctrl
Ctrl =1 DIST 0.0 0.01 TM3 Hydro Governor Tmw Tm 0
SP Tm 03 Tm 03 Line_69 T P = 59 .5 6 Q = 16 .2 5 V = 0. 97 66 V A 90 [MW] P = 89 .4 9 Q = 29 .8 3 V = 0. 97 66 V A 30[MVAR] Line46 T P = -2 9. 93 Q = -1 3. 58 V = 0. 97 66 V A P = 30 .1 Q = -0 .7 29 3 V = 0. 98 76 V A #1 #2 P = 70 .5 7 Q = 23 .7 5 V = 0. 99 97 V A S Te
3 AV
Tm Tm 0 Ef 0 Tm w Ef If VTIT 3 If Ef Ef 0 Vre f Exci te r_ (AC 1A) Vre f0 Tm 01 H yd ro G ove rn or Tm w Tm0SP W1 Tm 01 1. 0 D+ F + As um S / H inhold out Ad S2 M Af A B C trl C trl = 1 TM1 D IST 0.01 0.0 Line_45 T P = 40 .4 7 Q = 20 .3 1 V = 0. 98 76 V A 125 [MW] P = -4 0. 21 Q = -3 4. 25 V = 0. 95 97 V A P = 12 4. 4 Q = 49 .3 2 V = 0. 95 97 V A 50[MVAR] Line_57 T P = 84 .2 Q = 15 .0 6 V = 0. 95 97 V A
P = 86.7 Q = -1.818 V = 0.9978 V A bus 9 bus 8 bus 6 bus 4 bus 5 bus 7 Ea Per Phas e Voltage
=(1.414)x 230/(1.732)=1.414x132.94=187.7kv
Bus1 Bus2
Bus3
Fig. (2) Simulation model of multi-machine nine bus system in PSCAD.
IV. SIMULATION RESULT FOR DIFFERENT CASES
CASE-I
[image:2.612.59.278.284.480.2] [image:2.612.325.573.308.483.2]International Journal of Emerging Technology and Advanced Engineering
Website: www.ijetae.com (ISSN 2250-2459,ISO 9001:2008 Certified Journal, Volume 6, Issue 3, March 2016)
102
Main : Graphs
Time S 5.000 5.010 5.020 5.030 5.040 5.050 ...
... ... -200
-150 -100 -50 0 50 100 150 200
V
o
lt
a
g
e
(
kv
)
Voltage bus4 w ith PSS
Fig. (3) Voltage variation under normal condition in bus number4
Main : Graphs
Time S 0 10 20 30 40 50 ...
... ... -10
0 10 20 30 40 50 60 70 80
P
o
w
e
r
(M
W
)
Pow er G1 w ith PSS
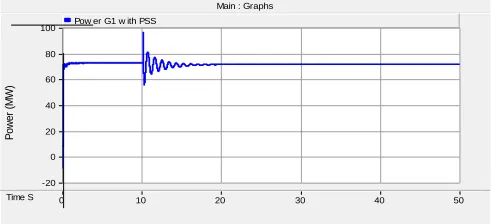
Fig. (4) Active power generation from generator 1
Main : Graphs
Time S 0 10 20 30 40 50 ...
... ... -70
-60 -50 -40 -30 -20 -10 0 10 20 30
R
e
a
c
ti
v
e
P
o
w
e
r
(M
v
a
r)
Reactive Pow er G1 w ith PSS
Fig (5) Reactive power generation from generator 2
Main : Graphs
Time S 0 10 20 30 40 50 ...
... ... -2.00
-1.50 -1.00 -0.50 0.00 0.50 1.00 1.50 2.00
T
ri
p
S
ig
n
a
l
TripSignal
Fig- (6) Relay response during healthy condition
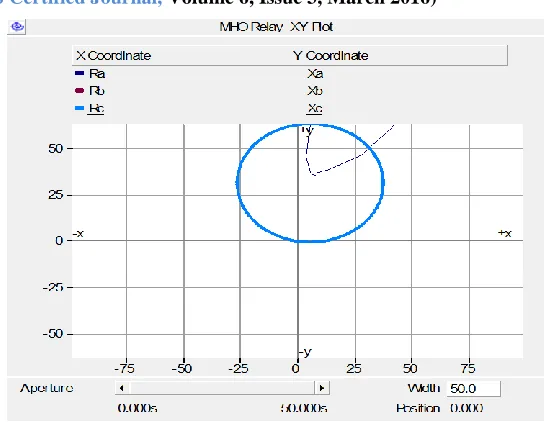
Fig.(7) Mho relay characteristic in X-Y plane
Fig (3), (4) and (5) shows the voltage ,active power and reactive power in bus number 4 in case of no fault between bus 4-6 . Fig (6) show the trip signal response is zero in healthy condition and fig (7) gives the information about the transmission line impedance which is high during normal condition and not enters in the X-Y plane of mho relay characteristic.
CASE-II
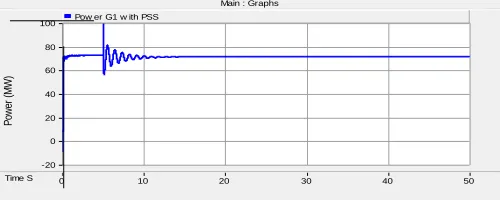
When single phase to ground fault occurs in phase A of transmission line between bus 4-5.Fault occurs at 10.02 second for .05sec.Although the fault duration time is very less but it change the voltage, current, active and reactive .Since the magnitude of fault current increases suddenly that why impedance seen by the relay decreases and it come in the relay of mho relay characteristic. So trip signal is generated by relay at 10.02 sec and power flow is suddenly down zero through transmission line between bus4-5.Active power generation from G1 is varies from 72 MW to 100MW in first power swing observed from fig (8).
Main : Graphs
Time S 0 10 20 30 40 50 ...
... ... -20
0 20 40 60 80 100
P
o
w
e
r
(M
W
)
Pow er G1 w ith PSS
[image:3.612.323.584.121.246.2] [image:3.612.48.295.121.240.2] [image:3.612.47.302.273.443.2] [image:3.612.324.570.496.608.2] [image:3.612.49.304.591.692.2]International Journal of Emerging Technology and Advanced Engineering
Website: www.ijetae.com (ISSN 2250-2459,ISO 9001:2008 Certified Journal, Volume 6, Issue 3, March 2016)
103 Main : Graphs
Time S 10.180 10.190 10.200 10.210 10.220 10.230 10.240 10.250 ...
... ... -400
-300 -200 -100 0 100 200 300
V
o
lt
a
g
e
(
k
v
)
Voltage bus4 w ith PSS
Fig. (9) Voltage variation in bus number 4 when single phase fault occurs.
Main : Graphs
Time S 0 10 20 30 40 50 ...
... ... 0
10 20 30 40 50 60
A
c
ti
v
e
P
o
w
e
r
(M
W
)
Pow er flow in T46
Fig- (10) Power flow through transmission line in case of fault condition
Main : Graphs
Time S 0 10 20 30 40 50 ...
... ... -10
0 10 20 30 40 50 60
R
e
a
c
ti
v
e
P
o
w
e
(
M
v
a
r)
Reactive Pow er flow in T46
Fig-(11) Reactive power flow through transmission line in
faulty condition.
Fig. (12) Mho relay characteristic in fault condition.
Main : Graphs
Time S 0 10 20 30 40 50 ...
... ... -2.00
-1.50 -1.00 -0.50 0.00 0.50 1.00 1.50 2.00
T
ri
p
S
ig
n
a
l
TripSignal
Fig. (13) Unit step trip signal generation at 10.02 sec.
Fig. (8),(9) and fig(10) shows the active power, voltage at bus number 4 in fault condition. Fig (11) shows the active power transfer from bus 4 to 6, which is suddenly down to zero value at the time of fault. Transmission line impedance come in the region of mho relay characteristic and trip signal generate unit step response at 10.02 sec. After getting response from trip signal circuit breaker open and disconnect faulty part of the system from healthy part.
CASE-III
[image:4.612.50.296.120.307.2] [image:4.612.321.593.126.337.2] [image:4.612.48.299.347.489.2] [image:4.612.324.580.359.496.2] [image:4.612.48.301.520.674.2]International Journal of Emerging Technology and Advanced Engineering
Website: www.ijetae.com (ISSN 2250-2459,ISO 9001:2008 Certified Journal, Volume 6, Issue 3, March 2016)
104
Earth resistance considered here is zero that why although the fault takes place very away from relay location but it give response due to power swing.
Main : Graphs
Time S 4.940 4.960 4.980 5.000 5.020 5.040 5.060 5.080 5.100 5.120 ...
... ... -300
-200 -100 0 100 200 300
V
o
lt
a
g
e
(
k
v
)
Voltage bus4 w ith PSS
Fig. (14) Voltage variation in bus number 4 when fault occurs in bus number 5.
Main : Graphs
Time S 0 10 20 30 40 50 ...
... ... -20
0 20 40 60 80 100
P
o
w
e
r
(M
W
)
Pow er G1 w ith PSS
Fig. (15) Power swing at G1 when fault occurs in bus number 5.
Fig. (16) Mho relay phase impedance characteristic in case of fault condition.
Fig. (17) Mho relay line impedance characteristic in case of fault condition.
Main : Graphs
Time S 0 10 20 30 40 50 ...
... ... -2.00
-1.50 -1.00 -0.50 0.00 0.50 1.00 1.50 2.00
T
ri
p
S
ig
n
a
l
TripSignal
Fig. (18) Unit step trip signal formation at 5 second
Main : Graphs
Time S 0 10 20 30 40 50 ...
... ... 0
10 20 30 40 50 60
A
c
ti
v
e
P
o
w
e
r
(M
W
)
Pow er flow in T46
[image:5.612.324.590.122.324.2] [image:5.612.48.291.177.341.2] [image:5.612.323.575.359.508.2] [image:5.612.48.301.384.525.2] [image:5.612.325.577.534.696.2] [image:5.612.47.301.546.696.2]International Journal of Emerging Technology and Advanced Engineering
Website: www.ijetae.com (ISSN 2250-2459,ISO 9001:2008 Certified Journal, Volume 6, Issue 3, March 2016)
105
From fig. (14) Shows the voltage variation in bus number 4 ,when 3 phase fault occur at bus number 5.Waveform shows that magnitude of voltage sudden down to zero value during fault duration. Fig( 15) shows high magnitude power swing in bus number 4 due to fault in bus number5.Fig (16) and (17) shows about the impedance of each phase in X-Y plane and from the waveform it is clear that each phase impedance enter into the region of mho relay characteristic that why unnecessary tripping take place and trip signal generate trip command at 5 sec.
CASE-IV
When single phase to ground fault occurs in bus number 5.In such situation although the magnitude of power swing in very less at generator one ,when earth resistance considered to 5 ohm but line impedance characteristic is just touch the mho relay characteristic that why trip signal generate unit step response at 5 second .
Main : Graphs
Time S 4.940 4.960 4.980 5.000 5.020 5.040 5.060 5.080 5.100 5.120 ... ... ... -300
-200 -100 0 100 200 300
V
o
lt
a
g
e
(
kv
)
Voltage bus4 w ith PSS
Fig-(20) Voltage variation in bus 4 for single line to ground fault in bus 5
Main : Graphs
Time S 0 10 20 30 40 50 ...
... ... -20
0 20 40 60 80 100
P
ow
er
(
M
W
)
Pow er G1 w ith PSS
Fig. (21) Power swing at G1 when single phase to ground fault occurs.
Fig. (22) Mho relay phase impedance characteristic for medium power swing.
Main : Graphs
Time S 0 10 20 30 40 50 ...
... ... -2.00
-1.50 -1.00 -0.50 0.00 0.50 1.00 1.50 2.00
T
ri
p
S
ig
n
a
l
TripSignal
Fig. (23) Trip signal generation for single phase to ground fault.
Fig (20),(21) shows the voltage variation and power variation in generator 1when single phase to ground fault occurs in bus number 5. From fig (22) it is clear that transmission line impedance touch the mho relay characteristic in X-Y plane. Since it touch the relay characteristic, trip signal generate the response at the time of fault and relay mal-operation take place.
CASE-V
In these case again single phase line to ground fault is created in bus number 5 at 5 sec for .08 sec but here we control the fault current in bus number 5 by increases the ground resistance from 5 ohm to 10 ohm.
Main : Graphs
Time S 4.940 4.960 4.980 5.000 5.020 5.040 5.060 5.080 5.100 5.120 ... ... ... -300
-200 -100 0 100 200 300
V
o
lt
a
g
e
(
kv
)
Voltage bus4 w ith PSS
[image:6.612.323.586.123.263.2] [image:6.612.324.592.300.411.2] [image:6.612.48.300.344.457.2] [image:6.612.47.300.388.589.2] [image:6.612.49.299.495.595.2] [image:6.612.323.566.587.698.2]International Journal of Emerging Technology and Advanced Engineering
Website: www.ijetae.com (ISSN 2250-2459,ISO 9001:2008 Certified Journal, Volume 6, Issue 3, March 2016)
106
Main : Graphs
Time S 0 10 20 30 40 50 ...
... ... -20
0 20 40 60 80 100
P
o
w
e
r
(M
W
)
Pow er G1 w ith PSS
Fig. (25) Active power generation in G1 when single phase to ground fault.
Fig. (26) Mho relay line impedance characteristic for low power swing
Main : Graphs
Time S 0 10 20 30 40 50 ...
... ... -2.00
-1.50 -1.00 -0.50 0.00 0.50 1.00 1.50 2.00
T
ri
p
S
ig
n
a
l
TripSignal
Fig. (27) Trip signal response for low power swing.
Main : Graphs
Time S 0 10 20 30 40 50 ...
... ... 0
10 20 30 40 50 60
A
ct
iv
e
P
o
w
e
r
(M
W
)
Pow er f low in T46
Fig. (28) Power flow through transmission line connect between 4-6.
Fig (24) ,(25) shows the voltage and power variation in generator 1 .Since we control the magnitude of fault current so variation in power is very low and very soon it come to its normal value. From fig (26) it is very clear that impedance characteristic not touch the mho relay characteristic in X-Y plane that why trip signal response is zero in the fault duration time. Fig (28) shows the power transfer from bus number 4 to 6, which shows very low power variation.
V. CONCLUSION
This paper shows the relay performance in various conditions. Simulation results show that how the relay mal- operation takes place when different magnitude power swing occurs at different earth resistance value. Effect of high power swing in relay operation is seen when three phase fault take place in bus number 5 due to transmission line impedance where it enter the relay characteristic and for medium power swing when earth resistance considered 5 ohm again relay mal –operation take place because it just touches the characteristic. In case of low power swing relay performance is unaffected, where earth resistance considered 10 ohm.
REFERENCE
[1] A.Mechraoui ,D.W.P Thomas ― The Influence of power swing on transmission Line Distance Protection, Measurement of power and Voltage Phasor Oscillation at The Relaying point ―. UPEC 93, Volume 2 ,September 93 ,pp 585-588.
[2] P.M. Fonte and Z, C. Quadrado, ―Stability Modeling of WECS for Power Generation‖, WSEAS Trans. On Circuit and Syst., 2005, vol. 3, pp.1591-1596.
[3] Craig Muller, ―Introduction to PSCAD/EMTDC X4”, Manitoba HVDC Research Centre Inc., 2010, Canada.
[4] P. Kundur, M. Klein, G. Rogers, and M. Zywno, ―Application of powersystem stabilizers for enhancement of overall system stability,‖
[5] P.M. Anderson and A.A. Fouad, ―Power System Control and Stability‖, the IOWA state university press AMES IOWA USA, volume I, first edition 1977, chapter 2, page 37-38.
[6] F.baden ,‖Innovations In The Detection of Power Swing In Electrical Network ―.Brown Boveri REV.2-81 .pp 87-93.
[image:7.612.48.290.117.252.2] [image:7.612.47.302.416.603.2]