International Journal of Emerging Technology and Advanced Engineering
Website: www.ijetae.com (ISSN 2250-2459, ISO 9001:2008 Certified Journal, Volume 6, Issue 9, September 2016)
5
Triaxial Tests on High Moisture Content Single Subbase Grain
Materials
Chee Keong Lau
1 1Engineer at Perunding A.L LauAbstract—This paper presents a comparison between
experimental triaxial tests with analytical data to access the correlation between both sets of data. This is done to expand the capabilities of finite element software for pavement design to enable the software to be used in the design of permeable pavement in the future.
Keywords—Resilient modulus; Repeated load triaxial tests; Permeable pavements; Universal testing machine; Subbase
I. INTRODUCTION
Road surfaces are known to account up to 25% of impervious surface in a city [1]. Impervious surfaces are known to cause many issues such as flash flooding, heat island effect, ground water contamination and noise pollution.
Permeable pavement had been known to be a solution to resolve many shortcomings of impervious pavement with improvements such as filtration system for pollutants in order to prevent groundwater pollution [2], temporary storm water storage to mitigate flash flooding [1], reduction of heat island effect via evaporative cooling [3] and reduce noise pollution [4].
Even though permeable pavements offer many benefits over conventional impervious pavements, permeable pavements have low resilient and shear modulus due to higher void ratio that reduced its resilient modulus. This had restricted the use of permeable pavements to mostly low trafficked roads.
In order to aid the design of permeable pavement for future application, finite element software, APADS has to be expanded to predict the resilient modulus and shear modulus.
This paper presents the outcome of the investigation on predicting the resilient, bulk and shear modulus of the subbase with analytical data derived from Hashin Shtrikman Lower Bound (HSLB) using triaxial tests data on single grain size samples of various sizes (6.7mm to 75µm grains). Then, the analytical data is used to compare with 4 triaxial tests on high moisture content subbase.
II. EXPERIMENTAL STUDY
The tri-axial experiments have been carried out with compliance to AASHTO T307-99 (American Association of State Highway and Transportation Officials) for this investigation. The size of the sample is 100mm in diameter and 200mm in height, where the dimensions of the sample fulfil the AASHTO T307-99’s required ratio of height to radius of 2:1. In addition, AASHTO T307-99 also allows the use of pneumatic loading and also the use of a removable sample base which made the sample preparation process to be more convenient.
III. MATERIALS
The study focused on the experimental study of the prediction of resilient modulus of grain size of a standard sieve size on DGB20 (Densely Graded Base) with tri-axial tests. DGB20 (Densely Graded Base) had been the focus of this study as DGB20 is a commonly used crushed basalt grain size distribution in the high trafficked roads sub-base layer in Australia.
The grain size materials used in this investigation were crushed basalt and Nepeon river gravel. The 9.5mm, 6.7mm and 4.75m grain size were river gravel; with the rest was crushed basalt. Sieving process was carried out in compliance to AS1141.11.1.
International Journal of Emerging Technology and Advanced Engineering
Website: www.ijetae.com (ISSN 2250-2459, ISO 9001:2008 Certified Journal, Volume 6, Issue 9, September 2016)
6
The second set of experiments would involve 4 experiments carried out with DGB20 grain size distribution. These experiments had been carried with following variables: 0.26 void ratios with 2 days soak, 0.26 void ratios with 5 days soak, 0.28 void ratios with 2 days soak and lastly, 0.28 void ratios with 5 days soak.IV. SAMPLE PREPARATION AND TESTING
Before the triaxial test was conducted, the soil grains will be soaked for 24 hours where the sample will be prepared for the target void ratio and moisture content.
The optimum moisture content of DGB20 has been found to be 9% [5]. Therefore, 9% moisture content was used for smaller grain size such as 0.6mm and below. Then, samples with larger grain size (2.36mm and above) was soaked with 11% moisture content because large amount of water will be lost during the compaction process as the water leaks out of the tri-axial base due to the lack of cohesion between the grains to trap the water between the voids where some of the water will be lost in sample preparation.
Subsequently, the sample was prepared and soaked for 2 or 5 days in the UTM (Universal Testing Machine) to fill all the voids between the soil grains with water under 100kPa confining preassure. All single grain size experiments were soaked for 5 days while DGB20 experiments were soaked to 2 or 5 days. 5 days was chosen to be the optimum soaking duration in order to obtain the highest possible degree of saturation, with the rate of soaking slows down significantly after 5 days [5]. Based on past experience, 2 days DGB20 experiment yield 50 to 60% degrees of saturation, while a 5 days soak of DGB20 will provide 70% to 80% degree of saturation. A distilled water tank was placed about 1.5m from the base of the sample to provide atmospheric pressure on the sample to simulate the natural flow of water into the soil from the top and the bottom of the sample.
After 5 days of soaking in UTM, the triaxial tests were performed. AASHTO T307-99 requires the specimen to be first conditioned by applying 1,000 load cycles. This is done to supress most of permanent deformation at initial stages and to remove most irregularities at the top and bottom of the sample [6]. A Haversine shaped load pulse is applied on each cycle at different confining and deviatoric stress to enable the measurement of resilient modulus at different normal and shear stresses. The load pulse set in the UTM is 0.1 second for load duration and 0.9 second for rest period. After the triaxial test was performed, the data was collected and analysed.
V. PREDICTION OF RESILIENT MODULUS
For the prediction of resilient modulus of a grain size distribution, such as DGB20, based on the resilient modulus of single grain size material, a set of equations were used to predict the resilient modulus [7].
There are 2 ways where the particles of various sizes can be arranged in a soil matrix. The grains distribution could consists of small particles can be fit into the voids of the larger particles, if there are large amount of large particle (β ≤ Φ1 condition). Alternatively, the large grains can be suspended in fine grains if there are large amount of fine grains (β > Φ1 condition). Hence, there are 2 sets of equation can be used that is governed by condition shown below.
Where,
β =
Φ1 = Porosity of large grain size
Φ2 = Porosity of small grain size
L1 = Number of large grains in the mixture
L2 = Number of small grains in the mixture
R1 = Grain radii of large particle
R2 = Grain radii of small particle
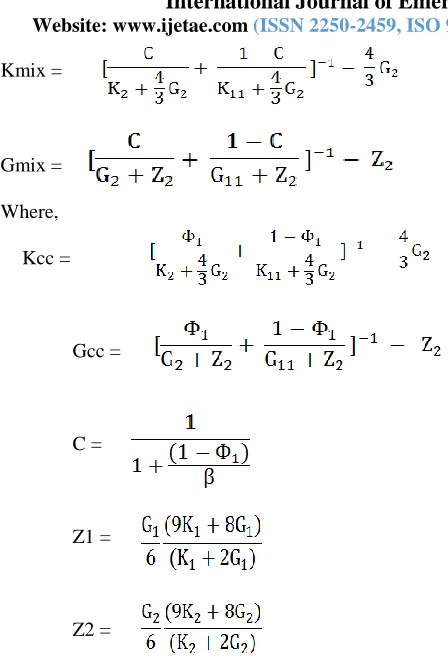
In the β ≤ Φ1 condition where the fine grain size pack fits into the voids of the large grain pack with the external load applied on the soil mixture is being carried by the large grain size. The mixture of 2 elements is found to be similar to Hashin-Shtirkman Lower Bound (HSLB). According to Dvorkin et al, 2001, HSLB could predict experimental measures accurately. The formulae below can be used to predict the effective bulk modulus and shear modulus for the β ≤ Φ1 condition.
Kmix =
Gmix =
International Journal of Emerging Technology and Advanced Engineering
Website: www.ijetae.com (ISSN 2250-2459, ISO 9001:2008 Certified Journal, Volume 6, Issue 9, September 2016)
7
Kmix =Gmix =
Where,
Kcc =
Gcc =
C =
Z1 =
Z2 =
G11 = Effective bulk modulus of large grain size
K11 = Effective shear modulus of large grain size
The elastic modulus of the mixture of grains can be calculated with the formula below:
The results of the analysis is collected and then compared with the experimental data obtain.
VI. COMPARISON OF ANALYTICAL AND EXPERIMENTAL RESULTS
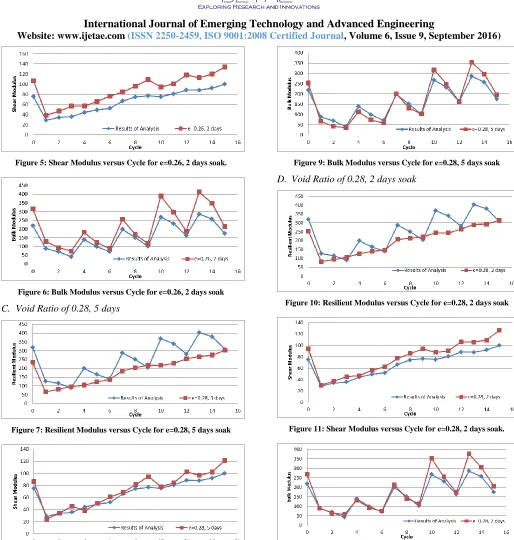
The results from the single grain triaxial tests were inputted into the equations [7] in order to obtain the analytical results. The analytical results of bulk modulus, resilient modulus and shear modulus were then used to compare with the experimental results to determine the correlation between analytical and experimental data. The experimental results and analytical output is presented in the following sections.
[image:3.612.179.563.108.675.2]A. Void Ratio of 0.26, 5 days soak.
[image:3.612.48.272.111.442.2]Figure 1: Resilient Modulus versus Cycle for e=0.26, 5 days soak
[image:3.612.323.568.563.680.2]Figure 2: Shear Modulus versus Cycle for e=0.26, 5 days soak.
Figure 3: Bulk Modulus versus Cycle, e=0.26, 5 days soak.
B. Void Ratio of 0.26, 2 days soak.
International Journal of Emerging Technology and Advanced Engineering
Website: www.ijetae.com (ISSN 2250-2459, ISO 9001:2008 Certified Journal, Volume 6, Issue 9, September 2016)
8
[image:4.612.47.561.88.628.2]Figure 5: Shear Modulus versus Cycle for e=0.26, 2 days soak.
Figure 6: Bulk Modulus versus Cycle for e=0.26, 2 days soak
[image:4.612.48.298.385.640.2]C. Void Ratio of 0.28, 5 days
Figure 7: Resilient Modulus versus Cycle for e=0.28, 5 days soak
Figure 8: Shear Modulus versus Cycle for e=0.28, 5 days soak.
Figure 9: Bulk Modulus versus Cycle for e=0.28, 5 days soak
[image:4.612.321.563.391.631.2]D. Void Ratio of 0.28, 2 days soak
Figure 10: Resilient Modulus versus Cycle for e=0.28, 2 days soak
Figure 11: Shear Modulus versus Cycle for e=0.28, 2 days soak.
International Journal of Emerging Technology and Advanced Engineering
Website: www.ijetae.com (ISSN 2250-2459, ISO 9001:2008 Certified Journal, Volume 6, Issue 9, September 2016)
9
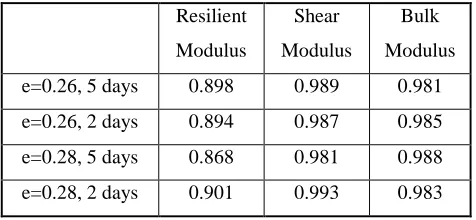
VII. DISCUSSION ON RESULTS [image:5.612.50.288.340.450.2]The experimental result had been shown to have good correlation with analytical results with 0.868 or higher coefficient of correlation in Table 1. The Hashin Shtrikman Lower Bound (HSLB) used in the equations proposed by Dvorkin et al, 2001 analysis of experimental results have been found to be capable of predicting the resilient modulus, shear modulus and bulk modulus of DGB20 at high degree of saturation. This is a highly desirable property as this suggests that the Dvorkin et al, 2001’s equation [7] could be used to predict the resilient modulus of a grain size distribution given reliably. Typical subgrade unbounded granular material are found to be in the range between 100MPa to 400Mpa, the results presented in this paper fall between typical ranges of resilient modulus.
Table I:
Correlation between the experimental and analytical data
Resilient
Modulus
Shear
Modulus
Bulk
Modulus
e=0.26, 5 days 0.898 0.989 0.981
e=0.26, 2 days 0.894 0.987 0.985
e=0.28, 5 days 0.868 0.981 0.988
e=0.28, 2 days 0.901 0.993 0.983
There are 3 assumptions for the analytical results where only the largest particle size possible is generated for each range of size, 13.2mm and 9.5mm sieve size were not considered in the calculations and there is no randomization.
The calculated subgrade modulus is known to be higher than laboratory resilient modulus which is consistent with the findings of this paper. The AASTHO (1993) recommends that a correction factor of not more than 0.33.
DGB20 largely consists of non-cohesive granular soils where a correction factor as great as 0.33 might not be required [8]. Therefore, the correction factor is not applied on the analytical data of this paper.
VIII. CONCLUSION
After conducting investigations on the resilient modulus of single grain size material and comparison of the analysis of the single grain size material with DGB20 experimental data, it can be found the analytical data correlates well with the experimental data with at least +0.85. This can be concluded that Hashin Shtrikman Lower Bound (HSLB) equations [7] able to predict resilient modulus of DGB20 with good accuracy at high degree of saturation.
REFERENCES
[1] Shackel, B. The Design, Construction and Evaluation of Permeable Pavements in Australia. University of New South Wales, 2010. [2] Drake, J., A. Bradford, and T. Van Seters, Stormwater quality of
spring–summer-fall effluent from three partial-infiltration permeable pavement systems and conventional asphalt pavement. Journal of Environmental Management, 2014. 139: p. 69-79.
[3] Li, H., J. Harvey, and Z. Ge, Experimental investigation on evaporation rate for enhancing evaporative cooling effect of permeable pavement materials. Construction and Building Materials, 2014. 65: p. 367-375.
[4] Descornet, G. Low Noise Road Surface Techniques And Materials. 2000.
[5] Teoh, M., Porous pavements: Advanced Characterisation and Analysis, in Available from of Civil and Environmental Engineering undergraduate thesis. 2009.
[6] Munir, D., A.L. Nazzal, and L.N. Nazzal, Estimation of Resilient Modulus of Subgrade Soils. Vol. 2010 SRC - GoogleScholar. 2011. [7] Dvorkin, M.A., Grain Sorting, Porosity and Elasticity. Stanford
University, 2001.