International Journal of Emerging Technology and Advanced Engineering
Website: www.ijetae.com (ISSN 2250-2459, ISO 9001:2008 Certified Journal, Volume 4, Issue 9, September 2014)
305
An Improved Amplitude Comparison Based Direction of
Arrival Estimation
B. Priyanka
1, V. Sudha Rani
2, M. K. Das
3,
S. Sounak
41PG Student, 2Associate Professor, Sreenidhi Institute of Science & Technology, Hyderabad, India
3,4Scientist, Defence Electronics Research Laboratory (DRDO), Hyderabad, India
Abstract—The Direction of Arrival (DOA) is regarded as the best initial sorting parameter for locating enemy radar. The Direction finding (DF) systems are employed for estimating the direction of arrival of radar installation. Among all the techniques Amplitude Comparison Direction Finding (ADF) technique is the simplest. The Amplitude Comparison DF compares amplitude of the signal at multiple receivers for finding DOA. Conventional ADF provides moderate accuracy of around 5 degrees in the C through J band. In this project a fuzzy classifier based ADF algorithm is proposed to enhance the DOA performance in terms of accuracy. The algorithm will be simulated in MATLAB and tested on real time data. The effects of various parameters such as number of cluster centers, fuzzy index, beam shaping factor, initial centers, clustering methods on the algorithm are considered.
Keywords— Amplitude Comparison, DOA, Fuzzy Clustering, Fuzzy C Mean, Kmean.
I. INTRODUCTION
The Signal Processing in Electronic Warfare basically deals with signal detection, emitter parameter measurement, emitter sorting, identification and operator notification. [2] The ultimate goal of this processing is to classify radar signals by their unique characteristics and to use this data to identify enemy radars operating in the environment, determine their location or direction, assess their threat to friendly forces and display this information to the operator. The Direction of Arrival (DOA) is regarded as the best initial sorting parameter for locating enemy radar. The Direction finding (DF) systems are employed for estimating the direction of arrival of radar installation.
The DF system can be implemented using various techniques such as Rotary Direction Finding (RDF), Amplitude Comparison Direction Finding (ADF), Time Difference of Arrival (TDOA) Direction Finding, and Phase Comparison Direction Finding (PDF). Among all these Amplitude Comparison Direction Finding (ADF) technique is the simplest.
The Amplitude Comparison DF compares amplitude of the signal at multiple receivers for finding DOA. Each antenna of the antenna array points to different direction so that the array covers 360º in azimuth. The antenna facing towards the emitter produces the strongest output. Hence, by comparing outputs of all antennas, the DOA can be calculated. ADF provides moderate accuracy of 3-4 degrees in the C through J band.
In this project a classifier based ACDF algorithm which uses fuzzy c mean algorithm and interpolation techniques is proposed to enhance the DOA performance in terms of accuracy.
II. ESM SYSTEMS
The typical emitter characteristics that an ESM system can measure for a pulse radar include the following data:
Radio Frequency (RF), Amplitude (power), Direction of Arrival (DOA) - also called Angle of Arrival (AOA), Time of Arrival (TOA), Pulse Repetition Interval (PRI), PRI type, Pulse Width (PW).
More sophisticated ESM systems can measure additional parameters, such as PRI modulation characteristics, inter-and intra-pulse Frequency Modulation (FM), missile guidance characteristics (e.g., pattern of pulse spacing within a pulse group), and Continuous Wave (CW) signals. Still other parameters which can describe an electromagnetic wave but are currently not commonly used for identification include polarization and phase.
Out of these, Direction of Arrival (DOA) is regarded as the best initial sorting parameter for locating an enemy radar because it is the only parameter that cannot be camouflaged by the enemy radar i.e., it cannot be varied by the emitter from pulse to pulse. Other parameters like frequency, pulse width, PRF etc can be varied to incorporate ECCM features in the radar.
III. DIRECTION FINDING SYSTEM
International Journal of Emerging Technology and Advanced Engineering
Website: www.ijetae.com (ISSN 2250-2459, ISO 9001:2008 Certified Journal, Volume 4, Issue 9, September 2014)
306
It is already discussed that AOA is an invariant sorting parameter in the deinterleaving of radar signals. In addition, the conservation of jamming power in power managed ECM systems depends on the ability of the associated ESM system to measure the direction to the victim emitter i.e., high accuracy DOA measurement improves ECM performance.
The DF system can be implemented using various techniques such as
a)Rotary Direction Finding (RDF)
b)Amplitude Comparison Direction Finding (ADF)
c)Time Difference of Arrival (TDOA) Direction Finding
d)Phase Comparison Direction Finding (PDF) or Interferometer
Among all these Amplitude Comparison Direction Finding (ADF) technique is the simplest.
IV. AMPLITUDE COMPARISON DF
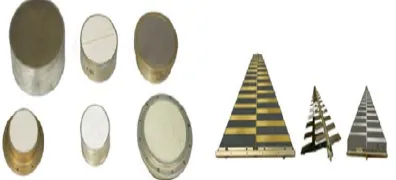
[image:2.612.340.553.148.250.2]Amplitude comparison uses multiple directional antenna receiver system, each antenna pointing toward a different direction. The antenna facing the direction of the emitter will generate the strongest output from the receiver connected to this antenna. By comparing the different amplitudes of these outputs, the AOA information can be obtained.
Figure 1 Amplitude Comparison Direction Finding System
[image:2.612.385.506.385.534.2]The number of antennas to be used and the beamwidth of each antenna is related by Beam width = 360 / number of antennas in the array. For an 6 antenna amplitude comparison system the typical beam width of each antenna will be 60°. Practical antennas have a beam width variation over the frequency of the order of ±15°. The typical antenna pattern is given in fig.
Figure 2: A typical antenna pattern
Consider two antennas 45° apart. For a signal incident on the boresight of one of the antennas the amplitude of the signal at the output of the adjacent antenna is approximately 6 to 10 dB down depending on the beamwidth and the rolloff. For a signal coming in between the two boresights the two amplitudes will be approximately equal. This means that over a 22.5° variation in the azimuthal DOA of the signal the variation in the amplitude is around 8 dB. This differential amplitude is used to compute the DOA of the signal.
Figure 3: A Six Quadrant ADF
[image:2.612.62.276.462.585.2] [image:2.612.351.549.571.661.2]International Journal of Emerging Technology and Advanced Engineering
Website: www.ijetae.com (ISSN 2250-2459, ISO 9001:2008 Certified Journal, Volume 4, Issue 9, September 2014)
[image:3.612.79.277.145.276.2]307
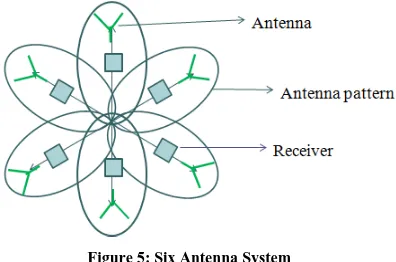
Figure 5: Six Antenna System
The accuracy of amplitude comparison DF system is directly dependent on the amplitude differential of the two antenna outputs as the DOA varies from the boresight of one of them to the bisector of the two boresights. Assuming a of ±3 dB mismatch between the two RF frontend chains the DF accuracy for an 8 antenna DF system is given by DF accuracy = 3 x 22.5 / 8 ≈ 9°.
V. CLUSTERING
Clustering is the process in which data is split into a set of patterns which are more or less homogeneous (clusters). Clustering is based on a similarity parameter such as minimum distance from the centers etc … so that data points belonging to one of the clusters are as similar and are as dissimilar as possible from the remaining clusters. The similarity parameter used has an important effect in the clustering results as it indicates the properties of the data set that can be used to group or cluster the data points such as the distance between them, amplitude or intensity.
Since clustering is the grouping of similar instances/objects, some sort of measure that can determine whether two objects are similar or dissimilar is required. There are two main type of measures used to estimate this relation: distance measures and similarity measures.
A. Distance Measure
Many clustering methods use distance measures to determine the similarity or dissimilarity between any pair of objects. It is useful to denote the distance between two data a and b as: d(a,b). A valid distance measure should be symmetric and obtains its minimum value (usually zero) in case of identical vectors. Common measures are Euclidian distance which is the most popular, Mahalanobis distance, Manhattan distance etc...[10].
B. Error Minimization Algorithms
These clustering algorithms are the most frequently used methods. The basic idea is to find a clustering structure that minimizes a certain error criterion or cost function which measures the ―distance‖ of each data to its representative value called a cluster center. The most well-known criterion is the Sum of Squared Error, which measures the total squared Euclidian distance of instances to their representative values.
The most common and simplest algorithm that uses a squared error criterion is the K-means algorithm.
C. K-means algorithm
In this algorithm data is partitioned into K clusters (C1, C2, C3……. Ck ). Each cluster has its cluster center. The center is the mean value of all the data points belonging to that cluster. The algorithm requires an initial set of cluster centers which can be chosen at random or according to some property. It is an iterative algorithm. During every iteration Euclidian distance between the data and the cluster centers is calculated and whichever distance is minimum the data point is allotted to that cluster. The center of each cluster is recalculated as the mean of all the instances belonging to that cluster [6],[10].
We can specify the maximum number of iterations and the minimum improvement factor. The algorithm may be stopped in two ways: By specifying a fixed no of iterations; or by calculating the improvement in cost function and if it is less than a specific value then stop the algorithm.[10]
The linear complexity is one of the reasons for the popularity of the K- means algorithms. Even if the number of instances is substantially large (which often is the case nowadays), this algorithm is computationally attractive. Thus, the algorithm has an advantage in comparison to other clustering algorithms.
The algorithm is also simple to implement, results are easy to interpret, its speed of convergence is higher than other algorithms and it can adapt to sparse data
The disadvantage of K-means algorithm involves the selection of the initial partition. The algorithm is very sensitive to this selection, which may make the difference between global and local minimum.
International Journal of Emerging Technology and Advanced Engineering
Website: www.ijetae.com (ISSN 2250-2459, ISO 9001:2008 Certified Journal, Volume 4, Issue 9, September 2014)
308
D. Fuzzy Logic
In the past decade, fuzzy systems are being employed in pattern recognition and control systems. Fuzzy logic is also used in a wide variety of industrial systems and consumer products. Examples include camcorders, autofocus cameras, washing machines, palmtop computers, vacuum cleaners, air conditioners, subway trains, combustion control regulators, automobile transmissions, ship navigators, and cement kilns. Fuzzy technology in the form of approximate reasoning is being used in information technology, where it provides expert systems and decision-support with powerful reasoning capabilities bound by some minimum of rules.
In a Classical Theory, an element or data point will either belongs to a cluster or does not belong to a cluster. The membership value of the data point/ element is either zero or one. That is it‘s either or False. It is called crisp logic. In Fuzzy Theory data point will belong to all the clusters and will have varying membership in the interval [1, 0] across various clusters. The total membership i.e. the sum of membership of a point in all clusters should be equal to one. A generalized approach to classical theory gives Fuzzy theory. Fuzzy set may have infinite membership functions which can represent them but classical sets have only one unique membership function which can represent them. This enables fuzzy systems to be adjusted for maximum utility in a given situation [8].
E. Fuzzy Clustering
In "hard" clustering or non fuzzy clustering, the boundaries between various clusters is hard or crisp and one data point is assigned to one cluster., In fuzzy clustering results are provided along with the information about their memberships with the various clusters. They indicate the degree of belongingness of the data point /element to every cluster. The Fuzzy C Means algorithm developed by Bezdek is widely used. The cost function of FCM is given by [8]
( ) ∑ ∑
Where ‗c‘ is no clusters, ‗n‘ is the no of data points, ‗u‘ is the membership value, ‗v‘ is the cluster center and ‗x‘ is the data point.
F. Fuzzy c-Means Algorithm:
The Fuzzy c-Means Algorithm used in the paper and steps involved are given below [3],[8]:
Step 1: Select a number of clusters c (2 ≤ c ≤ n) and
exponential weight m (1 <m < ∞). Choose initial centers
and a termination criterion ϵ. Set the iteration index I to 0.
Step 2: Calculate the new partition matrix by using
{ | i = 1, 2, ..., c} and Eq.
⁄ ⁄
∑ ⁄ ⁄
for
i=1,2,…c; j=1,2,….n
Step 3: Calculate the fuzzy cluster centers { | i = 1, 2,
..., c} by using and Eq.
∑ ∑ for i = 1,2,…..c
Step 4: Calculate ∆ =|| - || = .
If ∆ > ϵ, then set 1 = 1 + 1 and go to step 2. If ∆ ≤ ϵ, then stop.
END FCM
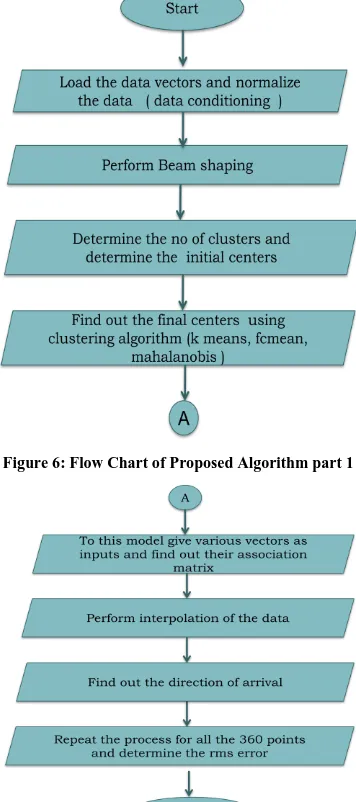
VI. PROPOSED METHODOLOGY
The main objective of the project is to improve the performance of the amplitude comparison system in terms of accuracy. Instead of using traditional non clustering approaches [1] we propose the use of clustering techniques to estimate the direction of arrival. The following algorithm is proposed:
Steps involved are summarized:
International Journal of Emerging Technology and Advanced Engineering
Website: www.ijetae.com (ISSN 2250-2459, ISO 9001:2008 Certified Journal, Volume 4, Issue 9, September 2014)
309
[image:5.612.321.562.178.697.2]Find out the direction of arrival by choosing the maximum value in the interpolated data Repeat the process for all the 360 points and determine the RMS error
Figure 6: Flow Chart of Proposed Algorithm part 1
Figure 7: Flow Chart of Proposed Algorithm part 2
VII. RESULTS
We have implemented the proposed algorithm in four different ways by changing the algorithm used for clustering and by using two distance measures Euclidian Distance and Mahalanobis Distance. They are: FCM with Interpolation, means with Interpolation, means, K-means and Mahalanobis distance.
Amplitude Data was acquired from a 6 antenna system in steps of 1˚ to cover the total 360 degree in the frequency range of 2-18 GHz. This practical data is used as input to the algorithm.
Figure 8: Input Data Pattern at frequency 16 GHz
Figure 9: Input data after Beam shaping and Normalization in Matlab at frequency 16 GHz
Figure 10: Comparison of RMS Error of K-Means and FCM with Interpolation at different frequencies
0 50 100 150 200 250 300 350 400
0 0.2 0.4 0.6 0.8 1 1.2 1.4
0 50 100 150 200 250 300 350 400
0 0.1 0.2 0.3 0.4 0.5 0.6 0.7 0.8 0.9 1
2 4 6 8 10 12 14 16 18
1 1.5 2 2.5 3 3.5 4 4.5
Frequency in GHz
Comparision of Rms error of KMean and FCMean with Interpolation
[image:5.612.79.257.184.585.2]International Journal of Emerging Technology and Advanced Engineering
Website: www.ijetae.com (ISSN 2250-2459, ISO 9001:2008 Certified Journal, Volume 4, Issue 9, September 2014)
[image:6.612.315.569.164.343.2]310
Table I.
Root Mean Square Error Of Angle Of Arrival Estimation At Different Frequencies (In Degrees)
Method 16 GHz 4 GHz 2 GHz
FCM and Interpolation
2.0276˚ 1.720˚ 1.560˚
K-means and Interpolation
2.303˚ 1.772˚ 1.599˚
K-means algorithm
2.617˚ 2.469˚ 2.382˚
K-means and Mahalanobis Distance
[image:6.612.40.296.170.474.2]2.864˚ 2.903˚ 2.379˚
Table II
Root Mean Square Error Of Angle Of Arrival Estimation (In Degrees) Varying The No Of Clusters
Clusters K-means Fcm
10 37.1730 39.0101
20 15.1935 21.1817
30 3.4401 3.3949
40 2.7130 8.4271
50 7.3063 8.2800
60 2.3352 2.0276
70 2.0954 1.9269
90 1.8109 2.0074
Table III
Root Mean Square Error Of Angle Of Arrival Estimation (In Degrees) Varying The Fuzzy Index ‘m’
m FCM
1.1 3.8932
1.2 3.9472
1.4 3.7132
1.6 3.6139
1.8 3.4440
2 2.0679
2.2 3.3228
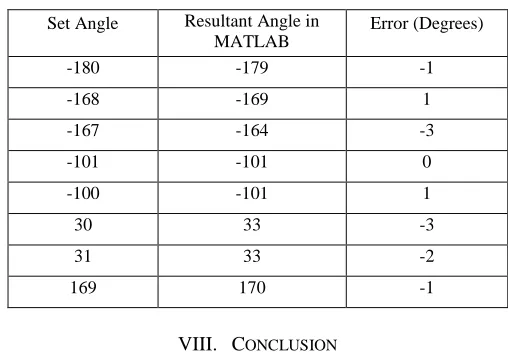
Table IV
Angles Obtained In Matlab At 16 Ghz Frequency And With 60 Clusters
Set Angle Resultant Angle in MATLAB
Error (Degrees)
-180 -179 -1
-168 -169 1
-167 -164 -3
-101 -101 0
-100 -101 1
30 33 -3
31 33 -2
169 170 -1
VIII. CONCLUSION
In this paper instead of using traditional non clustering approaches we propose the use of clustering techniques to estimate the direction of arrival. Fuzzy Clustering Technique has been used. The performance of the amplitude comparison system has been improved in terms of accuracy. However this method needs prior information about the system. The time taken by the fuzzy algorithm is longer than the conventional algorithms. Instead of using the traditional FCM and K means algorithm we can improve them [5], [8] to make them faster and memory efficient.
Acknowledgements
The author thanks the Director of Defence Electronics Research Laboratory Hyderabad (DLRL) for his support and Mr. Amit Kumar Gupta Sc-‗D‘, DLRL for his continuous support and valuable guidance, and Dr.Venu Madhav Roa, HOD, Dept of ECE, Sreenidhi Institute of Science and Technology for his valuable Suggestions.
REFERENCES
[1] Ruiming Yang, Yipeng Liu, Qun Wan and Wanlin Yang, Compressive Direction Finding Based on Amplitude Comparison; Journal of Networks vol:6 issue:3 pages:498-504.
International Journal of Emerging Technology and Advanced Engineering
Website: www.ijetae.com (ISSN 2250-2459, ISO 9001:2008 Certified Journal, Volume 4, Issue 9, September 2014)
311
[3] Bezdek, J.C, Dave, Jitendra V, Cannon, Robert L; ―Efficient Implementation of the Fuzzy c-Means Clustering Algorithms‖, IEEE Transactions on Pattern Analysis and Machine Intelligence. [4] Chen Yanyun , Qiu Jianlin, Gu Xiang,Chen Jianping, Ji Dan, Chen
Li, ―Advances In Research Of Fuzzy C-means Clustering Algorithm‖, 2011 International Conference on Network Computing and Information Security(NCIS).
[5] Huang Kai-feng, Chen Yu-hua, ―An improved Fuzzy C-Means Clustering Algorithm‖, International Conference Automatic Control and Artificial Intelligence (ACAI 2012),
[6] J. A. Hartigan and M. A. Wong, ―A K-Means Clustering Algorithm‖, Journal of the Royal Statistical Society. Series C (Applied Statistics), Vol. 28, No. 1 (1979), pp. 100-108.
[7] Mahalanobis, Prasanta Chandra (1936). "On the generalised distance in statistics". Proceedings of the National Institute of Sciences of India 2 (1): 49–55. Retrieved 2012-05-03.
[8] Chin Teng Lin, C.S George Lee―, Book- Neural Fuzzy System‖ [9] Shi Na, Liu Xumin, Guan Yong, ―Research on k-means Clustering
Algorithm: An Improved k-means Clustering Algorithm‖ 2010 Third International Symposium on Intelligent Information Technology and Security Informatics.