© 2016, IRJET | Impact Factor value: 4.45 | ISO 9001:2008 Certified Journal | Page 894
Optimization of process parameters of “CNC Drill Machine” for mild
steel using Taguchi design and Single to Noise ratio Analysis
ARYA YASHVARDHAN
1, SHARMA GYANENDU
2.
1,
Student of Mechanical Engineering Department, NIU , Greater Noida , India
2
. Asst . Professor , Department of Mechanical Engineering Department NIU , Greater Noida , India
---***---Abstract -
In this paper signal-to-noise ratio method is applied to find optimum process parameters for finishing operation of mild steel with the help of CNC milling machine and high speed steel tool used. The signal-to-noise ratio applied to find optimum process parameter for CNC finishing machining .A L9 orthogonal array and analysis of variance(ANOVA) are applied to study the performance characteristics of machining parameter (spindle speed, feed, depth, width) with consideration of high surface finish and high material removal rate(MRR) .The surface finishing and material removal rate have been identified as quality attributes and assumed to be directly related to productivity improvement. Results obtained by taguchi method and signal-to-noise ratio match closely with (ANOVA) and the feed is most effective factor for MRR. And spindle speed is the most effective factor for surface roughness. Multiple regression equation are formulated for estimating predicted value surface roughness and material removal rateKey Words: CNC milling machine, surface roughness, material removal rate (MRR), Taguchi method, ANOVA , S/N Ratio
MRR&SR .
1.INTRODUCTION
© 2016, IRJET | Impact Factor value: 4.45 | ISO 9001:2008 Certified Journal | Page 895
2.Experimental Processes
Work piece Material
Finishing operation will be performed on Mild steel work piece .Mild steel are soft, ductile and easily machined The composition of mild conation carbon (0.05%to0.3%) and small quantities of manganese(Mn), silicon(Si), phosphorus (P) sulphur(S
) are material related properties. Experiments were performed using a CNC vertical Milling machine. A rectangular mild steel plate of size 100 mm ×76mm ×12mm in shaping machine for performing CNC drilling machine. Holy oil was used as the coolant fluid in this experiment .Young’s Modulus (210GPa), Poisson’s Ratio (0.29) Density (7.8g/cm³), Melting Point (140ºC) Modulus of elasticity (200GPa) Bulk Modulus (140GPa).
2.1.High speed steel:-
One of our tools for the CNC finishing operation will be the high speed steel. High speed steel (HSS)are used for making finishing tools, we used tool diameter 6 mm in the milling machine and point angle is 118º This property allows HSS to finishing faster than high carbon steel, hence the name high speed steel. At room temperature, in their generally recommended heat treatment, HSS grades generally display high hardness The composition of high speed steel are carbon (0.6%to0.75%) tungsten (14%to20%),Chromium (3%to5%) vanadium (1%to1.5%), Cobalt (5%to10%) and remaining is iron.
2.2.Plan of experiment:-
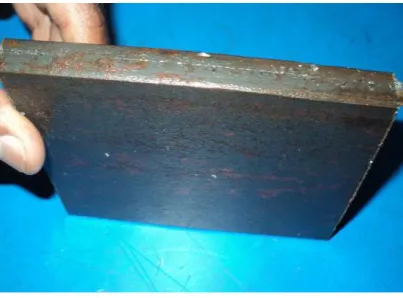
[image:2.595.197.399.462.611.2]The plan of experiment is taken A rectangular mild steel plate of size 100 mm ×76mm ×12mm. In this plate finishing operation are perform with 6 mm diameter of tool. The experiments were conducted according to taguchi orthogonal array. Which helps in reducing the number of experiment. In this paper four parameter and three levels considered for experimental runs. Optimization for quality was carried out with signal to noise ratio and analysis of variance (ANOVA).
Figure 1- Image of Experimental workpiece.
© 2016, IRJET | Impact Factor value: 4.45 | ISO 9001:2008 Certified Journal | Page 896
Work condition Description
Work piece Mild steel , Rectangular shape
(100x76x10mm)
Spindle speed 200 to 2000 rpm
Feed 200 to 2000 mm/min
Depth of cut .01 to .1 mm
Width of cut .1 to .4 mm
Coolant Holy oil
Lubricant Servo pat
[image:3.595.194.401.574.736.2]Tool Diameter 6 mm
© 2016, IRJET | Impact Factor value: 4.45 | ISO 9001:2008 Certified Journal | Page 897
3.Design of Experiment and Data Analysis
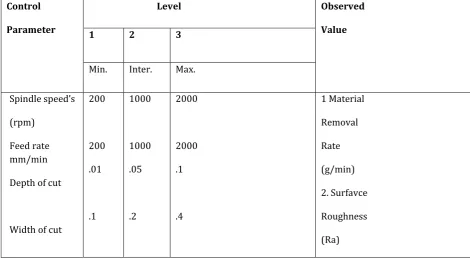
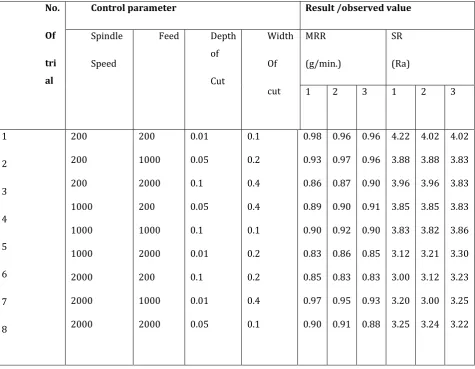
[image:4.595.60.531.293.552.2]Design of Experiment The experimental layout for the machining parameterusing the L9 orthogonal array (OA) and Signal to noise ratio. The machine was used for the finishing operation in this study. The surface and MRR are two essential part of a product in any drilling machining operation the theoretical surface roughness is generally dependent on many parameters such as the tool geometry, tool material and work piece material. This array having a four control parameters and three levels as shown in Table 2.This method, more essentials all of the observed values are calculated based on ‘the Higher the better’ and ‘the smaller the better’. In the present study spindle speed (N, rpm) Feed rate (f, mm/min.) depth of cut (D, mm) and width of cut(W, mm) have been selected as design factor. while other parameter have been assumed to be constant over the Experimental domain This Experiment focuses the observed values of MRR and SR were set to maximum, intermediate and minimum respectively. Each experimental trial was performed with three simple replications at each set value. Next, Signal to noise ratio is used to optimize the observed values.
Table 2- Design scheme of experiment of Parameters and levels
Control
Parameter
Level Observed
Value
1 2 3
Min. Inter. Max.
Spindle speed’s
(rpm)
Feed rate mm/min
Depth of cut
Width of cut
200
200
.01
.1
1000
1000
.05
.2
2000
2000
.1
.4
1 Material
Removal
Rate
(g/min)
2. Surfavce
Roughness
(Ra)
3.1.
Methodology
3.2.SIGNAL TO NOISE RATIO CALCULATION
Quality Characteristics:
S/N characteristics formulated for three different categories are as follows: Larger is Best Characteristic:
Data sequence for MRR (Material Removal Rate), which are higher-the-better performance characteristic are pre-processed as per Eq.1
S/N= -10 log ((1/n) ((1/y2))... ... ..1 Nominal and Smaller are Best Characteristics
Data sequences for SR , which are lower-the-better performance characteristic, are pre- processed as per Eq.2 &3
S/N= -10 log (y/s2y)... ... ...2 S/N= -10 log ((1/n) (Σ(y2))... ... ...3
© 2016, IRJET | Impact Factor value: 4.45 | ISO 9001:2008 Certified Journal | Page 898
3.3.Data Analysis
[image:5.595.62.538.301.670.2]In this paper, analysis based on the taguchi method is done by Signal to noise ratio(MINI-TAB-16Software ) to determine the main effects of the process parameters, to perform the analysis of variance(ANOVA) and to establish the Signal to noise ratio optimum conditions. The main effects analysis is used to study the trend of the effects of each of the factors, as shown in figures 4 and 5. The machining performance (ANOVA-rank factor) for each experiment of the L9 can be calculated by taking the observed values of the MRR as an example from table 3. The taugchi analysis parameter for spindle speed (A) feed (B) depth of cut(C) and width of cut(D). The response table6 for MRR use in the signal to noise ratio larger is the better and response table7 for mean effects plot for S/N ratio the spindle speed is less in level (3) compare to the other level .the feed is the high at level (1) and depth is minimum at level (2) all this case the MRR is maximum .the surface roughness is calculated by the same procedure.table8&9 for Signal to Noise Ratios Smaller is better and Means Main Effects Plot for S/N ratios. The surface roughness is minimum at high spindle speed, low feed rate and also low depth of cut.
Table 3 - L9 table and observed value
No.
Of
tri al
Control parameter Result /observed value
Spindle
Speed
Feed Depth
of Cut Width Of cut MRR (g/min.) SR (Ra)
1 2 3 1 2 3
© 2016, IRJET | Impact Factor value: 4.45 | ISO 9001:2008 Certified Journal | Page 899
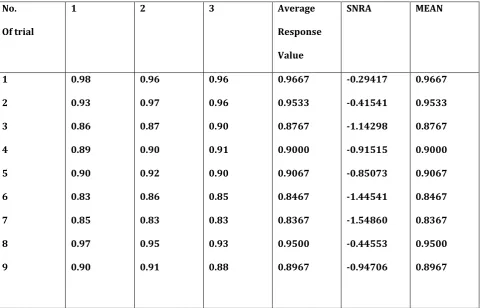
Table 4 -S/N Ratio for MRR (Larger is Better)No.
Of trial
1 2 3 Average
Response
Value
SNRA MEAN
1
2
3
4
5
6
7
8
9
0.98
0.93
0.86
0.89
0.90
0.83
0.85
0.97
0.90
0.96
0.97
0.87
0.90
0.92
0.86
0.83
0.95
0.91
0.96
0.96
0.90
0.91
0.90
0.85
0.83
0.93
0.88
0.9667
0.9533
0.8767
0.9000
0.9067
0.8467
0.8367
0.9500
0.8967
-0.29417
-0.41541
-1.14298
-0.91515
-0.85073
-1.44541
-1.54860
-0.44553
-0.94706
0.9667
0.9533
0.8767
0.9000
0.9067
0.8467
0.8367
0.9500
[image:6.595.34.519.164.472.2]© 2016, IRJET | Impact Factor value: 4.45 | ISO 9001:2008 Certified Journal | Page 900
Table 5 - S/N Ratio for SR (Smaller is Better)4.Hole data
All data regarding the holes is stored inside a collection (named "Holes“) of instances of a dedicated data structure (named "Hole“). The data structure contains geometrical information - inputted with respect to a specified coordinate system - and other non-geometrical specifications. Table 1 presents in tabular form an example of hole data. with sample values for the most important fields.
No.
Of trial
1 2 3 Average
Response value
SNRA MEAN
1
2
3
4
5
6
7
8
9
4.22
3.88
3.96
3.85
3.83
3.12
3.00
3.20
3.25
4.02
3.86
3.80
3.85
3.82
3.21
3.12
3.00
3.24
4.02
3.83
3.83
3.83
3.86
3.30
3.23
3.25
3.22
4.0867
3.8567
3.8633
3.8433
3.8367
3.2100
3.1167
3.1500
3.2367
-12.2275
-11.7243
-11.7392
-11.6941
-11.6792
-10.1301
-9.8739
-9.9662
-10.2020
4.0867
3.8567
3.8633
3.8433
3.8367
3.2100
3.1167
3.1500
[image:7.595.33.515.119.480.2]© 2016, IRJET | Impact Factor value: 4.45 | ISO 9001:2008 Certified Journal | Page 901
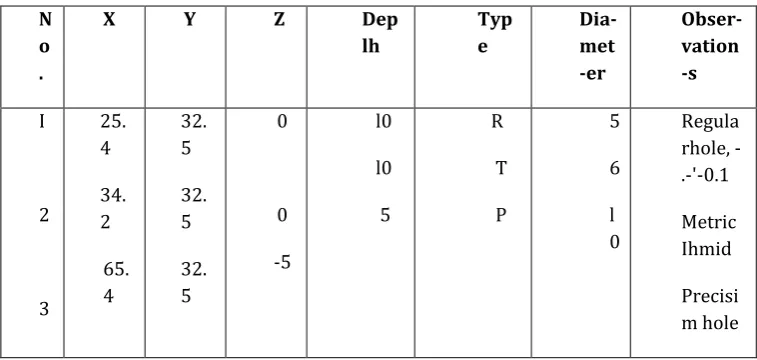
Table 6 -. hole data main fields .N o .
X Y Z Dep
lh
Typ e
Dia-met -er
Obser-vation -s
I
2
3
25. 4
34. 2
65. 4
32. 5
32. 5
32. 5
0
0
-5
l0
l0
5
R
T
P
5
6
l 0
Regula rhole, -.-'-0.1
Metric Ihmid
Precisi m hole
The notations used in Table 6 are explained below:
X. Y — plane coordinates of the hole:
0 Z — the altitude of the upper limit ofthe hole. The reference coordinate system is assumed to have the origin at the top of
the work piece. making the Z coordinate zero or negative. In practice. in order to avoid user input errors Z is treated as a positive parameter. the sign being resolved in the postprocessing phase; Depth — actual depth
of hole (starting from Z); Type — type of hole. belonging to one ofthe categories defined. In the example above: R — regtlar hole. with no specific exigences: T — thredead hole: P — precision hole. finished with a reamer.
Hole information represents the initial data of the process. Starting from it. the programmer technologist. Assisted by the program. needs to group the hole drilling operations in sets of identical properties. Each hole in a set is processes by the same tool in a single step.
5.Sets data
We define a set as the collection of holes that can be processed with the same tool and the same milling parameters. As a consequence each set has a specific tool attached: drill. tap. reamer. Starting from initial data. The CNC‘ programmer prepares the sets to be processed in chronological order. in accordance with the designed
‘a technological operations. This activity is aided by the program. The application proposes the sets of holes based on the rules governing the categories to which each hole belongs but the user has full control over the set-up and can edit it in any way as long as the final result is in accordance with the rules.
The first set is always dedicated to the centering operation (perfomied with a dedicated tool - the center drill) and is composed of all the holes in the job. This is due to the fact that all other operations have a mandatory precedence rule on the centering operation. The configuration of the next sets depends on the chosen technology, according to the initial data specified for the holes: type of hole (regular, precision, thread, etc.), diameter, etc.
© 2016, IRJET | Impact Factor value: 4.45 | ISO 9001:2008 Certified Journal | Page 902
Table 7 - Sets main data fields.5.1.Application GSG-01
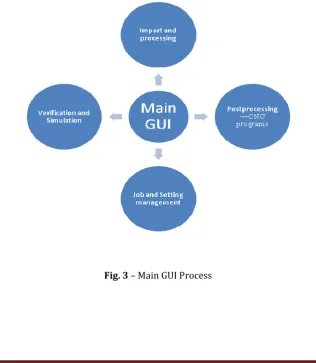
The methodology proposed here and described above is currently being implemented in an application called “GSG-01”. The application was designed with a full OOP approach and is developed using Visual Basic .NET [9]. The application is intended to assist the technologist in creating programs for the machining of drill holes in a timely and safely manner. The streamlined user interface and power of the underlying system and data model make the job of the engineer much easier, allowing fast creation of error-free CNC programs.
Fig. 3 – Main GUI Process
No. Category G-code Tool Diameter Rot. Speed Feed rate holes Observations
I Centering GSI Tl - 800 60 I-23 All holes
[image:9.595.139.456.413.777.2]© 2016, IRJET | Impact Factor value: 4.45 | ISO 9001:2008 Certified Journal | Page 903
Application Schematic Diagram
6.Results and Discussion
6.1. Material Removable Rate
In case of MRR the most significant parameter is feed which is having rank 1 in table 6 and with the analysis of S/N Ratio graphs the predicted optimal parameter setting for maximum MRR at spindle speed (A1, 200), feed (B2,1000) , depth of cut (C1, 0.01) and width of cut (D1,0.1). According to this procedures’ optimal parameter sets confirmation test is done and found MRR is (0.98g/min). Which shows the successful implementation of taguchi methodology in CNC drilling machine.
6.2. Surface Roughness
In case of SR the most significant parameter is spindle speed which is having rank 1 in table 8 and with the analysis of S/N Ratio graphs the predicted optimal parameter setting for minimum SR at spindle speed (A3, 2000), feed (B3,2000) and depth of cut (C1,0.01) and width of cut (D2,0.2). According to this procedures’ optimal parameter sets confirmation test is done and found SR is (3.05Ra). Which shows the successful implementation of taguchi methodology in CNC drilling machine.
7.Conclusion
This paper has discussed the feasibility of machining Mild Steel by (‘NC finishing machine With a HSS Tool. The signal to noise ratio has been used to determine the main effects significant factors and optimtun machining condition to the perfonnance of finishing operation in mild steel based on the results presented here in. We can conclude that, the Spindle Speed of finishing machine Tool mainly affects the SR. The Feed Rate largely affects the MRR
Acknowledgement
We thanks to Our M.D. (Mr. Shashank Aggrawal) for give the permission for Research work at Speedcrafts pvt.ltd. Hardwar. We also thanks to Mr. V.D.Arya (Company Consultant) for supporting during the experimental work.
References
[1] Ghani, J.A., Choudhury, I.A., Hasan, H.H. Application of Taguchi Method in Optimization of End Milling Parameters, Journal of Materials Processing Technology (2004) 145: 84–92.
[2] Zhang, J.Z., Chen, J.C., Kirby, E.D. (2007). Surface roughness optimization in an end milling operation using the Taguchi design method. Journal of Materials Processing Technology, vol. 184, no. 1-3, p. 233-239,
DOI:10.1016/j.jmatprotec.2006.11.029
[3] Ross PJ, Taguchi techniques for quality engineering, (McGraw-Hill International Editions, Singapore, 1996)
[4] Ghani. J .A.. Choudhury. I.A.. Hasan. H.H. Application of Taguchi Method in Optimization of End Milling Parameters. Journal of Materials Processing Technology (2004) 145: 84-92.
[5] Yang. J.L.. Chen. J .C‘ . (2001). A systematic approach for identifying optimum surface roughness perfonnance in end-milling operations. Journal of Industrial Technology. vol. 17. no. 2.p. 1-8.
[6] Zhang. J.Z.. Chen. J.C.. Kirby. E.D. (2007). Surface roughness optimization in an end milling operation using the Taguchi design method. Journal of Materials Processing Technology. vol. 184. no. 1-3. p. 233-239.