Cost Analysis of Finite Capacity M/E
K
/1 Vacation
Queueing System with Server Timeout and
N-Policy in Transient State
Dr. V. N. Rama Devi1, K Satish Kumar2, Dr. K Chandan3
1
Associate Professor, Gokaraju Rangaraju Institute of Engineering and Technology, Hyderabad, Telangana, India 2
Research Scholar, Acharya Nagarjuna University, Guntur, Andhra Pradesh, India 3
Professor, Acharya Nagarjuna University, Guntur, Andhra Pradesh, India
Abstract: This paper is to analyze the cost function of an M/EK/1 vacation queueing system with server timeout and N-Policy. We consider single server vacation queueing system that operates in the following manner; Customers are given service in ‘k’ independent and identically distributed exponential phases. When the system is empty, the server waits for fixed time C. At the expiration of this time, if no one arrives into the system then server goes for vacation. If there is at least one customer in the system, the server commences service and serves exhaustively. when the number of customers in the queue is greater than or equal to N, it goes to a startup period for pre service. Arrivals during pre-service are also allowed to enter the service zone. As soon as the startup period is over the server starts the service. Various system parameters are calculated by using Runge-Kutta method of order 4. Numerical results are also illustrated.
Keywords: Vacation queueing system, N- Policy, Server timeout and Cost function.
I. INTRODUCTION
Queueing theory is the mathematical study of waiting lines or queue. The theory enables mathematical analysis of several related processes, including arriving at the queue, waiting in the queue and being served by the server(s) at the front of the queue. The theory permits the derivation and calculation of several performance measures including the average waiting time in the queue or the system, the expected number of customers (waiting or receiving service) and the probability of encountering the system in certain states, such as empty, full, having an available server or having to wait for a certain time to be served.
In queues the situation where a server is unavailable for primary customers in occasional intervals of time is known as vacation. The vacations may represent server's working on some supplementary jobs, performing server maintenance inspection and repairs, or server's failures that interrupt the customer service.Allowing servers to take vacations (such as vacation, dormant, startup, break down etc.) makes the queue models more realistic and flexible in studying real world situations. Therefore, queues with vacations or simply called vacation models attracted great attention of queueing researchers and became an active research area.Miller[7] (1964) was the first to study a queueing system in which the server becomes idle and is unavailable during some random length of time for the M/G/1 queueing system. J.R. Murray and W.D. Kelton[5] (1988) were derived transition probabilities for the transient, discrete time M/Ek/2 queueing system. Levy and Yechiali[6] (1975) also studied Queueing models of similar nature which include several
types of generalizations of the classical M/G/1 queueing system.
The two fundamental models of vacation systems are the exhaustive and the gated vacation systems. The exhaustive vacation system is that where customers are continuously served until the system becomes empty, while in the gated vacation system, the customers waiting at the end of a vacation are only served continuously and the customers arriving to the system during a service period will be served in the next service period. A wide class of policies for governing the vacation mechanism have been discussed in the literature viz. single vacation policy, multiple vacation policy, N-policy, (M,N)-policy, T-policy, (N, T)-policy, min (N,T)-policy, D-policy, (p,T)-policy, Q-policy etc.
N-policy: Under the N-policy vacation models, the server leaves the service channel when it becomes empty and returns when the queue length reaches to a desired level N (≥ 1) and begins service with startup or without startup time. The concept of N-policy was first introduced by Yadin and Naor[11] (1963). Levy, Heyman [3] (1976) etc.. have studied the so called N-policy.
Vacation queueing systems with server timeout are studied by some of authors. Oliver C.Ibe [8] discussed an M/ G/1 vacation queueing system with server timeout. E. Ramesh Kumar and Y. Praby Loit [10] studied Vacation Bulk Queueing Model with setup time and server timeout.
In many applications one has to find transient solutions in Queueing systems. Transient analysis is dependent on time, it uses different analysis algorithms, control options with different convergence related issues and different initialization parameters. A time-dependent solution for the number in a single-server queueing system with Poisson arrivals and exponential service times is derived in a direct way by P. R. Parthasarathy[9].. Jacob. M. J. and Madhusoodanan. T.P[4] (1988) examined the transient behavior of the infinite capacity M/G/1 model with batch arrivals and server vacations. Dong-Yuh Yang and Ying-Yi Wu (2014) [2] presented Transient Behavior Analysis of a Finite Capacity Queue with Working Breakdowns and Server Vacations.
However, to the best of our knowledge, for M/Ek/1 queueing systems with N-Policy, server timeout, there is no literature which
takes time dependent probabilities and cost function into consideration. This motivates us to present cost analysis of a M/Ek/1
system with N-policy, server start-up and Timeouts in Transient State. Thus, in this present paper, we consider Cost analysis of M/EK/1 queueing system with server Start-up, N-Policy and server timeouts in Transient mode.
The main objective of this paper is to analyze Cost function of M/Ek/1 vacation queueing system with server timeout and N-Policy
of finite capacity .Various system parameters are calculated by using Runge-Kutta method of order 4. Further Numerical results are also illustrated.
This paper is organized in V sections. Section II describes the mathematical model and includes the set of governing differential equations of the model. In Section III, some performance measures are provided using the solution of the system of differential equations. Numerical results are given in Section IV. Section V concludes the paper.
The main objectives of the analysis carried out in this paper for the Cost control policy are:
To establish the Transient state equations and obtain the Transient state probability distribution of the number of customers in the system in each state.
To derive values for the expected number of customers in the system when the server is in vacation, in startup, in timeout modeand in service respectively.
To formulate the total expected cost functions for the system and determine its value.
To carry out sensitivity analysis on the System performance measures and the expected cost for various system parameters through numerical experiments.
II. THE SYSTEM AND ASSUMPTIONS
We consider the M/Ek/1 queueing system with N-policy and server Timeout inTransient state with the following assumptions: Customers are assumed to arrive according to Poisson process with mean arrival rate λ
Customers will get the service in the order in which they arrive.
Customers are given service in k independent and identically distributed exponential phases each with mean1/k .
Whenever the system becomes empty, the server goes on timeout for a period C,after that if atleast one customer arrives, he esumes service otherwise he goes for Vacation.
As soon as the total number of arrivals in the queue reaches or exceeds the pre-determined threshold N, the server is turned on and is temporarily unavailable for the waiting customers. The server needs a startup time which follows an exponential distribution with
mean 1/θ. As soon as the server finishes startup, it starts serving the waiting customers.
A. Notations
,( ) = The probability that there are i customers in the system when the server is on vacation, where i = 0,1K,2K,3,…,(N-1)K.
,( ) = The probability that there are i customers in the system when the server is doing pre-service (startup work), where i = NK,(N+1)K,(N+2)K,… ,SK.
, (t) = The probability that there are 0 customers in the system when the server takes timeout.
,( )= The probability that there are i customers in system when the server is working wherei = 1K,2K,3K,… ,SK.
The Transient state equations governing the system size probabilities at any arbitrary point of time are given by the following Differential Equations:
, ,( )=
, ( )− , ( ) (1)
, ( )
= , ( )− ,( ); 1 ≤ ≤( −1) K(2)
, ( )
= , ( )−( + ) , ( ) (3)
,( )
= , ( )−( + ) ,( ); ( + 1) ≤ ≤( −1) (4)
, ( )
= ,( ) ( )−( ) ,( ) ( ) (5)
, ( )
=µ , ( )−( + ) , ( ) (6)
, ( )
= , ( ) +µ , ( )−( +µ ) , ( ) (7)
,( )
= , ( ) +µ , ( )−( +µ ) ,( ); 2 ≤ ≤( −1) (8)
,( )=
, ( ) +µ , ( ) + ,( )−( +µ ) ,( ); ≤ ≤( −1) (9)
Service
System
If the system is
empty
Waiting for fixed time
C
At the expiration of C,if
no customer arrives
Vacation
Startup
Arrivals
Departures, ( )
= ,( ) ( ) + , ( )−( +µ ) , ( ) (10)
III. PERFORMANCE MEASURES
Some performance measures are calculated to predict the system behavior using the probabilities obtained through Runge-Kutta method:
A. Probability of the server being Idle at time t=I(t)= ∑ ,( )
( )
+∑ ,( )
B. Probability of the server being timeout at time t=T(t)= , ( ) C. Probability of the server being busy at time t=B(t)=∑ ,( )
D. L(t)=Expected length of customers in the system at time(t)=∑ ∗
E. Waiting time in the system=W(t)= ( ) ( ∗(1−
. ( ))
IV. COST FUNCTION
Let T (N) be the average cost per unit of time, then
( ) = ( ) = ℎ∗ ℎ + ∗ ( ) + ∗ ( ) + ∗ ( ) +
∗ ∗ , − ∗( , )
Where
ℎ= Holding cost per unit time for each customer present in the system, = Cost per unit time for keeping the server on and in operation,
= Startup cost per unit time, = Setup cost per cycle,
= Timeout cost per unit time for the unavailable server,
= Reward per unit time as the server is doing secondary work in vacation.
V. NUMERICAL RESULTS
The obtained results are numerically evaluated based on specific parameters. The effect of various parameter son the system performance measures such as expected number of customers in the system and mean waiting time in the system are studied and also the corresponding cost function is analyzed. MATLAB software is used to develop the computational program. The effect of different parameters in the system on performance measures is summarized in Tables 1-4.
In all numerical computations, the model parameters are taken as N = 4, S=6, λ =0.4, μ =0.6, θ = 1 , K=2,C=.2,T=2 and h=0.5 .
Costs are assumed as h = 5, = 50, = 200, = 1000, t = 2, =15
From Tables 1-4, it leads to the following observations:
With regard to the measure L(t) for a particular value of t , we observe
increasing trend as λ increases, C increases and a decreasing trend with the increase of μ and θ
regard to the measure W(t) for a particular value of t, we observe
increasing trend as λ increases andC increases a decreasing trend with the increase ofθ and μ
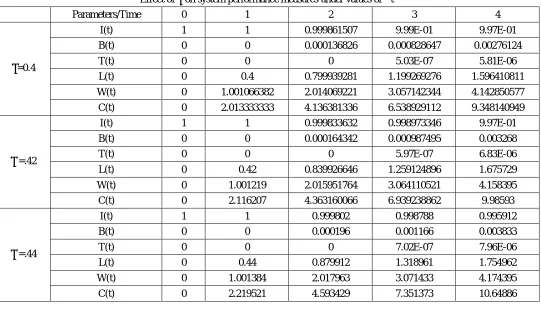
With regard to the measure C(t) for a particular value of t , we observe
an increasing trend as λ increases and a decreasing trend with the increase of μ, θ and C.
VI. CONCLUSIONS AND FURTHER SCOPE OF STUDY
Cost analysis of M/Ek/1 queueing system with server Start-up and server time-out of finite capacity in transient state is presented.
Sensitivity analysis is also performed to know the influence of non monetary parameters on system performance measures.
REFERENCES
[1] Baker, K. R. (1973). A note on operating policies for the queue M/M/1 with exponential start-up. INFOR, 11, 71–72.
[2] Dong-Yuh Yang and Ying-Yi Wu (2014). Transient Behavior Analysis of a Finite Capacity Queue with Working Breakdowns and Server Vacations, Proceedings of the International Multi Conference of Engineers and Computer Scientists 2014, Vol II, March 12 - 14, 2014, Hong Kong.
[4] Jacob, M.J. and Madhusoodanan, T.P. (1988). Transient solution of an M/G/1 queueing system with group arrivals and vacations tothe server. OPSEARCH, 25(4), 279-284
[5] J.R. Murray, W.D. Kelton (1988): The transient behaviour of the M /E k/2 queue and steady-state simulation, Comput. Opns. Res., 15, N 4, 357-367 [6] Levy, Y. and Yechiali, U. (1975). Utilization of idle time in an M/G/1 queueing system
[7] Miller, L.W. (1964). Alternating priorities in multi-class queue. Ph. D. Dissertation, Cornell University, Ithaca, New York. [8] Oliver C. Ibe(2015). “M/G/1 Vacation Queueing Systems with Server Timeout, American Journal”, 5:77-88
[9] P. R. Parthasarathy, (1987). ” A Transient Solution of an M/M/1 Queue: A simple Approach”, Adv. Appl. Prob. 19, 997-998.
[10] Ramesh Kumar E, PrabyLoit Y. (2016), “A Study on Vacation Bulk Queueing Model with setup time and server timeout”. IJCMS; 5(12):81-89. [11] Yadin, M. and Naor, P. (1963). Queueing Systems with a removable service station. Operational Research Quarterly, 14, 4, 393 –405.
[image:6.612.38.579.232.543.2]APPENDIX Table 1
Effect of λ on system performance measures under values of ‘t’
Parameters/Time 0 1 2 3 4
λ=0.4
I(t) 1 1 0.999861507 9.99E-01 9.97E-01
B(t) 0 0 0.000136826 0.000828647 0.00276124
T(t) 0 0 0 5.03E-07 5.81E-06
L(t) 0 0.4 0.799939281 1.199269276 1.596410811
W(t) 0 1.001066382 2.014069221 3.057142344 4.142850577
C(t) 0 2.013333333 4.136381336 6.538929112 9.348140949
λ =.42
I(t) 1 1 0.999833632 0.998973346 9.97E-01
B(t) 0 0 0.000164342 0.000987495 0.003268
T(t) 0 0 0 5.97E-07 6.83E-06
L(t) 0 0.42 0.839926646 1.259124896 1.675729
W(t) 0 1.001219 2.015951764 3.064110521 4.158395
C(t) 0 2.116207 4.363160066 6.939238862 9.98593
λ =.44
I(t) 1 1 0.999802 0.998788 0.995912
B(t) 0 0 0.000196 0.001166 0.003833
T(t) 0 0 0 7.02E-07 7.96E-06
L(t) 0 0.44 0.879912 1.318961 1.754962
W(t) 0 1.001384 2.017963 3.071433 4.174395
C(t) 0 2.219521 4.593429 7.351373 10.64886
Table 2
Effect of µ on system performance measures under values of ‘t’
Parameters/Time 0 1 2 3 4
µ =0.6
I(t) 1 1 0.999862 0.999139 0.997055
B(t) 0 0 0.000137 0.000829 0.002761
T(t) 0 0 0 5.03E-07 5.81E-06
L(t) 0 0.4 0.799939 1.199269 1.596411
W(t) 0 1.001066 2.014069 3.057142 4.142851
C(t) 0 2.013333 4.136381 6.538929 9.348141
µ =.62
I(t) 1 1 0.999862 0.999139 0.997055
B(t) 0 0 0.000137 0.000828 0.002755
[image:6.612.40.582.571.729.2]L(t) 0 0.4 0.799937 1.199247 1.596303
W(t) 0 1.001066 2.014064 3.057086 4.142582
C(t) 0 2.013333 4.136369 6.538763 9.347304
µ =.64
I(t) 1 1 0.999862 0.999139 0.997055
B(t) 0 0 0.000137 0.000827 0.002749
T(t) 0 0 0 6.26E-07 7.16E-06
L(t) 0 0.4 0.799935 1.199224 1.596196
W(t) 0 1.001066 2.014059 3.057029 4.142314
C(t) 0 2.013333 4.136356 6.538597 9.346471
Table3
Effect of c on system performance measures under values of ‘t’
Parameters/Time 0 1 2 3 4
C=0.2
I(t) 1 1 0.999862 0.999139 0.997055
B(t) 0 0 0.000137 0.000829 0.002761
T(t) 0 0 0 5.03E-07 5.81E-06
L(t) 0 0.4 0.799939 1.199269 1.596411
W(t) 0 1.001066 2.014069 3.057142 4.142851
C(t) 0 2.013333 4.136381 6.538929 9.348141
C=.3
I(t) 1 1 0.999862 0.999139 0.997055
B(t) 0 0 0.000137 0.000829 0.002761
T(t) 0 0 0 4.95E-07 5.69E-06
L(t) 0 0.4 0.799939 1.199269 1.596411
W(t) 0 1.001066 2.014069 3.057142 4.142851
C(t) 0 2.013333 4.136381 6.538929 9.348141
C=.4
I(t) 1 1 0.999862 0.999139 0.997055
B(t) 0 0 0.000137 0.000829 0.002761
T(t) 0 0 0 4.87E-07 5.58E-06
L(t) 0 0.4 0.799939 1.199269 1.596411
W(t) 0 1.001066 2.014069 3.057142 4.142851
C(t) 0 2.013333 4.136381 6.538929 9.34814
Table4
Effect of on system performance measures under values of ‘t’
Parameters/Time 0 1 2 3 4
=1
I(t) 1 1 0.999862 0.999139 0.997055
B(t) 0 0 0.000137 0.000829 0.002761
T(t) 0 0 0 5.03E-07 5.81E-06
L(t) 0 0.4 0.799939 1.199269 1.596411
W(t) 0 1.001066 2.014069 3.057142 4.142851
C(t) 0 2.013333 4.136381 6.538929 9.348141
=1.2 I(t) 1 1 0.999838 0.99901 0.996658
T(t) 0 0 0 5.90E-07 6.75E-06
L(t) 0 0.4 0.799928 1.199154 1.595895
W(t) 0 1.001066 2.014042 3.056854 4.141559
C(t) 0 2.013333 4.13283 6.518797 9.284542
=1.4
I(t) 1 1 0.999816 0.998892 0.996303
B(t) 0 0 0.000181 0.001064 0.00346
T(t) 0 0 0 6.72E-07 7.62E-06
L(t) 0 0.4 0.799918 1.199046 1.595425
W(t) 0 1.001066 2.014016 3.056585 4.140385