2018 International Conference on Applied Mechanics, Mathematics, Modeling and Simulation (AMMMS 2018) ISBN: 978-1-60595-589-6
Practical Testing Process of Phasor Data Concentrator Designed for
Distribution Network
Wei-qing TAO
1, Jia-qi SUN
1, *, Yong ZHANG
2,
Cheng FANG
2and Jing-song LIU
21
School of Electrical Engineering and Automation, Hefei University of Technology, Hefei, China 2
Electric Power Research Institute, State Grid Shanghai Municipal Electric Power Company, Shanghai, China
*Corresponding author
Keywords: Phasor data concentrator (PDC), Wide area measurement system (WAMS), Testing process, Pseudo-PMUs, Distribution network.
Abstract. Large scale use of Wide Area Measurement System (WAMS) is deployed at many transformer substations worldwide for better power system condition monitoring. In the WAMS architecture, Phasor Data Concentrators (PDCs) receive the datapackages collected by Phasor Measurement Units (PMUs) and send them to the Main Stations for centre computer to analysis. This paper introduces some industrial requirements towards PDCs according to the international standard associations (e. g. IEEE, IEC) and proposes a test for functional and performance requirements (e. g. latency calculation, data aggregation, etc) of PDCs. Catering to special of the distribution network, in the proposed testing process, the capability of the PDCs has been paid more consideration compared to substations. In addition, a software which work as Pseudo-PMUs is designed for the testing in this paper. The proposed software can simulate some error communication (e. g. datapackages lost, data redundancy, etc) for better evaluation.
Introduction
Nowadays, the focus of power system development is the building of the smart power grid[1]. Along with the application of GPS synchronization technology, data with accurate timestamp can be collection by PMUs timely. Then, the data would be send by PMUs to PDCs. Finally, the data streams from PDCs to the main stations as Fig. 1 presents. It illustrates the architecture of the WAMS which can be divided into three parts[2]. In the first part, PMUs installed at the nodes of the monitored power system measure the nodes data(e. g. phasor, analog, digital. . .) and product datapackages according to the protocols(e. g. IEC 61850, IEEE C37. 118, etc). Datapackages would received by PDC. At the second floor, datapackages from different PMU would be handled by PDC. After validation, format, coordinate conversion, aggregation, etc, PDC re-products datapackages and send them to the main stations directly. At the top, the main stations get the datapackages from PDC and analyze them to get the evaluation of the power system situation.
Presently, WAMS is widely used in substations, in spite of the many researches about optimization with the WAMS in the distribution networks have got great achievements. Considering the cost of the PMU and the capacity of the PDC, WAMS has not been well applied in the distribution network. Recently, the development of the devices micro PMU could decrease the cost of the WAMS effectively, which bring the WAMS to monitoring the distribution network[3]. Next, the research about the special PDC that fit the distribution network is on the coming way.
distribution network requires that the lager capacity of the PDC and better ability to handle the great data.
PDC is the key building block of the WAMS architecture. In order to ensure the PDC functional and performance requirement, this paper summaries the testing of PDC based on protocols(e. g. IEEE C37. 244, IEEE C37. 118, etc) and industrial experience on product design and testing. In line with the testing process proposed, a software that works as pseudo-PMUs is presented in our work, which could be used for the verification of the PDC.
PMU Substation High Speed Communication Network
PMU5
PMU4
PMU1 PMU2 PMU3
Protection Management
PMU10
PMU9
PMU6 PMU7 PMU8
Decision Online
Post-fault Analysis State
Estimation
Other Applications Parameter
Calculation
The Main Station
[image:2.595.102.492.172.393.2]PDC2 PDC1
Figure 1. Architecture of WAMS.
Requirements of the PDC in Distribution Network
In this section, the requirements for the PDC in distribution network would be investigated, and the reference [4] and reference [5] is considered in this section. Due to the changing flow, a PDC performs several functions to operate synchrophasor data streams from PMUs. The functions relay on the need of the WAMS applications in distribution network.
Data Communication
Data communication is one of the most fundamental functions of a PDC, which ensures a PDC could connect with other devices via networks. Currently, there are two different communication modes: IEEE C37. 118 based point-to-point over TCP/IP or UDP/IP(client/server mechanism)and IEC 61850 based GOOSE(publisher/subscriber mechanism).
Data Aggregation
In distribution network, for accurate evaluation of the system situation, the data collected by PMUs have to be combined with timestamps. Normally, a PDC would connect with plural PMUs synchronously. During one communication cycle, PDC may get datapackages with different timestamps, which means the datapackages are produced at different time. and the datapackages stream into PDC by different channel. Then, PDC arranges the datapackages, and sets them at different lines distinguished by timestamps.
Data Validation
After data arriving PDC, the correctness of data should be validated immediately. Two aspects of the correctness:
The correctness of the data can use integrity checks. Cyclic Redundancy Check(CRC) is applied in both IEC 61850 and IEEE C37. 118, and in IEEE C37. 244, the way to perform integrity check is not clearly defined. In order to check the correctness of the device working status. PDC should read the datapackages received, every datapackage contains the data status flags which present the availability of the data or the devices. In communication protocol GBT 26865[5], data frame has the STAT to record the flags.
Data Latency Calculation
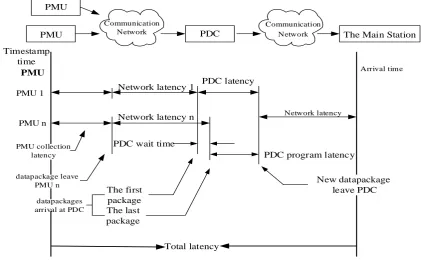
During communication, there are some discrimination between the time when datapackages were received and the timestamps records. Many factories (e. g geographical distance, routing structure, the limit of bandwidth, etc) could cause latency between sender and receiver, which means that timestamp need optimization to get more accurate time for better system monitoring. Fig. 2 shows an example how latency is caused between PMU and PDC.
PMU
PMU PDC The Main Station
Communication Network
Communication Network
PMU
Timestamp time
PMU 1
PMU n
Arrival time
Network latency 1
Network latency n
PDC wait time
Network latency
PDC program latency PMU collection
latency
datapackage leave PMU n
datapackages arrival at PDC
The first package The last package
New datapackage leave PDC
[image:3.595.90.512.263.523.2]Total latency PDC latency
Figure 2. The latency between PMU and PDC.
At first, PMU measures the synchrophasor data and make datapackages with the timestamps produced by GPS technology. the interval between the value is measured to the datapackage completes is a small latency. It can be seen as consistent. Then datapackages are sent from PMU to PDC. In this process, there is a positive correlation between latency and geographical distance. On receiving a datapackage, the PDC works to sort out the data. This operation in PDC also results in latency. In the end, PDC would create new datapackages based on the data it received before, the timestamp of new datapackages has a large difference with which created in PMU.
Well known, the distribution network situations would be quickly changeable. Low latency is necessary to the reliability of the system monitoring. And latency could also be a parameter of the device performance.
Wrong Data Handling
PDC may receive wrong data during communication. For the robustness of the monitoring system, PDC is designed to distinguish and correct wrong data from lower layer.
Lost data threats security of system directly. It influences the evaluation of monitoring system with incomplete data. Interpolation often be used to recover lost data, considering the low probability.
Fig. 1 illustrates that PDC is designed to send data to upper devices. When comes to a data-sender, PDC may have wrong transmission. In this situation, PDC should set up re-transmission in case of communication errors.
Pseudo-PMUs Software Designed for Test
In this section, a pseudo-PMUs software designed for test is proposed. This software can simulate multiple PMUs at same time, which means the better appliance in PDC testing.
Data Communication
PMUs establish connection with PDC(s), as showed in Fig. 3, and PMUs send data frames and control frames to PDC(s). The protocol GB/T26865 is adopted for the test and design. Pseudo-PMUs need to create control frame, CFG1 frame (file), data frame for PDC(s) receiving.
PDC can receive the data from the PMU and operate according the received control frame means that the PDC can take on the basis communication job. Besides of the communication, PDC should comply some other work, such as data validation, data aggregation, data latency calculation, etc.
Data Aggregation
PDC may receives many datapackages from different pseudo-PMUs with different timestamp during a communication cycle. Data aggregation will sort datapackages by timestamp. After aggregation, data would be written in PDC. PDC uses aggregated data to create new frame for main stations or other PDCs. In design, different pseudo-PMU create datapackages with different timestamp in a communication cycle, and the interval between datapackages can be set.
Data Validation
In order to find whether PDC could validate data, pseudo-PMUs need to create some error frames. Change the value of the CRC can create error frames, and change the value of status flags can virtually set the pseudo-PMU status.
The proposed software can also simulate the communication errors mentioned.
Duplicate Data
Pseudo-PMUs is designed to send duplicate data by chance. Don’t change the memory buffer and send it twice. The same timestamps present that they should be the same data. Then PDC could operate as designed.
Lost Data
Skip the sending process could cause lost data. pseudo-PMUs send data at set report rate, and the rate would change if some data lost. The absent data would influence monitoring system, and lead to mis-evaluation. The PDC need to use suitable algorithm to solve the problem.
The frequency of communication error can be changed by a parameter set in program. The proposed software could simulate kinds of communication situation between multiple PMUs and PDC.
Data Capture Tool Used in Testing Process
Data capture Tool
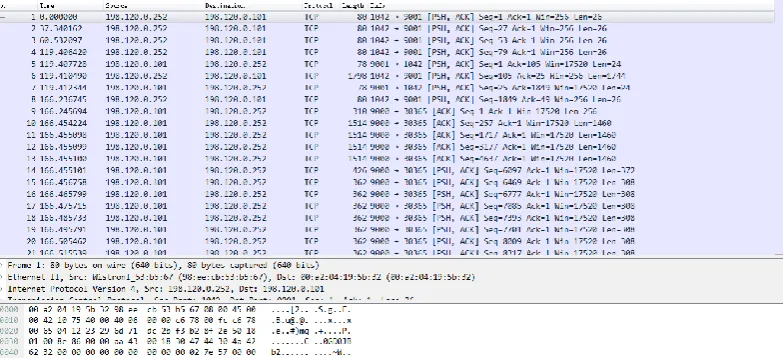
Wireshark is a network datapackages analysis software. The network packet analysis software is used to capture the network packet and display detailed network datapackages as much as possible. Wireshark uses WinPCAP as an interface to exchange data packets directly with the network card.
Wireshark can capture the datapackages transported between PMUs and PDC. And the time when datapackages is sent by PMU or received by PDC would be recorded by Wireshark, which greatly facilitates the data latency calculation.
Data Latency Calculation
There are many factors may cause data latency. Fig. 3 presents the latency assumed between PMU and PDC. There are two types of latency defined in this paper, network latency and program latency.
Network Latency
This latency is caused by transmission. The medium, geographic distance and network routing (if wireless technology or some special communication technology is used).
Program Latency
Fig. 3 shows that PMU need time to create and report datapackages, PDC need time to receive and process datapackages. They both cause data latency.
[image:5.595.103.495.382.561.2]With the help of Wireshark, the time when datapackages leave the PMU and when datapackages arrival at PDC can be recorded. Then compare them to the timestamp. The results can be used to test data latency calculation of PDC.
Figure 3. Wireshark capture datapackages.
Conclusion
This paper presents a testing process based on protocols and experience on industrial production of distribution network PDC. And a pseudo-PMUs software is proposed to verify the requirements between PMUs and PDC. By the help of data capture tool Wireshark, the datapackages transported between PMUs and PDC can be analyzed. Data aggregation, data communication, data validation, data latency calculation and and transfer protocol(GB/T26865)support are discussed in paper. And the test result is illustrated in detail, which presents that the designed software can be used for PDC testing process well.
Acknowledgment
References
[1]Gang, Duan, et al. "Development Status Quo and Tendency of Wide Area Phasor Measuring Technology." Automation of Electric Power Systems (2015).
[2]Kanabar, M., M. G. Adamiak, and J. Rodrigues. "Optimizing Wide Area Measurement System architectures with advancements in Phasor Data Concentrators (PDCs)." Power & Energy Society General Meeting IEEE, 2013.
[3]Jiang, L. I., et al. "Research and development of micro PMU and fault wave recording device for distribution network." Electric Power Automation Equipment (2016).
[4]Renal, Govind, M. Kanabar, and V. Muthukrishnan. "Practical aspects of testing Phasor Data Concentrators for wide area monitoring systems." Electrical & Computer Engineering IEEE, 2014.
[5]IEEE Guide for Phasor Data Concentrator Requirements for Power System Protection, Control, and Monitoring." IEEE Std C IEEE, 2013.
[6]GB/T26865. 2-2011 Real—time dynamic monitoring systems of power system—Part 2: Protocols for data transferring. 2011.