2019 International Conference on Computation and Information Sciences (ICCIS 2019) ISBN: 978-1-60595-644-2
Design of Real-time Data Access Scheme
Based on Microservice Grid Operation
Wei Guo, Rong Chang and Bangyuan Li
ABSTRACT
Real-time data of power grid operation has become important assets for the development of electric power enterprises, but there is a lack of efficient technical means to access real-time data. Considering the principles of loosely coupled, repeatable, standardized, microservice architecture design, this paper realizes the access scheme design of real-time data for power grid operation based on Microservice Architecture. This scheme unifies the real-time data of different service systems in power gird filed through the designed data access tools, orderly integration in the form of measuring points. At the same time, the efficient integration and access of real-time data of power grid can be realized by establishing power grid asset model. The design can better meet the needs of vertical and horizontal interaction of real-time data in power enterprises.
1. INTRODUCTION
In recent years, with the vigorous development of power information construction, the scale of information systems of electric power enterprises has been expanding, and different business departments have displayed diverse information application systems. These systems have a wide range of data storage and access methods, marking that power grid enterprises have gradually entered the stage of data-centric and digital enterprise construction. Enterprise management is gradually changing from “business-driven” to “data-driven”, which requires efficient sharing
and interaction of various kinds of massive data in different business systems of power grid system, transforming data into core assets and fully exploiting the value of data assets. How to better realize the vertical and horizontal interaction of data resources among various business systems in the power grid, and put the development of "data-driven" power grid enterprises into practice has become the main content of the in-depth development of power enterprise informatization work. [1]
Achieving stable and efficient access to real-time data on power grid becomes a key step in fully tapping the value of data assets. Due to the different purposes and manufacturers of business systems in different business areas and the ways and frequencies of providing data are also different. For example, the dispatch automation system provides data every five minutes in the form of E files, while metering automation system provides data every fifteen minutes through Web Service, etc. Due to the difference in the way and frequency of data provided by different service systems, this paper designs a real-time data access scheme for multi-source heterogeneous massive power grid operation. This design uses micro-service architecture to support automatic access of real-time data generated by multi-service systems in different ways and frequencies. At the same time, effectively split the data access applications of each business system, achieving agile development and deployment. The design supports flexible expansion to meet more forms of access requirements for more business systems in the future.
2. KEY TECHNOLOGY
2.1 Microservice Architecture
The microservice architecture [2] is a way to develop a single application as a set of small services, each application runs in its own process and communicate with lightweight mechanism (usually APIs for HTTP resources). These services are built around business functions and can be deployed independently through a fully automated deployment mechanism. The centralized management of these services is already minimal, they can be written in different programming languages and use different data storage technologies.
Such a holistic service is a natural way to build a system. All the logic for processing requests runs in one process. Individual applications can be successful, but more and more people are disappointed, especially as more applications are deployed to the cloud. The change cycle is tied together, and changes to a small portion of the application require rebuilding and deploying the entire program. Over time, it is often difficult to maintain a good modular structure, making it difficult to maintain a change within the module that only affects the module itself. Adaptation requires adapting the entire application, not part of it, and more resources will be required.
These frustrations lead to a microservice architecture style: building applications as service suites. There are four differences between microservices and monolithic services: Firstly, the service splitting is finer in granularity. Microservice can be said to be a more detailed dimension of service, as small as a sub-module, as long as the resources that the module relies on are not related to other modules, then it can be divided into a microservice. Secondly, the service is deployed independently. Each microservice strictly follows the principle of independent packaging deployment and does not affect each other. For example, multiple Docker [3] instances can be deployed on a single physical machine, and each Docker instance can deploy code for a microservice. Thirdly, the service is maintained independently. Each microservice can be developed, tested, released, and maintained by a small team or even individuals, and is responsible for the entire lifecycle. Fourthly, service management capabilities are high. Because the number of services increases after being split into micro-services, a unified service management platform is needed to manage each service.
In view of the different real-time data access modes and frequencies for the operation of information business systems in power grid enterprises, the data access scheme design in this paper is mainly guided by the architecture of micro-services, and the data access of different service systems is designed as mutual. The microservice components that are not affected, each separated service is packaged and deployed independently.
2.2 Modeling Synchronization and Modeling Tree Establishment of Power Grid
up the initial grid model tree. Due to the complexity and updating power grid equipment, the data related to power grid model are also updated constantly, so it is necessary to synchronize the data of power grid model in real time. Firstly, the updated model data needs to be subscribed to the enterprise service bus, Secondly the bus sends the data items subscribed by the client to the data resource management platform, and the data resource management platform queries the subscription data item and forms the updated model data pushes it to the bus. The bus then distributes the updated model data, and the consumer receives the updated grid model data from the bus and returns to the data reception state. Finally, the consumer updates the local copy of the grid model data according to the data content to achieve synchronization with the model of the resource management platform.
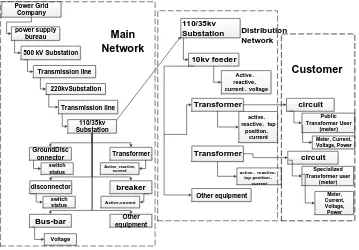
Based on the above-mentioned grid model synchronization process, through the unified combing of the grid model and equipment matching, such as circuit breakers, isolation knife gates, busbars, transformers, substations and other equipment, the main network model is established and the model is realized by the substation name in the 110/35kv substation. The connection is completed, and the main network and the distribution network model are spliced and extended to the measurement end to form a standard model tree of the power grid, which is easy for data access storage and data access and analysis of the business department. The grid model is shown in Figure 1:
Power Grid Company
power supply bureau
500 kV Substation
Transmission line 220kvSubstation Transmission line 110/35kv Substation GroundDisc onnector Transformer disconnector breaker
Bus-bar equipmentOther
switch status Active, reactive, current switch status Active,current Voltage Main Network 110/35kv Substation 10kv feeder Transformer Transformer Other equipment Active、 reactive、
current、voltage
active、
reactive、tap position、
current
active、reactive、
tap position、
[image:4.612.127.486.402.652.2]current Distribution Network circuit Public Transformer User (meter) Meter, Current, Voltage, Power circuit Specialized Transformer user (meter) Meter, Current, Voltage, Power Customer
2.3 Data Storage Method
In power grid system, the model file is accessed by external systems in the form of an xml file. The model data is relational structured data, which needs to be parsed and stored in MySQL [5] database in the form of original tables. MySQL is one of the most popular relational database management systems. In terms of WEB applications, MySQL is the best RDBMS (Relational Database Management System) application.
The operation of the grid system will generate a large amount of measurement data. One device has multiple measurement types, which will generate multiple measurement points, and each measurement point will generate operation data at a frequency of one value every 5 minutes. The measured data forms a file with a section of 5 minutes. HBase [6] is based on the Google Bitable model, a typical key/value system; HBase is an important member of the Apache Hadoop ecosystem, mainly used for massive real-time data storage. Logically, HBase uses data according to tables, Rows and columns are stored.
Design HBase data storage according to the following specifications:
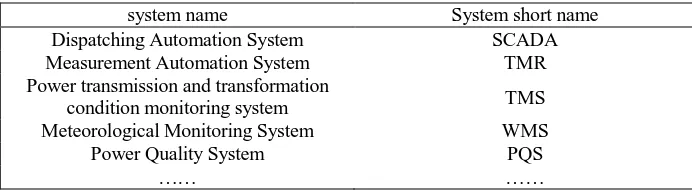
[image:5.612.129.475.417.512.2]1) The namespace is in English abbreviations, and the commonly used system English names are shown in Table I:
TABLE I. COMMONLY USED SYSTEM ENGLISH ABBREVIATION.
system name System short name
Dispatching Automation System SCADA
Measurement Automation System TMR
Power transmission and transformation
condition monitoring system TMS
Meteorological Monitoring System WMS
Power Quality System PQS
…… ……
2) The naming standard of the table is "System Name City Pinyin Alphabet Abbreviation Equipment Type Time Year of Data Ownership";
3) Line key specification: "Provincial company name abbreviation. City company name abbreviation. Collection time. Equipment type";
4) Column Cluster Specification: Only one column cluster is designed with the name "DATA";
5) Column name: Column name is device code.
Figure 2. Structure Design of HBase Table.
3. ACCESS SCHEME DESIGN
3.1 Overall Architecture Design
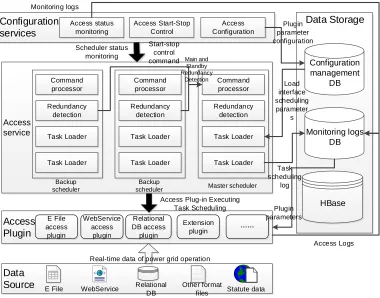
Considering the characteristics of high frequency, real-time and multi-source heterogeneity of real-time data access in power grid operation, the architecture of real-time data access scheme for power grid operation is shown in Figure. 3.
Monitoring logs Data Storage Configuration services Access status monitoring Access Configuration Access Start-Stop Control Access service Command processor Redundancy detection Task Loader Task Loader Command processor Redundancy detection Task Loader Task Loader Command processor Redundancy detection Task Loader Task Loader Backup scheduler Backup
scheduler Master scheduler
Access Plugin Data Source E File access plugin WebService access plugin Relational DB access plugin Extension plugin
E File WebService Relational DB
Other format
files Statute data
HBase
Real-time data of power grid operation Access Plug-in Executing
Task Scheduling Start-stop
control command Main and
Standby Redundancy Detection Plugin parameter configuration Load interface scheduling parameter s Scheduler status monitoring Task scheduling log Configuration management DB Monitoring logs DB Plugin parameters Access Logs
[image:6.612.117.497.355.653.2]The access scheme architecture consists of five parts: configuration service, access service, access plug-in, data storage and data source. The core module is three parts: configuration service, access service and access plug-in.
The configuration service includes three sub-modules: access status monitoring, access start-stop control, and access configuration. The access configuration module is configured to configure parameters such as an access task scheduling parameter, a data parsing rule, a measuring point, and a measuring point value creation rule. Access start/stop control module controls the access task to start and stop by sending a command to the access service. Access status monitoring is used to monitor the running status of the access service.
The access service is responsible for loading tasks and scheduling access tasks according to task scheduling parameters. The access service mainly includes four sub-modules: command processor, redundancy detection, task loader and task scheduler:
(1) The command processor is used to receive the start-stop control command and heartbeat detection between the main and standby schedulers. The start-stop control command can control the start and stop of access tasks. The heartbeat detection is used to detect the running status of the main scheduler.
(2) The redundancy detection module is the core of the scheduler's active and standby redundancy. Multiple access schedulers can be deployed, but only one is the master scheduler. The standby scheduler detects the running status of the main scheduler in real time through the redundancy detection module. Once the failure of the main scheduler is detected, the position of the main scheduler is immediately occupied to receive the processing command, the synchronization task configuration, and the scheduling execution task. The master scheduler becomes the standby scheduler.
(3) The task loader is responsible for loading the access task configuration, and simultaneously updating the loaded task configuration and state at the same time to ensure the accuracy and consistency of the task scheduling execution. (4) The task scheduler executes the access plug-in according to the task configuration timing schedule and records information such as plug-in execution time and execution status. The access plug-in is responsible for parsing data according to the data parsing rules, creating a measuring point according to the measuring point and the measuring point value, and parsing the data into the measuring point value into the corresponding measuring point.
3.2 Access Task Configuration
and the corresponding parameters and rules. Taking E file access as an example to describe the configuration process of the E file access task.
The E file name must have the following convention: province code + "_" + sub-control area code + "_" + data source + "_" + section time (format: YYYYMMDD_HH24MISS) + "." + file type suffix. Take the E file of the SCADA system of Kunming City, Yunnan Province on May 1, 2019 at 3:5:7 pm, for
example, its file name:YN_KM_SCADA_20190501_150507.DT.
Based on the above E file naming convention, the general E file access task configuration process is as follows:
1) Create an access task, assign a task number to the system, configure basic attributes such as task name, description, and task type, and set task scheduling parameters such as start time, task execution cycle, and delay execution time;
2) Configure the E-file acquisition rules, including the server address where the file is located, the file storage path, and the access rights of the user name and password of the access file;
3) Configure file parsing rules, including the suffix of the E file, the content tag contained in the file, the separator between the attributes in the tag, and the number of separators;
4) Configure the measurement point row key creation rule, configure the construction rule of the store name according to the naming convention of the measurement point. The general province code, the sub-control area code and the data source code are obtained from the file name, the data source internal code association device ID attribute, the measurement type code is the English abbreviation of the measurement type, and then the measurement points are described to describe the attributes such as the construction rule and the measurement point data source;
5) Configure the rule of the cluster value cluster creation. The timestamp is obtained from the file name, the value is associated with the corresponding measurement attribute, and the quality code is associated with the corresponding measurement value status attribute. If there is no such attribute, the quality code can be set defaults;
6) Finally, select the E file access plugin as the task association plugin. The plugin completes the parsing of the E file, the creation of the measurement point, and the insertion of the value according to the configured file parsing rules, the point creation rule, and the point value rule.
3.3 Data Access Process
1) Starting the access scheduler, and the task loader loads the access task list and the scheduling parameters of the task;
2) The task scheduler checks the task scheduling parameters during the start cycle. When it finds that a task meets the execution conditions, it immediately starts the process and executes the related task association plug-ins;
3) The plug-in accesses the data to be accessed according to the configured data access parameters;
4) The plug-in parses the data according to the data parsing rules, continuously constructs the name of the measuring point according to the rule of creation of the measuring point, and checks whether the measuring point has been accessed. If it has been accessed, it writes real-time data according to the rule of the measuring point value; if it has not been accessed, it first creates the measurement point and then write real-time data;
5) After the plug-in completes the data parsing, the task scheduler releases the created process resource, and the access task ends this time.
4. ENGINEERING PRACTICE
The results of this paper have been applied in the large-scale quasi-real-time data service platform project of China Southern Power Grid Corporation [9]. This massive platform is deployed in the headquarters of the power grid company and Guangdong Province Company. The massive platform of the provincial company forms of network, provincial synchronization, provincial and general level through the real-time data service bus. The provincial and headquarters massive platforms provide external data access, query and other services through the Enterprise Service Bus. The platform mainly integrates equipment online monitoring system, energy management system, distribution network automation system, metrology automation system and production area dispatching system in asset management information area, and provides data access and data analysis support for marketing management system, data center and power demand side [10].
5. CONCLUSIONS
REFERENCES
1. Junjie Shi, Yisong Li, Qingqing Peng, etc. 2006. “State grid scheduling system overall scheme for data integration thinking,” Electric power information and communication technology, 6: 28-31.
2. Zhengxiong Mao, Zhenqian Yang, Yongjun Xue. 2017. “Construction of real-time communication service architecture for power companies based on microservices,” Electronic Technology and Software Engineering, 16: 31-33.
3. Shifeng Zhang, Shanliang Pan. 2019. “Application of Docker Technology in Microservices,” Electronic Technology and Software Engineering, 150(4):180.
4. Feng Qian, Guoqing Tang, Quan Gu. 2007. “Integration Analysis of Multi-level Power System Model Based on CIM Standard,” Power System Technology, 31(12): 69-73.
5. Wen Hu, Yan Li. 2012. “Analysis of MySQL Database Storage Engine,” Software Guide, 11(12): 129-131.
6. Lifan Li. 2016. “Research on HBase Cloud Storage of Railway Power Monitoring Information Based on Configuration Components,” East China Jiaotong University.
7. Kejia Pan, Xin Wang, Fan Yang, et al. 2017. “Research on Multi-source Heterogeneous Data Fusion Technology for Power Big Data,” Machinery & Electronics, 35(9): 7-11.
8. Lijuan Chen, Xiaoyan Zhu, Junfeng Zhao, et al. 2010. “Overview of real-time data integration applications in domestic power grids,” Electric Power Automation Equipment, 30(1):139-144. 9. Hedong Wang, Jinfeng Yang, et al. 2014. “Distributed Parallel Processing of Massive Data in
Provincial Energy Metering Automation System,” Guangdong Electric Power, 27(4):82-85. 10. Jinzhang Cao, Yang Wang, Chengzhi Zhu, Yang Zhang et al. 2012. “Information Model and