Journal of Criminal Law and Criminology
Volume 64 | Issue 1
Article 7
1973
Self-Reports of Deviant Behavior: Predictive and
Stable
David P. Farrington
Follow this and additional works at:
https://scholarlycommons.law.northwestern.edu/jclc
Part of the
Criminal Law Commons,
Criminology Commons, and the
Criminology and Criminal
Justice Commons
This Criminology is brought to you for free and open access by Northwestern University School of Law Scholarly Commons. It has been accepted for inclusion in Journal of Criminal Law and Criminology by an authorized editor of Northwestern University School of Law Scholarly Commons.
Recommended Citation
Copyright 0 1973 by Northwestern University School of Ldw
SELF-REPORTS OF DEVIANT BEHAVIOR: PREDICTIVE AND STABLE?
DAVID P. FARRINGTON*
INTRODUCTION
The key dependent variable in criminology is deviant behavior. in the past, this has often been defined according to the criminal law and measured using the official statistics of crime. However, it is now generally believed that official records do not provide an accurate measure of deviant behavior. Criticisms of official statistics have stimulated the development of alternative methods of measuring deviant behavior, and one of the most popular of these is the self-report questionnaire. The use of such questionnaires has increased dramatically in the last decade, but their technical development, as measured by the usual psychometric criteria, seems to have stagnated since the pioneering work of Nye and Short.'
Ideally, what is needed is a standard question-naire with a routine procedure for administration, objective scoring, norms for various populations, details of internal consistency, retest stability and concurrent and predictive validity. Without such a technically advanced questionnaire, it is im-possible to be sure that this method of measuring deviant behavior is superior to the official records. It is illuminating to review the progress which has so far been made towards the psychometric ideal.2
Questionnaire Construction
It has been argued that each questionnaire contains a sample from a population (f deviant acts.3 Consequently, the correctness of any
con-* Research Psychologist, Cambridge University Institute of Criminology. This research was supported
by the British Home Office. ,
INye & Short, Scaling Delinquent Behavior, 22 Am. SocioLoGicA. REv. 326-331 (1957); Short & Nye,
The Extent of Unrecorded Juvenile Delinquency: Tenta-tive Condusiow, 49 J. Cmv. L.C. & P.S. 296-302
(1958); F. NYE, FAmIY RELATiONSmpS AND
DE-LiNQuENT BEHAVIOR 10-22 (1958).
2 Se also R. HAnDT & G. BODINE, DEVELOPMENT OP
SELF-REPoRT INSTRUIm NTS Ix DELInQUENcY
RE-SEARCH (1965); R. HOOD & R. SPAREs, KEY IssUEs
IN CRmINOLOraY 61-70 (1970).
3 Christie, Andenaes & Skirbekk, A Study of
Self-reported Crime,
in
1 ScANDIxAVIAN STUDIES INCuan-NOLOGY
94 (K. Christiansen ed. 1965).
clusions
about the population (deviant behavior in general) depends on the representativeness of the sample. Comparatively trivial acts have often been over-represented on questionnaires, typi-cally because of the admission frequencies re-quired for statistical operations such as Guttman scaling.'In most investigations, all the questions have been phrased in the same direction, with the re-spondents asked whether they had committed each deviant act. This means that response sets such as acquiescence might constitute important sources of bias.6 In order to minimize such bias, the items could be phrased both positively and negatively, or alternatively scattered at random throughout a larger questionnaire.6
Ideally, each item should be interpreted in the same way by each respondent.7 This is particu-larly unlikely to happen when evaluative words like "stealing" are used in the description of the acts. What is objectively the same sequence of actions might be termed "stealing" by one re-spondent but not by another. A uniform inter-pretation might be secured by carefully defining each act in terms of specified behavior in a sped-fled situation. However, very complex descrip-tions could militate against understanding, and each act might in the end cover such a minute segment of behavior that the questionnaire would need to be impractically long.
Administration Procedure
Some self-report questionnaires have been completed non-vocally by respondents with a minimum of supervision, often in a group
situa-4Voss, Socio-conomic Status and Reported De-linquent .Behaior, 13 SOCIAL PROBLMS 316 (1965).
5
See, e.g., P. VERNON, PERsoNALrY AssEssmENT:A CRITICAL SuRvEY 206-211 (1964).
6See also Hardt & Peterson, Arrests of Self and
Friends as Indicators of Delinquency Involvement, 5
J. RESEARCH IN CRruM & DELINQUENcY 46 (1968).
7Interpretations placed on acts by respondents
have been investigated by Elinhom, Study in
Self-re-potted Delinquency among School Children in Stockholm,
in 1 ScANDmJAvm STDiES IN CRIMNoLoGY
123-124
(K. Christiansen ed. 1965); and by Heise, Norms and
Individual Patterns in Student Deviancy, 16 SOCIAL PROBLEMS 92 (1968).
tion. In other cases, respondents have vocalized answers to questions asked by an interviewer in an individual setting. Both methods have their ad-vantages. In the interview situation, it is easier to ensure that the respondent is placing the de-sired interpretation on the acts, that he is not answering randomly, and that he answers every question.' In addition, detailed information can be obtained about the precise circumstances surrounding each act. The group self-completion method, however, is more objective and capable of standardization, and the relationship between the respondent and the interviewer is not likely to be so important. However, poor readers un-doubtedly present problems.9 It has been sug-gested that interviews are superior because they permit probing of answers and hence make de-ception more difficult.'0 On the other hand, prob-ing might induce exaggeration. Another possibil-ity is that self-completion is superior because re-spondents are likely to be less willing to admit deviant acts vocally in a face-to-face situation." In the absence of a detailed comparison between the individual interview and group self-comple-tion techniques, these possibilities must remain hy-pothetical. An individual self-completion method would seem to be an admirable compromise.
Investigators have usually prepared a stand-ard set of instructions, pointing out such things as the confidentiality of the information required, its use only for research purposes, and the neces-sity for honest reporting. The questionnaires have often been completed anonymously since it has been thought that respondents would have nothing to gain by witholding or distorting in-formation in this situation." However, truly anonymous questionnaires are impossible to validate against information from other sources. A comparison between anonymous and non-anony-mous administrations found that the total scores in the two conditions correlated remarkably well
" Nye & Short, supra note 1, at 330, dealt with missed answers by assigning them to the modal cate-gory, but this is not an ideal solution.
9 See, e.g., T. Hmscar, CAUSES OF DELINQUENCY 41 (1969).
" Erickson and Empey, Court Records,
Unde-tected Delinquency and Decision-making, 54 J. Carn. L.
C. & P.S. 458-459 (1963).
"Voss, A Reply to Gold, 15 SOCIAL PROBLEmS 119 (1967).
" Short & Nye, Reported Behavior as a Criterion of
Deviant Behavior, 5 SOCIAL PROBLEMS 210 (1957).
(0.98), although they were significantly (about 10%) higher in the anonymous condition."
Scoring
Each questionnaire item can be scored accord-ing to whether or not the act was committed during a certain time period. Some respondents have been asked to estimate the number of times they have committed an act, either exactly or within certain specified ranges, while others have been required to check categories such as "often," "sometimes," "seldom" and "never." The dis-advantage with the latter scheme is that objec-tively the same number may be rated "seldom" by one person and "often" by another. The time periods have ranged from one year to a lifetime, although inaccuracies arising from faulty memory are especially likely with longer periods.
The responses given to the acts by each person have often been combined in some way to furnish a score on a scale of deviancy. An index of variety of deviant behavior has been obtained by count-ing the number of different acts admitted, and an index of frequency by counting the total num-ber of acts admitted.14 The judged seriousness of each act has sometimes been taken into account as well, although this is a rather subjective meas-ure and leads to a score which is difficult to inter-pret unambiguously.
Factor analysis, duster analysis, and other methods have been used to derive groupings of acts, and hence to obtain scores on various scales of deviant behavior. The resultant sub-scales have often proved to be significantly inter-correlated, suggesting to some researchers that all types of deviancy are related." On the other hand, to some extent the subscales may all be measuring socially desirable responding, and this factor may be contributing to the intercorrela-tions.
Statistical problems can arise in analyses based on product-moment correlations. If the statistical significance of a correlation cannot be ascertained,
"Kulik,
Stein & Sarbin, Disclosure of DelinquentBehavior under Conditions of Anonymity and
Non-anonymity, 32 J. CONsULrinG & CLINIcAL PSYCHOLOGY
506-509 (1968).
4These indices were clearly distinguished by
Bel-son, The Extent of Stealing by London Boys and Some of
its Origins, 25 ADvANcEmN OF ScI. 177 (1968).
"M. GoLD, DELINQUENT BEHAVIOR IN14N AMERi-CAN Crry 33 (1970); Hindelang, Age, Sex, and the
Versatility of Delinquent Involvements, 18 SOCIl.
implying that its sampling distribution is un-known, the correlation is virtually meaningless. The usual method of testing the significance of a product-moment correlation assumes that the variables being correlated are measured on inter-val scales and are normally distributed. An item on a self-report questionnaire about deviant be-havior will be measured on an interval scale if it is scored according to the number of times the act has been committed, but not in most other cases. Such items often do not have normal dis-tributions because the majority of respondents have rarely or never committed certain deviant acts. However, these statistical problems do not appear to be too serious in practice.6
Norms
Most investigators have given details of the selection and composition of their sample, usually schoolchildren or college students, and have reported the proportion admitting each act. Very few have explicitly tried to derive popula-tion estimates from these figures.1 7 Samples have often consisted of all schoolchildren present in class on a certain day. These exclude truants, drop-outs, suspended and institutionalized chil-dren, and therefore are not likely to be represent-ative of the particular age-group. The exclusion of a substantial number of respondents thought to be lying, answering carelessly, unable to read, or refusing to cooperate is also likely to lessen the representativeness of any sample.1 8
No researcher has explicitly given norms and percentiles for the scores of a sample on a self-report deviancy scale, although some have pro-vided score distributions from which it is possible to derive these figures.1" If a questionnaire could be standardized in this way, it might be possible to measure deviant behavior routinely in the future by self-report.
Internal Consistency
The internal consistency of a deviancy scale has usually been assessed using a coefficient of 16 Hindelang, The Efects of Nornmality Violations on
the Interpretation of Correlation Coefficients, 8 J.
RE-SARcH nl CxnME & DELwrQuENcY 156-164 (1971).
17 Heise, supra note 7, at 81-82; T. HisSaHI, supra note 9, at 37-38.
18 Non-response bias has been investigated in some detail by T. HmiscHI, supra note 9, at 35-46.
uE.g. Christie, Andenaes & Skirbekk, supra note
3, at 99.; Eimhorn, supra note 7, at 125.
reproducibility calculated by the Guttman scalo-gram analysis technique. This technique has a number of defects, many of which were reviewed years ago by Guilford. 0 For example, the choice of items to constitute scales often capitalizes on chance errors, while a high reproducibility may merely reflect the piling up of responses in one category, and is in any case no guarantee of unidimensionality.
Few researchers have used the more conven-tional psychological measures of internal con-sistency, such as the split-half technique, Cron-bach's alpha and the Kuder-Richardson and Rulon formulae. Evidence indicates that scales containing many items and covering several types of deviant behavior are internally consistent to an unexpectedly high degree.n These methods of es-timating internal consistency would seem to be open to fewer objections than scalogram analysis.
Retest Stability
Very little is known about the retest stability of self-reports of deviant behavior. Dentler and Monroe reported that each of their five items was given the same response by at least 92% of sub-jects in a test and retest two weeks apart,n while Belson obtained an average figure of 88% with a larger questionnaire and a one-week inter-val.0 These figures probably underestimate the amount of measurement error, since over such short time intervals it might be possible for sub-jects to remember their earlier responses.
There appears to be no information in the pub-lished literature regarding the test-retest stability of these questionnaires over comparatively long time intervals. One of the purposes of this article is to fill the gap by reporting such data. Over a long time interval, a perfect test-retest correlation would not be expected because respondents will continue to commit deviant acts. A denial in the test followed by an admission in the retest is not necessarily evidence of a measurement error. On the other hand, an admission in the 2 J. Guirx.oRa, PsYcuomauc MEraons 460-61 (2d ed. 1954). See also Schooler, A Note of Extreme
Can-tion on the Use of Gutman Scales, 74 Am.
J.
SocIOLOGY296-301 (1968).21
Kulik, Stein & Sarbin, supra note 13, at 508, re-ported a split-half coefficient of .96 for a 52-item scale, while Elmhorn, supra note 7, at 123, reported one of .86 for a 21-item scale.
2 Deader & Monroe, Social Correlates of Early
test followed by a denial in the retest is evidence of such an error, and it is with these events that this article will be particularly concerned. Errors of measurement could be separated from instability in the quantity being measured (deviant be-havior) if three tests were given at intervals.2 4
Concurrent Validity
The concurrent validity of self-reports of deviant behavior has been estimated by seeing how closely they were related to official delin-quency. It is difficult to carry out an exact com-parison between self-reports and official delin-quency because there is no guarantee that a given act would have been treated as a crime if it had come to the notice of the police, nor that it would have led to a criminal conviction if the culprit had been apprehended25 Nevertheless, whatever combination of variety, frequency, and seriousness of deviant behavior has been used in constructing self-report scores, they have usually been significantly associated with appearances in official records 6 This is in agreement with the idea that self-reports and official records are both measures of deviant behavior, albeit subject to different biases. A bewildering variety of statistics has been used to measure the corre-spondence between the two measures, making comparisons between investigations rather diffi-cult. The correct statistical measure of association between self-report scores and a delinquent/ non-delinquent dichotomy would seem to be the biserial correlation coefficient.2 Concurrent
valid-1 Heise, Separating Reliability and Stability in
Test-retest Correlation, 34 AmER. Soc.
RFv.
93-101 (1969).21 Gold, Undetected Delinquent Behavior, 3 J. RE-SEARCH IN CnR & DELrNQuENCY 30 (1966); Dentler & Monroe, supra note 22, at 733.
1 Gibson, Morrison & West, The Confession of
Known Offences in Response to a Self-reported De-linquency Schedule, 10 BRIT. J. CRab. 278 (1970);
Erick-son & Empey, supra note 10, at 466; Kulik, Stein & Sarbin, Dinmensions and Patterns of Adolescent
Anti-social Behavior, 32 J. CoNsu.TiNG & Crme.IcA.
PsY-COLOGY 378 (1968); T. HIRscm, supra note 9, at 63; Gold, supra note 25, at 39-40.
17 When one variable is continuous and the other is
dichotomous but with an underlying continuum, the biserial correlation should be used. When one variable is continuous and the other is a truly discrete dichotomy, the point biserial correlation should be used. Q. Mc-NEuAR, PSYCHOLOGICAL STATISTICS 215-18 (4th ed. 1969). It seems more defensible to argue that under-lying the delinquent/non-delinquent dichotomy is a continuous variable (delinquent behavior) rather than that delinquents and non-delinquents are two quite different classes of people.
ity has also been established by showing that oil self-report questionnaires official delinquents were particularly likely to admit the offenses for which they had been convicted.28 However, this high admission rate may not apply to deviant acts which have escaped detection, for acts might become particularly memorable if they result in court appearances.
A second method of testing concurrent validity has been to estimate the proportion of self-reports given honestly. Clark and Tifft used a polygraph criterion, and reported that 92% were given honestly, and that concealment was three times as common as exaggeration among the remainder.29 Of course, responses given honestly may nevertheless be objectively incorrect (e.g., through forgetfulness), and the validity of the polygraph itself is not universally accepted. Gold was told by informants about offenses committed by others, and on the basis of a self-report ques-tionnaire classified 72% of these others as "truth-tellers" 11% as "questionables" and 17% as "concealers."' 0 The definition of a "truthteller" was rather broad, including those who confessed to the act supplied by the informants, those who confessed to more recent acts of the same type, and those who confessed to more serious acts. The veracity of the informants might also be questioned. Finally, Jessor and his collaborators showed that self-reports of deviant behavior cor-related significantly with reports by teachers and peers" Every one of the methods discussed in this section indicates that these self-reports are concurrently valid.
Predictive Validity
It might be expected that self-report scores will also be predictive of official delinquency, if indeed both are measures of deviant behavior. Officially non-delinquent respondents who admit many acts on a questionnaire should be more likely to become officially delinquent in the future than
28Erickson & Empey, supra note 10, at 459; Voss,
Ethnic Differentials in Delinquency in Honolulu, 54 J.
CRlm. L.C. & P.S. 325-26 (1963); T. Hrmscl, supra note 9, at 59; Gibson, Morrison & West, supra note 26, at 279. This result was not obtained by R. JxssoR, T. GRAvEs, R. HANSON & S. JEssoR, Socixry,
PERSONAL-rv AN Dvicxr BEHAVIoR 197 (1968).
29Clark & Tifft, Polygraph and Interview
Valida-lion of Self-reporled Deviant Behavior, 31 Am. SoCIoLoGi-CAL REv. 520 (1966). The figures refer to dichotom-ously scored responses.
30 Gold, supra note 25, at 32-33.
SELF-REPORTED DELINQUENCY
those who do not. Nothing is known about this at present, and the second purpose of this article is to determine whether or not it is true.
THE PRESENT RESEARCK
This research forms part of the Cambridge Study in Delinquent Development, which is a long-term follow-up study of a sample of 411 normal schoolboys. When first contacted at age 8-9, they included all of the boys in their fourth year of schooling at six primary schools situated in a densely populated lower-class district of London. Over 97% of the boys were racially white. Since the schools were typical'of the area, the sample might be thought to be fairly repre-sentative of English lower-class urban schoolboys. Further details of the recruitment and composi-tion of the sample have been published else-where.n
When they were aged 14-15, 405 boys (98.5% of the sample) were interviewed individually in their schools by psychologists and were given a large battery of tests, including a set of questions about deviant acts. Approximately two years later, at age 16-17, 397 (96.6%) were again seen individually and were given a structured inter-view including the same questionnaire. The interviews at the later age were less formal, being conducted mainly in the evenings by psy-chologists and social scientists working part-time. The questionnaire was developed by Gib-son," and was derived from earlier unpublished work by Willcock.34 It consisted of 38 acts, each one set out on a separate card. The wording of each act can be seen in the Appendix.
In the test, the cards were shuffled into a ran-dom order and the boys were required to sort them into two pil~s to indicate whether or not they had ever committed each act. This was essentially an individual self-completion tech-nique, although the acts did have to be read out to a small number of boys who could not read. After the card sort, the boys were asked to go through the acts they had admitted and to indi-cate whether they had done each one frequently, sometimes, or only once or twice. Confidentiality 2D. WEST, PRESE T Coiwucr AN FuTuRE
DELN QuENcy 1-37 (1969).
n
Gibson, Sdf-reported Delinquency amongSchool-boys, and their Attitudes to the Police, 6
Barr.
J.
SOCIAL & CrrNcA PsYcHoLoGy 168-73 (1967).u
Wilicock,
Deterrents to Crime among Youths aged 15-21 (Report prepared for the Home Office bythe Government Social Survey, 1965).
was stressed, although the boys were not by any means anonymous respondents.
Information was also obtained from the Crimi-nal Record Office and from Local Authority Children's Departments about each boy's official delinquency record. Up to the end of 1971, by_ which time the majority were aged 17-18, a round total of 100 boys had been found guilty of offenses other than minor traffic infractions. Most crimes were against property, principally burglary, theft, and unauthorized taking of motor
vehicles.
Predictive Validity
Of the 405 boys given the questionnaire at age 14-15, 47 (11.6%) were already delinquents. In the (approximately) three years that have elapsed since that time, a further 51 (12.6%) have been found guilty in court. For convenience, these two groups of boys will be called the "early delinquents" and the "late delinquents" respec-tively. Two of the official delinquents were not tested.
Every one of the boys was scored according to the number of different acts he admitted at age 14-15 in order to give an index of the variety of his deviant behavior. This scale proved to have a very high internal consistency coefficient (.89).11 An attempt was also made to derive subscales by choosing groups of items which appeared to have a related content and comparatively high average intercorrelations. Four groups were dis-tinguished: active theft, aggressive acts, under-age acts, and minor acts. A boy's score on each subscale was simply the number of different acts in the group which he admitted. The group in which each act was placed is shown in the Appen-dix. In order to avoid capitalizing on chance variations, half of the boys were used in deriving these groups and the other half in estimating the internal consistency of the resulting subscales. It transpired that the subscales were rather less internally consistent than the full scale and that they were all significantly (p < .001) intercor-related. In view of these findings, it was decided
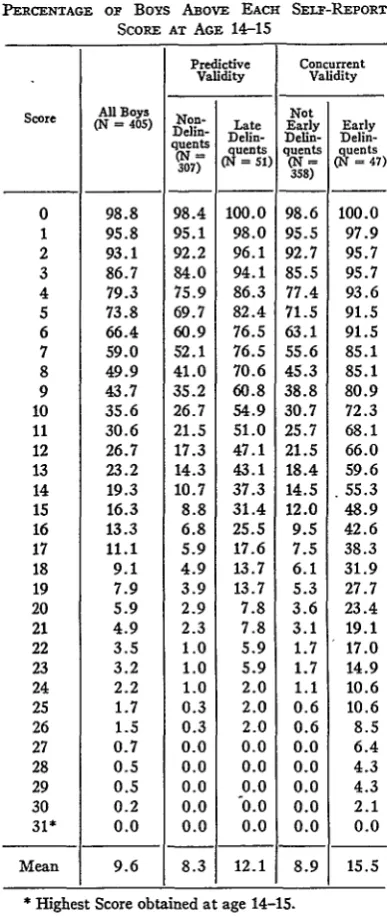
to concentrate on the full self-report scale. This scale indeed proved to be predictively valid. The 51 late delinquents admitted 12.1 acts on average, in comparison with only 8.3 admitted 'This is the Kuder-Ricbardson formula 20 coeffi-cient, calculated from phi correlations. The odd-even split-half coefficient corrected by the Spearman-Brown formula came to .90,
TABLE 1
PERCENTAGE OF Boys ABoVE EACH SELF-REPORT SCORE AT AGE 14-15
Score 0 1 2 3 4 5 6 7 8 9 10 11 12 13 14 15 16 17 18 19 20 21 22 23 24 25 26 27 28 29 30 31* Mean
All Boys (N = 405)
98.8 95.8 93.1 86.7 79.3 73.8 66.4 59.0 49.9 43.7 35.6 30.6 26.7 23.2 19.3 16.3 13.3 11.1 9.1 7.9 5.9 4.9 3.5 3.2 2.2 1.7 1.5 0.7 0.5 0.5 0.2 0.0 9.6 Predictive Validity
Non- Late Delin- Delin-quents quents
(07= (N =51) 307)
98.4 100.0
95.1 98.0
92.2 96.1 84.0 94.1 75.9 86.3 69.7 82.4 60.9 76.5 52.1 76.5 41.0 70.6
35.2 60.8 26.7 54.9 21.5 51.0
17.3 47.1 14.3 43.1 10.7 37.3 8.8 31.4
6.8 25.5 5.9 17.6
4.9 13.7
3.9 13.7
2.9 7.8
2.3 7.8
1.0 5.9 1.0 5.9
1.0 2.0 0.3 2.0 0.3 2.0 0.0 0.0 0.0 0.0 0.0 0.0
0.0 0.0
0.0 0.0 8.3 12.1
* Highest Score obtained at age 14-15.
Concurrent Validity
Not Early Early Delin- Delin-quents quents (N = (N = 47)
358)
98.6 100.0
95.5 97.9 92.7 95.7 85.5 95.7 77.4 93.6
71.5 91.5
63.1 91.5 55.6 85.1 45.3 85.1 38.8 80.9 30.7 72.3 25.7 68.1
21.5 66.0 18.4 59.6 14.5 55.3 12.0 48.9
9.5 42.6
7.5 38.3
6.1 31.9 5.3 27.7 3.6 23.4 3.1 19.1 1.7 17.0 1.7 14.9 1.1 10.6
0.6 10.6 0.6 8.5 0.0 6.4 0.0 4.3 0.0 4.3 0.0 2.1 0.0 0.0
8.9 15.5
by the 307 non-delinquents. (The 47 early de-linquents were eliminated from this analysis.) There was a highly significant biserial correlation between the number of admissions and the late delinquent/non-delinquent dichotomy (rbis = 0.38, p < .001). Table 1 shows the percentages of late delinquents and non-delinquents falling above each self-report score. It can be seen that
the greatest discrimination between these two classes of boys came at a score of 12. Only 17.3% of non-delinquents admitted more than 12 acts, in comparison with 47.1% of late delinquents. Table 1 also shows that the self-report scale was concurrently valid. The 47 early delinquents admitted 15.5 acts on average, in comparison with only 8.9 admitted by the remaining 358 boys, yielding a highly significant biserial correla-tion (rbi = 0.58, p < .001). Once again, the greatest discrimination between these two classes of boys came at a score of 12 (66.0% of early delinquents falling above this score, as opposed to 21.5% of the remainder). It can be seen that concurrent validity was higher than predictive validity for the full self-report scale. This was also true for the four subscales which were all con-currently and predictively valid according to the biserial correlation. No subscale was more predictively valid than the full scale, although active theft was more concurrently valid. For completeness, the percentage of all boys falling above each full self-report score is also given in Table 1. The mean score was 9.6, the median 8, and the first and third quartile points 5 and 13. Of the 47 boys who had been convicted before completing the questionnaire, 24 were convicted again afterwards. It is interesting to note that self-report scores did not predict these boys to any great degree. They admitted slightly more acts than the remaining 23 boys (16.3 as opposed to 14.6), but the biserial correlation (0.14) was not significant. The number of prior convictions was a much more efficient predictor of future con-victions. Of the boys who were found guilty both before and after the questionnaire, 62.5% had two or more convictions before. Of the boys who were found guilty before but not after, only 17.4% had two or more convictions before.
It might be argued that self-report scores only appear to predict official delinquency through the action of some other factor related to both. Seven factors were investigated, each of which was known to be predictive of official delinquency. 6 (1) Family Income: This was rated by psy-chiatric social workers on the basis of inter-views with the boys' parents when the boys were aged 8-9. Bearing in mind the lower class urban neighborhood, the 93 boys in families 16Fuller descriptions of these factors can be found in D. WEST, supra note 32, and in Farrington & West,
[image:7.454.26.220.45.505.2]with the lowest incomes would have been suffering severe financial hardship.
(2) Family Size: Information was obtained from parents, public records, and the boys themselves about the number of other children born to each boy's mother. Up to their tenth birthdays, 99 boys had four or more siblings.
(3) Separations: During their first ten years, 90 boys had been separated from their parents for reasons other than death or hospitalization. Permanent separations and temporary breaks lasting longer than one month were included, the information being obtained from parents and from social agencies.
(4) Parental Criminality: According to offi-cial records, 97 boys had one or both parents convicted before their tenth birthdays.
(5) Parental Supervision: This was a com-bination of two ratings made by psychiatric social workers when the boys were aged 8-9; under-vigilance and lax rules. 74 boys had parents who tended not to know what they were doing (under-vigilance) or who more or less let them do as they wanted (lax rules).
(6) Educational Attainment: At age 11, the
time of their secondary school allocation, 121 boys were placed in the lowest streams of their schools or in special schools (e.g. for education-ally subnormal children), according to their teachers.
[image:8.454.31.427.410.561.2](7) Non-verbal Intelligence: At age 8-9 and again at age 10-11 the boys were given Raven's Progressive Matrices in their schools. The two
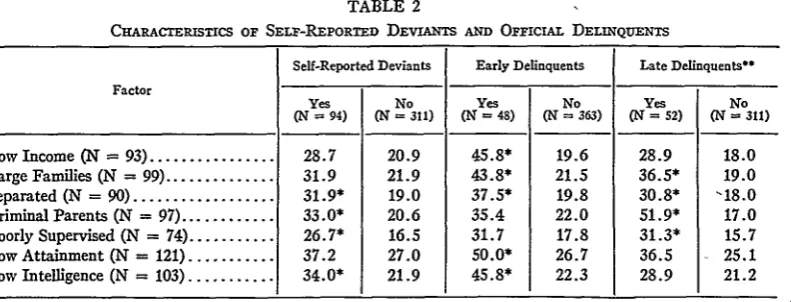
TABLE 2
CuARAcTERSTcs oF SEL-REPORTED DEVIANTS
I.Q.s were averaged, and 103 boys obtained 90 or below.
Table 2 shows how these factors were related to official delinquency and to self-reports of deviant behavior. For convenience, the 94 boys with self-report scores above the third quartile point (i.e., admitting at least 13 acts) were isolated as a group of "self-reported deviants." It can be seen that every one of the seven factors was more prevalent among these boys than among the remainder. For example, 34.0% of self-reported deviants had low intelligence, in comparison with only 21.9% of the remainder, a statistically significant difference (X2 = 5.12 with 1 d.f., p < .025). Low income, large families, and low attainment were least characteristic of the self-reported devi-ants. Every one of the factors was also more prevalent among the early and late delinquents. Low income, low attainment, and low intelligence were more closely related to early delinquency, while criminal parents and poor supervision were more closely related to late delinquency. In general, the self-reported deviants appeared to be quite similar to the official delinquents in fam-ly backgrounds and in personal characteristics.
Do self-report scores only appear to predict official delinquency because they are related to some other predictive factor? There was little sign of this with the seven factors discussed above because the scores still predicted late delinquency at virtually all levels of all factors. For example, among the boys from the smallest families (no more than one sibling), 19.8% of those wit
AND OFFICIAL DELINQUENTS
Self-Reported Deviants Early Delinquents Late Delinquents-Factor
Yes No Yes No Yes No
(N = 94) (N = 311) (N = 48) (N = 363) (N = 52) (N = 311) Low Income (N = 93) ... 28.7 20.9 45.8* 19.6 28.9 18.0 Large Families (N = 99) ... 31.9 21.9 43.8* 21.5 36.5* 19.0 Separated (N = 90) ... 31.9* 19.0 37.5* 19.8 30.8* -18.0 Criminal Parents (N = 97) ... 33.0* 20.6 35.4 22.0 51.9* 17.0 Poorly Supervised (N = 74) ... 26.7* 16.5 31.7 17.8 31.3* 15.7 Low Attainment (N = 121) ... 37.2 27.0 50.0* 26.7 36.5 25.1 Low Intelligence (N = 103) ... 34.0* 21.9 45.8* 22.3 28.9 21.2
The figures in each cell represent the percentage ofeach group (e.g. self-reported deviants) possessing the factor (e.g. low income).
above-average scores became late delinquents, in comparison with only 3.6% of the remainder. Among the boys from medium-sized families (2-3 siblings), the figures were 20.8% and 6.8%. Among the boys from large families (4 or more siblings), they were 31.6% and 18.0%.
There was only one exception to this general rule. Among the boys with the lowest intelligence, 17.7% of those with above-average self-report scores became late delinquents, in comparison with 18.2% of the remainder. This suggests that the questionnaire might have been even more predictive of delinquency if the least intelligent boys had been excluded, or if it had been more suitable for them.
It has been shown that general delinquency can be predicted using self-report scores. It is interest-ing to inquire whether or not specific types of delinquency can be predicted by specific types of admissions. Because of the small number of offences involved, it is only possible to investigate this question in a very limited fashion, and any conclusion must necessarily be extremely tenta-tive. Two of the four subscales mentioned above lend themselves to this type" of investigation, namely active theft, which is mainly concerned with burglary, and aggressive acts. Boys admitting large numbers of aggressive acts might be par-ticularly liable to be convicted of aggressive offences and high active theft scores might pre-dict convictions for burglary. Both of these expec-tations were fulfilled. The 13 late delinquents convicted of burglaries admitted a total of 10 active theft acts (average 0.77), as opposed to an average of 0.39 for the remaining 38 late delinquents, and 0.18 for the 307 non-delinquents. The 9 late delinquents convicted of aggressive offences (rob-beries, assaults, carrying offensive weapons) ad-mitted an average of 2.11 aggressive acts, in com-parison with 1.57 for the remaining 42 late de-linquents, and 0.74 for the non-delinquents. The indications are, therefore, that self-report sub-scales do predict varieties of official delinquency. The full self-report score is an index of the variety of deviant acts committed by each boy. It might be expected that a better predictor could be derived by taking into account not only variety but also frequency of commission and the serious-ness of the acts committed. As mentioned above, the boys were asked to say whether they had frequently, sometimes, once or twice, or never at any time committed each act. These four
pos-sible responses were given the weights 3, 2, 1 and 0 respectively, and the weights were added up over all the acts to produce a score which was a com-bination of variety and frequency. However, these scores were not noticeably better as predictors of late delinquency than the simple variety index
(rbis = 0.39 as opposed to 0.38). In an attempt to make some allowance for seriousness, the active theft and aggressive acts were given a weighting of 2 whenever they were admitted, while the re-maining acts were given a weighting of 1. Non-admissions were scored 0 and the weights were added up over all the acts to produce a score which was a combination of variety and serious-ness. Once again, these scores were not noticeably more predictive than the simple variety index
(rbis = 0.39). Finally, the frequency weighting was multiplied by the seriousness weighting, and the weights again added up over all acts. How-ever, this combination of variety, frequency, and seriousness was little better than the simple index of variety (rbi. = 0.40).
It was possible to repeat the predictive analyses with the questionnaire given at age 16-17. Only 23 boys were first found guilty after completing this questionnaire, but the indications were that the full self-report scale was again predictively valid. The mean score of these 23 boys was 16.0, as opposed to 11.6 for the 300 non-delinquents
(rbi, = 0.43, p < .001).
Retest Stability
The Appendix displays the percentage of boys admitting each act at the two ages. As might have been expected, almost every act was admitted by more boys at the later age. Spectacular increases occurred in taking illegal drugs (up from 0.5% to 6.3%), attacking a policeman (up from 1.7% to 5.0%), drinking under age (up from 26.4% to 79.1%), and stealing from employers (up from 2.2% to 12.6%). In connection with the last act, it should be remembered that most boys left school and started work in between completing
the two questionnaires.
SELF-REPORTED DELINQUENCY
claimed to have indulged in the more seriously deviant acts such as planned house-breaking (7.1%), unplanned house-breaking (9.3%), store-breaking (9.5%), and shop-store-breaking (12.7%).
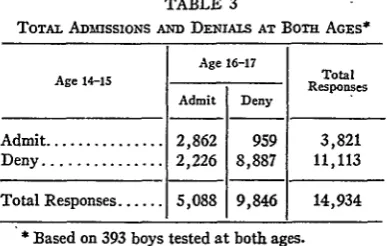
The final column in the Appendix shows the percentage of those admitting an act at age 14-15 who then denied it at age 16-17. For example, more than half (54.3%) of those who admitted stealing from cars at the first age denied it at the second. On average, over all 38 acts, a quarter of all initial admissions turned into denials. This seems at first sight to reveal a considerable degree of error, but the situation is not necessarily so bleak. Table 3 displays the relationship between all admissions and denials at the two ages. The 959 instances of admissions followed by denials do not seem so large when viewed against the 8,887 instances of denials followed by denials. The percentage of obviously inconsistent responses out of all responses was only 6.4%. Since this per-centage refers to responses which are known to be incorrect at one or both ages, the percentage error at any one age could be as low as 3.2%. Some of the inconsistent responders will have been exaggerating at the earlier age and others will have been concealing at the later age, but it is impossible to establish the ratio of exaggeration to concealment. It should also be pointed out that this investigation merely sets a lower bound on the error rate because there is no way of know-ing how many of the responses which were not obviously inconsistent were in fact incorrect. The Appendix does show that denials following ad-missions were most common with the most serious offences. Half of all active theft and aggressive admissions at age 14-15 turned into denials at age 16-17.
Some attempt was made to investigate boys who were particularly likely to respond in this inconsistent fashion. They were not identified merely by counting the number of denials follow-ing admissions because this figure depends on the number of admissions made in the first place. They were not identified by working out the probability of an admission being followed by a denial be-cause as a boy makes more admissions he becomes more likely to admit the more serious offences, which have high denial rates.n The inconsistent responders were identified according to the
differ-ence between their actual number of denials and their expected number, calculated by adding to-,7See generally Clark & Tiff t, supra note 29, at 522.
TABLE 3
ToTAL ADIssIoNS AND DE.rALS AT BoT AGES*
Age 16-17______________ Total
Age 14-15 Responses
Admit Deny
Admit ... 2,862 959 3,821
Deny ... 2,226 8,887 11,113
Total Responses ... 5,088 9,846 14,934
* Based on 393 boys tested at both ages.
gether the denial probabilities of all the acts they admitted at age 1 4-15.V The focus of
in-terest is on the 182 boys who made more denials than expected.
Given that there were four main interviewers at age 14-15, and nine at age 16-17, it is possible that inconsistent responding might be a feature of one particular interviewer. However, this did not appear to be the case. At each age, each in-terviewer was compared with every other inter-viewer according to the proportion of his respond-ents who made more denials than expected. None of the 42
x
statistics emerging from these 2 X 2 tables approached statistical significance. There was a significant tendency for the boys admitting the most acts at both ages and for the official delinquents to make fewer denials than expected(e.g., 36.8% of 95 official delinquents completing the questionnaire at both ages made more denials than expected, compared with 49.3% of the re-maining 298 boys: X2 = 4.03 with 1 d.f., p < .05). The less seriously delinquent boys were the most prone to denial.
Inconsistent responding did not seem to be re-lated to any of the seven factors described above in connection with predictive validity. However, it was significantly related to scores on lie scales. At age 14-15, the boys were given the New Junior Maudsley Inventory,"9 while at age 16-17 they were given the Eysenck Personality Inventory.40
3If a boy admitted every one of the first 10 acts at age 14-15, his expected number of denials at age 16-17 would be (0.13 + 0.21 + 0.50 + 0.05 + 0.09 + 0.09 + 0.65 + 0.41 + 0.67 + 0.57) or 3.37. If he denied four or more of the acts at age 16-17, this would constitute more denials than expected.1
9Furneaux & Gibson, The New Junior Afaudsley
Inventory (University of London Press, 1966).,
4 Eysenck & Eysenck, Manual of the Eyseick
Personality Inventory (University of London Press,
[image:10.454.235.429.40.163.2]Both contain a lie scale which is designed to detect those subjects who are telling lies to present them-selves in a socially desirable light. It was found that boys with above-average lie scores were significantly likely to make more denials than expected (e.g., 55.9% of the above-average "liars" at age 16-17 made more denials than expected, compared with 36.0% of the remainder:
x
2 = 14.8 with 1 d.f., p < .001). This result suggests that concealment is an important factor in denial, and that it is reasonable to use lie scores to detectinconsistent responders.4 1
Fewer obvious inconsistencies arose when self-report scores rather than responses to individual acts were scrutinized. When the boys were divided as far as possible into four quarters according to
the number of acts admitted at age 14-15, only 45 (11.5%) fell into a lower range of scores at age 16-17. Table 4 shows the figures. A majority of these boys (26) were in the highest quarter of scores at the earlier age.
SUMMARY AND DIscussIoN
It has been argued that certain technical in-formation should be known about self-report questionnaires before they are used as measures of deviant behavior. A review of the literature sug-gests that nothing is known either about their predictive validity or about their retest stability over long intervals. This information is given in the present paper for one particular questionnaire. It was found that this questionnaire was pre-dictively valid. An index of the variety of deviant acts admitted predicted future official convictions significantly, independently of other piedictive factors such as low family income, large family size, separations, and criminal parents. This test of predictive validity has some limitations because the criterion of official convictions is not thought to be a very accurate measure of deviant behavior. However, the result does suggest that self-ad-missions reflect deviant behavior rather than, for example, merely acquiescent response bias, boast-fulness, or a deviant self-image.
The predictive validity of such questionnaires has theoretical rather than practical implications.
4 tFarrington & West, supra note 36, at 342, used
the lie score at age 14-15 to correct self-report scores at this age. These corrected scores were slightly more predictively valid than the uncorrected scores. See
also Nye & Short, supra note 1, at 327; Dentler &
Monroe, The Family and Early Adolescent Conformity
and Deviance, 23 MARRIAGE & FAmIy LIVING 243
(1961).
TABLE 4
RETESTING WITe THE SELF-REPORT QUESTIONNAIRE
Number of Acts
Admit-Number of Acts ted at age 16-17 Total Admitted at age 14-15 Boys
0-5 6-8 9-13 14-38
0-5 ... 24 22 44 10 100 6-8 ... 7 13 50 23 93
9-13 ... 4 8 43 53 108
14-38 ... 0 4 22 66 92
Total Boys ... 35 47 159 152 393*
* 393 boys were tested at both ages.
It would be difficult to use self-report scores to identify potential delinquents for the purposes of preventive treatment. If the respondents knew that their confessions might lead to their being singled out for treatment, confessions would be unlikely unless the "treatment" appeared attrac-tive to the respondents. On the other hand, falsely describing the purposes of the question-naire would raise ethical problems. In any case, the predictive efficiency is not sufficient for practical purposes. Table 1 shows that 17.3% of 307 non-delinquents (53) admitted more than 12 deviant acts, in comparison with 47.1% of 51 late delin-quents (24). In order to correctly identify 24 future delinquents, it would therefore be necessary to misidentify 53 future non-delinquents, which would probably be an unacceptable social cost.
Predictive validity did not seem to be improved by an attempt to take into account the serious-ness of the acts committed and their frequencies of commission. This may have been because variety, frequency, and seriousness were inter-dependent. The greater the variety of deviant acts admitted, the greater their frequency and the greater their seriousness, in general. A simple measure of variety automatically measured fre-quency and seriousness as well, making it im-possible in the present analysis to determine which of the three factors was the most closely related to likelihood of conviction.42 There was some indica-tion that it might be possible to predict specific types of convictions from specific types of ad-missions.
4 Arnold, Continuities in Research: Scaling
De-linquent Behavior, 13 SOCIAL PROBLEMS 64 (1965),
[image:11.454.244.435.33.173.2]SELF-REPORTED DELINQUENCY
In addition to its predictive validity, the present questionnaire was also shown to be concurrently valid and internally consistent. However, ietest-ing after a two-year interval showed that a quarter of all initial admissions tuined into denials. The denial rate was especially high with the more serious offences, but did not appear to be asso-ciated with any particular interviewer. There was some suggestion that lie scores might be useful in detecting boys who responded inconsistently.
It is interesting to consider how this self-report questionnaire might have been improved. It might have been better to use a personal interview rather than a self-completion technique, but it is difficult to be sure in the absence of a systematic comparison of these methods. It might have been better to ask each respondent about deviant acts committed in the last year rather than in his lifetime, but then the retest stability analysis described above could not have been carried out. It would, how-ever, have been possible to say how the pattern of deviant behavior changed between the two ages. Each respondent could have been asked to estimate the number of times he had committed
each deviant act rather than to use categories such as "frequently" and "sometimes," and the ex-tremely trivial acts which were admitted by almost every boy might have been better omitted. Bearing in mind the absence of predictive validity among the least intelligent boys, the acts might have been phrased more simply. Finally, the wideness or narrowness of interpretation of each act should also have been specified more exactly; boys were particularly confused by the term "etc".
As these self-report questionnaires become more and more technically sophisticated, will there come a point when they replace official records as a measure of deviant behavior? This seems unlikely, since even the most technically perfect ques-tionnaire is bound to contain some bias. Further-more, it seems quite feasible that the continuing criticism of official records will lead to a reduction in their bias. The most accurate measure of deviant behavior may yet prove to be some com-bination of official records and a self-report questionnaire.
Appendix: Self-Reported Deviant Acts and Admission Rates
Item
1. Riding a bicycle without lights (or with no rear light) after dark.
2. Driving a car, motor bike or motor scooter under the age of 16. 3. Belonging to a group (of ten or more people) who go around together, making a row, and sometimes get into fights or cause a disturbance.
4. Playing truant from school.
5. Deliberately travelling without a ticket or paying the wrong fare.
6. Letting off fireworks in the street.
7. Taking money from home--with no intention of returning it. 8. Taking an unknown person's car or motor bike for joyriding
(with no intention of keeping it for good).
9. Smashing, slashing or damaging things in public places-in streets, cinemas, dance halls, railway carriages, buses. 10. Annoying, insulting or fighting other people (strangers) in the
street.
11. Breaking into a big store, garage, warehouse, pavilion, etc. 12. Breaking into a small shop (private tradesman), whether or
not anything was stolen. 13. Stealing things out of cars.
14. Carrying some kind of weapon (knife or cosh) in case it is is needed in a fight.
Group
% Admit
Age 14-15 (N = 405)
77.0
20.3 16.8
54.3 71.6
84.2 9.4 7.4
11.9
23.0
4.0 6.4
8.9 20.7
% Admit
Age 16-17 (N = 397)
78.8 40.1 23.4 80.9 84.4
86.7
11.3 15.6
18.1
23.4
7.3 8.6
9.6
25.4
% Admit Either
Age (N = 409)
88.3
43.5 31.1
82.2 89.5
93.2 17.1 18.3
25.4
35.9
9.5 12.7
14.2 35.0
% D/A*
(N = 393)
12.6
21.3
50.0
4.7 8.5
8.7
64.9
41.4
66.7
57.1
60.0 68.0,
54.3
Appendix-Coninued
% Admit % Admit % Admit
Item Act Group Age Age Either % D/A* 14-15 16-17 Age (N = 393)
(N=405) (N=397) (N = 409)
15. Attacking an enemy or someone in a rival gang (without using A 18.8 24.4 32.8 48.0 any sort of weapon) in a public place.
16. Breaking the windows of empty houses. M 68.9 66.8 82.2 24.1
17. Using any kind of weapon in a fight-knife, cosh, razor, A 12.1 17.1 22.0 44.9 broken bottle, etc.
18. Drinking alcoholic drinks in pubs under the age of 18. U 26.4 79.1 79.0 6.7
19. Going into pub bars under the age of 16. U 51.4 74.6 80.7 14.7
20. Stealing things from big stores, supermarkets, multiple shops M 19.3 28.2 36.2 44.7 (while shop open).
21. Stealing things from small shops or private tradesmen (shop M 36.8 39.8 53.3 39.0 open).
22. Deliberately littering the streets or pavement by smashing M 24.2 27.0 38.9 53.1 bottles, tipping dustbins, etc.
23. Buying cheap, or accepting as a present, anything known or M 36.3 57.4 64.6 22.9
suspected of being stolen.
24. Planning well in advance to get into a house, flat, etc., and T 4.7 5.5 7.1 36.8 steal valuables (and carrying the plan through).
25. Getting into a house, flat, etc., and stealing things (Don't T 5.4 7.3 9.3 40.9 count cases where stealing results from planning well in
ad-vance).
26. Taking a pedal cycle belonging to an unknown person, and T 8.4 10.6 14.7 51.5 keeping it.
27. Struggling or fighting to get away from a policeman. A 6.9 12.9 15.9 48.2
28. Attacking or fighting a policeman who is trying to arrest some- A 1.7 5.0 5.6 42.9 one else.
29. Stealing school property worth more than about 5p. M 29.1 53.2 58.7 23.3
30. Stealing tools, materials or any other goods worth more than M 2.2 12.6 14.2 88.9
50p. from employers (all in one go in working hours-don't
count breaking-in here).
31. Trespassing (e.g. railway lines, goods yards, private gardens, M 63.5 66.8 80.9 23.6
empty houses).
32. Going to "X" films under age. U 64.0 89.7 91.7 4.8 33. Often spending £1 or more a week on gambling under the age U 7.9 19.7 22.0 35.5
of 16.
34. Regularly smoking cigarettes under the age of 15. U 31.9 41.8 47.9 21.4
35. Stealing goods or money from slot machines, juke boxes, tele- M 14.6 17.9 25.2 53.5
phones, etc.
36. Stealing from people's clothes hanging up anywhere. M 3.5 5.8 8.1 69.2
37. Obtaining money by false pretences. - 10.4 9.8 17.4 75.6
38. Taking illegal drugs (purple hearts, etc.) or smoking marijuana. - 0.5 6.3 6.1 0.0
Active Theft T 6.5 9.2 12.3 50.6 Aggressive Acts A 14.3 18.8 25.5 50.3 Under Age Acts U 36.6 60.8 63.8 11.3 Minor Acts M 38.8 46.0 54.2 23.2
All Acts 25.4 34.0 39.7 25.1