The
Suburbanisation of
Office Development in Dublin and
its Transport
Implications
Andrew MacLaran
Department of Geography, Trinity College. Dublin
James Killeo
Department of Geography, Trinity College, Dublin
Introduction
Cities exist primarily to accommodate the vast range offunctions associated with the division of labour. By and large, it is the private-sector property development sector which equips space to accommodate this multiplicity of operations. Competition for land and buildings between functions possessing different market power, together with the operation of planning systems which have historically favoured monofunctional zoning, have created an urban landscape in which functions tend to become geographically separated. Transport infrastructures provide the essential links between residential environments and employment locations.
The first part of this paper reviews the changing location of office functions in Dublin in recent decades, its focus reflecting the growing significance of office-based employment in the urban economy. It reviews the shift in the geography of development from one which focused predominantly on the inner city during the 1960s until the 1980s, towards one in which numerous and widely-spread suburban sites accounted for a growing proportion of new development in the I 990s.
The second part of the paper discusses some of the transport implications of these locational changes, paying particular attention to the potential role of public transport in catering for the resultant pattern of journies to work. It alludes also to the extent to which the most important suburban office nodes will benefit if the currently proposed transport infrastructure developments (Dublin Transportation Office, 2(00) are implemented. The implication for long-tenn land-use and transport planning policy are discussed at the end of the paper.
Office Development in Dublin
22 Andrew MacIllran and James Killen
true when commuting depended to a greater extent on public transport services, normally organised on a radial basis to bring workers from residential suburbs to the central business area.
During the 1960s, the focus for office development lay in the central-city postal district of Dublin 2 and the high-status inner suburb of Dublin 4. These comprised the most prestigious and best preserved parts of Dublin's townscape, developed from the early eighteenth to late-nineteenth centuries, and were already undergoing functional transformation as residcntial accommodation became increasingly converted to office usc. The development of new office buildings accelerated the existing trend towards functional upgrading and, by the lale 19605. Dublin 2 and 4 had become established as the city's prime office core. Planners' conservation objeclives for the existing townscape increasingly lost out to the pressure for redevelopment. Of the 45 office development schemes which were developed during the 1960s, 40 were located in Dublin 2 or Dublin 4. They accounted for 114,200 sq. m.offloorspace,comprising 92 per cent of the total. The most significant of the off-prime developments included the landmark trade-union building, Liberty Hall, in Dublin' I, the Phibsborough Tower, Dublin 7, and Esso House in suburban Stillorgan.
During the early 1970s. the spread of office development continued to widen. It comprised geographically isolated buildings situated in the inner-city postal districts of Dublin
t
,
7 and 8, the secondary areas for office development fringing the prime office core. The most notable scheme was Park House (J I ,148 sq. m.) on the North Circular Road. Located some 2 km. from the city centre. pennission had here been granted to develop a scheme with a higher than nonnal plot ratio in order to encourage schemes on the less-favoured northem side of the river Liffey and away from Dublin 2. Developments outside the canal ring (the traditional demarcation of the inner city) included the city-side of Dublin 6 in Ranelagh and around Ardee road. Office developments in the more distant suburbs were also undertaken. most notably in Inchicore, Finglas and Cabinteely, where the Bank of Ireland developed its computer centre. Schemes were also completed in Dun Laoghaire,at George's Place, and at Sandyford at the Irish Management Institute.By the end of the 1970s. although there was some evidence of office development over -spilling from Dublin 2 and Dublin 4 into the inner-city fringe and even into the inner-suburb of Dublin 6, little dispersal had taken place to the outer suburbs. Only twelve of Ihe 188 office buildings that were built from 1960 to 1979 were located in the outer suburbs. They comprised just 21 ,435 sq. m., amounting to 3.6 per cent of the city-wide modem office stock of 593,190 sq. m ..
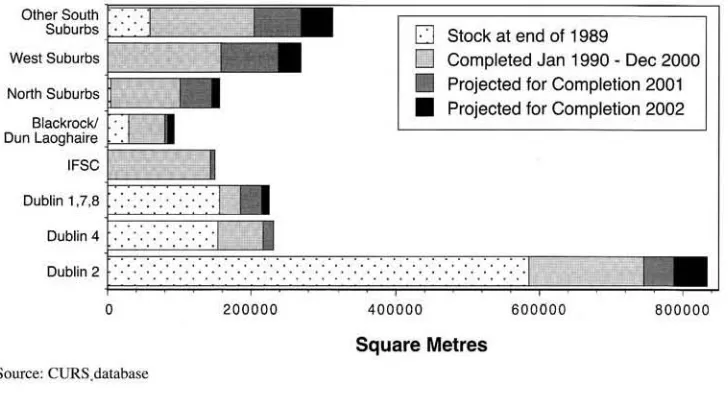
The Sllburbanisation oJOffice Development in Dublin and its Transport 23 Yet, by the end of the 1980s, when the stock of modem office space amounted to 975,285 sq.
m. in 365 developments. its distribution continued to rencct the overwhelming preference of office users for centrally located premises (Figure 1). The postal diSlricts of Dublin 2 and Dublin 4 together accounted for 75 per cent of the modem stock. A further 16 per cent was located in the margins of the inner-city (Dublin 1,7 and 8). In contrast. the outer suburbs accounted for just 9 per cent of the total. Two arcas of significant clustering had emerged at 8lackrock. which accounted for 15,250 sq. m.ofOoorspace, and Dun Laoghaire with 13,120 sq. m .. The remaining outer-suburban office space, amounting to over 24,300 sq. m., was widely dispersed throughout the southern suburbs. with little development having taken
place to either the north or west.
Rapid economic expansion during the 1990s generated a growing demand for office space
to accommodate the expanding services-sector workforce. This led to the most intensive office development boom in the city's history. The spread of office development sites
continued to widen. Fiscal incentives for the redevelopment of designated areas in central Dublin (mainly situated in Dublin 1,7 and 8) and at a greenfield site in Tallaght, one of the city's three western overspill new towns, contributed to this widening of office development activity. The immediate impact of the incentives can be ascertained from the fact that in 1990-91, 34 per cent of space reaching completion was located in Designated Areas outside Dublin 2. including the International Financial Services Centre (lFSC) at the Custom House
Docks in Dublin 1. Within two years, when the stock of modem office space in the city expanded by 18 per cent, a minority of new development was located in the traditional office core.
[image:3.482.60.424.458.658.2]During the subsequent slump in development in the early-mid 1 99Os, central-area office sites which, in previous periods of quiescence would have remained fallow until the next office development upturn, became used for alternative functions, notably residential and hotel developments. Thus, when the office development cycle restarted in 1995-6.lhe paucity
Figure 1. Location of Office Space Completed, 1960-2002 (est.)
Other South F.'~F~~~~
SuburbS
F
="===
=Jiiiii
West SuburbSF;==
North Suburbs
Blackrockl
I=
r=,
DUfl Laoghaire F'=='~-.IFSC
F"'''''==',-Dublifll,7.8 F====~o
200000Source: CURS.da!aba~
D
Stock at end 01 1989D
Completed Jan 1990 -Dec 2000 • Projected lor Completion 2001 • Projected for Completion 2002400000 600000 800000
24 Andrew MacLllran and James Killen
of central-city sites for office schemes was greater than ever. The shortages were compounded
by increased levels of protection for historic buildings and other planning restrictions in the
city centre. These increased the relative attraction of peripherally-located sites for
development.
Simultaneously, there was an increasing demand by office users for peripheral locations
which could more easily provide larger units (>10,000 sq. m.) at lower unit costs and provide
higher car parking to floorspace ratios in attractive office or science park environments.
Moreover, suburban local authorities encouraged office developments in order to enhance
their commercial rates (local property tax) base. Neither was the enhanced accessibility
afforded by C-Ring motorway overlooked. The overall result was Iba! the suburbanisation
of office development proceeded apace during the 1990s.
During the 19'Xls, scattered developments continued to reach completion in suburbs such as
Stillorgan, Cabinteely, Dundrum, Kilmacud, Ballymount, Clondalkin, Santry and Swords.
Development also continued apace in what had either already become or which were emerging
as significant suburban office nodes, most notably Blackrock, Dun Laoghaire, Cionskeagh
and Sandyford-Leopardstown.
In Sandyford-Leopardstown, adjacent to the Sandyford industrial estate, small-scale office
developments took place in the early 1980s, led by Mcinerney's multi-storey Leopardstown
Office Park and by the IDA-developed South County Business Park which was developed
later in the decade. The office schemes attracted prestigious occupiers such as International
Computers Ltd. (ICL), the Marketing Institute, Beauman and DBMS. However, its
significance as a node became more firmly established during the 1990s with the attraction
of leading companies such as Microsoft, Omcie, LG Goldstar Design, Trintcch, Eurologic,
Eireell, the AIB training centre, Barciaycard and Bank of lreland. Adjacent to the M50 and
with the prospect of a light-rail (Luas) connection to the city centre, office development
accelerated during the latter half of the decade. It involved both green-field sites and the
redevelopment of low-value industrial properties. From having an office stock of just 5,967
sq. m. in 1990, Sandyford will have developed into a substantial suburban office node with
over 143,250 sq. m. of office floorspace by the end of 2001.
New prolo-nodes also appeared in the inner-suburb of Dublin 3, with the development of the
East Point Business Park,and in the outer suburbs at Tallaght, Citywest and along the Nangor
road. East Point, Tallaght and Park West availed of fiscal incentives to encourage development.
Such was the scale of development activity in these new locations that by the end of 2000,
East Point comprised the largest suburban office node, surpassing the more established
suburban centres at Blackrock, Dun Laoghaire and Clonskeagh.
During the period 1990-2000, less than 20 per cent of the office space developed in the city
was situated in Dublin 2, with a further 8 per cent being located in Dublin 4. [n contrast, the
outer suburbs accounted for 53 percent of the total. As a result of the unprecedented scale of
the development boom and its changed geographical focus, the distribution of the city's
modem office stock had been transformed. By the end of 2000 only 40 per cent of the
modem stock was located in Dublin 2, with Dublin 4 accounting for a further 12 per cent.
The SuburbaniSliliOIl of Office Developmem in Dllblin alld irs Transport 25
A review of the office development schemes under construction in June 2001 pennits a projection to be made of the volume of office development that will be completed during 200 1 and 2002. The location of projected development is depicted in Figure 1 . Over 260,000
sq. m. of office space arc likely to reach completion in 2001, with a further 170,000 sq. m. in 2002. Sueh is the scale oflhis projected development that, if completed, the city-wide stock of modern office space would increase by 23 per cent from 1.83M sq. m.to 2.264M sq. m. in just two years. Over 66 per cent of the projected completions would involve suburban
floorspace. Thus, by the end of 2002. around 36 per cent of all modem office space in the city. comprising almost 830.000 sq. m .• may be located in the suburbs. This figure is larger than Dublin's total stock of modem office space in 1984. Moreover. these calculations do
not take account of the estimated additional 105,000 sq. m. of modem office space associated with industrial management operations and tele-services functions which is currently in
existence on industrial estates, primarily in peripheral locations (MacLaran. 1999).
With regard to the foregoing projcction, it needs to be pointed OU1that a deepening of the
current economic down-tum is likely to occasion the scaling down of a proportion of this projected development activity. This is especially true of suburban developments. With peripheral vacancy rates in July 2001 ranging from II per cent in the southern suburbs, to 20 per cent in the north and 27 per cent in the western suburbs compared to central-city rates of just 3 per cent, initial rents had fallen by around one Ihird in some peripheral locations during the second half of 2001 and increasing difficulties arose in obtaining funding for further
development. Yet,in the longer-tenn, the spatial trends discussed above are likely to continue.
Suburban Office Nodes and Public Transport Provision
As has been mentioned already, transport and accessibility considerations have been one of the major forces driving the increased suburbanisaton of office functions in Dublin. From the point of view of the occupants of the new office developments. a matter of crucial
importance concerns the manner in which and the ease (or otherwise) with which the journey
to work can be undertaken. On a city-wide basis, the spatial outcomes in terms of the level and pattern of work trips generated by Ihe revised distribution of offices has important planning implications.
At Ihe time when the city centre was the most important location for offices, public transport
played a key role in the journey to work. In 1967 for example. Dublin Corporation traffic
counts suggest that the breakdown by mode for journeys over the inner cordon in the morning
peak hour was estimated to be: car 34 per cent, bus 51 per cent. train 3 per cent and other modes 12 per cent. By 1997, these figures were 48 per cent. 25 per cent, 13 per cent and 14 per cent respectively. While the share of trips being handled by the public transport modes
declined over Ihe thirty-year period. they were still playing a significant role in delivering workers to the city centre. The use of public transport for Ihe work trip is obviously desirable
in terms for example of using existing road space efficiently and in terms of sustainability.
26 Andrew MacLaran and James Killen
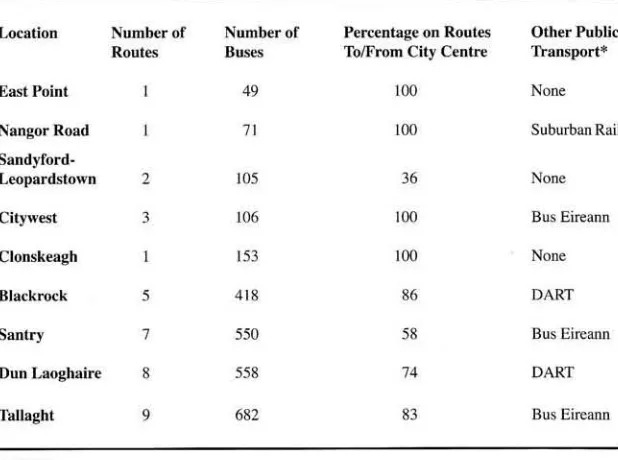
Table I and Figure 2 depict the most important of the suburban office locations cited earlier
in the paper. These inelude the longcestablished nodes at Blackrock and Dun Laoghaire where office development has been grafted on to pre-existing service centres and, in the same vein, Santry and Tallaght which represent similar office centres of more recent origin. Clonskeagh is selected as a location which developed strongly in response to the availability
of a suitable development site at a south inner-suburban location and a relaxed planning altitude towards car parking on the part of the former Dublin County Council; much of this
site also benefits from a Dublin 4 postal address. SandyfordJ Leopardslown, Citywest Business
Park situated west ofTallaght, Park West Business Park adjacent to the Nangor road, and the
enterprise zone at East Point Business Park are chosen to represent rapidly growing peripheral
office locations which are largely not associated with other commercial development.
Table I gives for each of the nine locations cited a number of statistics, namely the number
of bus routes with at least ten buses per day in eaeh direction on Monday to Friday serving it.
Table 1. Public Transport Provision at Selected Suburban Office Developments
Location Number of Number of Pereentage on Routes Other Public Routes Buses To/From City Centre Transport·
East Point 49 100 None
Nangor Road 71 100 Suburban Rail
San
dyford-Leopard.'itown 2 105 36 None
Citywest 3 106 100 Bus Eireann
Clonskeagh 153 100 None
BlaekrQCk 5
'"
86 DARTSantry 7 550 58 Hus Eircann
Dun Laoghaire
,
558 74 DART1"allaght 9 682 83 Bus Eircann
l\"OTES
Routes using the same number but with different letter designations to indicate minor variations e.g. 7. 7A. 7X arc taken as comprising onc route.
* As provided by lamr6d Eircann or Hus Eircann: in the case of ccnain locations (e.g. EaSt
Point and Citywest). private bus operators provide limited service.
DART _ Dublin Area Rapid Transit. electrified suburban heavy-rail service
Suburban Rail - diesel-based heavy-nli! service
Bus Eireann - long-distance coach service
[image:6.482.104.413.290.520.2]The SlIblirballisalion. o/Office Deveiopmem;1I Dublin. wId its Trallsport 27
the number of buses arriving nllhe location per day (Monday to Friday), the proportion of these buses Ihal are en route either 10 or froIl) t}le cily centre. that is operating on radial rather than on circumferential routes and finally, the other public transport connections available. Routes using the same number but with different letter designations to indicate minor variations have been taken as comprising one route. The information relates 10 May 2001.
The first point to notc is that all of the locations are poorly served by public transport. Indeed, it could be argued that two of them, East Point Business Park and Nangor road arc not served at all by the services referred to in Table I as in both cases. the relevant bus stops
are
located some distance from the offices concerned. Yet. East Point Business Park is currently the largest development of those listed in the table. Clonskeagh is served by just one bus route even though it is well established and is currently the second largest of tile developments listed. The case of Sandyfordl Leopardstown is also of interest in view of its relative size and planned development; at present, this location is served by just IWO bus routes with more than ten departures per day. Tallaght, the best served location, has but nine such bus routes. The compamble figure for the city centre is fifty-nine routes of which eight are cross-city routes.The latter statistic suggests the extent to which the developments listed in Table I are at a disadvantage vis a vis public transpon provision relative to the city centre and hence the relatively limited role that public transport can play vis a vis thc journey to work. This disadvantage is even more Slark when it is considered that the city centre is also located at the hub of the mainline and suburban railway systems and of the bus route networks operated by Bus Eireann and various private operators.
In general, the majority of buses in Dublin operate on radial routes From orto the city centre.
Figure 2. Office Stock at Selected Suburban Nodes & Projected Deve)opment2001-2
Blackrock
Cionskeagh
Tallaghl
S.n''1Io"" Leopardstown
Nangor Road
City West
o
Source: CURS iliuabase
50000
o
Jan 1960 -Dec 2000 • Proj. completions 2001• Proj. completions 2002
100000 150000
[image:7.484.57.418.429.616.2]28 Andrew MacLaran and James Killen
Figure 3. Sandyrord I Leopardstown: Public Transport Routes
Ballymun
Cabra
Phibsborough
City '""
CentreL..!J
Beaumont
Inchlcofe
Dolphin's Barn
Crumlin Walkinstown
Harolds
c~
,--,
ISC:•
...
'
I!!fl
"*
Terenure
Bus foote
Bus terminus
Office Development
5 kiIorne\Jes
Rathgar
W"'"
"""'"
Ralhlamham
N
t
C> ... d",,,,
o.,,"~
Ballinteer
Kilbarrack,,--_"S""C""C'~
Artane
Saltynoggin
Cabintaely
Loughlinstown
The proponion of buses operating to each location listed in Table I that are running on such routes is given in the table. As can be seen, all of the buses serving the East Point, Nangor
road, Citywest and CJonskeagh developments are running on such routes as are the majority of buses serving all but one of the other centres. The exception is Sandyfordl Leopardstown
where the most frequent bus route operates to a DART station where tr'dnsfer is available to
the city centre.
Given that the public transpon service as currently provided focuses mainly on providing service along radial routes, the number of inter-suburban journeys that can be undenaken
without travelling to the city centre fI/st is limited. Thus there are major limitations on the
range of destinations that can be reached easily by bus from the various suburban office
developments.
The relative paucity of destinations that can be reached from some of the major office locations
The Suburbanisation of Office Development in Dublin and its Transport 29
Figure 4. Citywest: Public Transport Routes
&.Is r(ll)!e
Bus terminus
011 . . Developm&nt
"
Leopardslown connects me development to me DART station at Blackrock while an infrequent
service runs to the city centre. Citywcst is at the outer tcnninus of two routes from thc city
ccntre while another route passes by. The maps emphasise the gencrally poor provision of
service at both of these locations; yet. as indicated already, they are already of significant
size and are expected to expand considerably in me next two years.
Figures 5 and 6 relate to Blackrock and Tallaght respectively. As can be seen, me level of provision of public transp:nt al both of these locations is better than in the case of Sandyfordl
Leopardstown and Citywest. The position of Blackrock is enhanced further by the availability
of DART service. In tenns of bus service, Tallaght is me best served of all me centres listed in Table I, yet it is served by just nine bus routes.
Figure 7 relates to Santry which has a relatively generous provision of service. Yet, this
location does not comprisc a pre-existing suburban node in the same sense as Tallaght or Blackrock. The relalively generous provision of public transport at Santry relates at least in part to the fact mat Santry is located at the junction of an important radial route and a
circumferential route.
The major conclusion to be drawn from the foregoing is that all of the outer suburban office
locations listed in Table I are relatively poorly served by public trdnsport. It is notable also that in many cases, me bus routes serving the locations concerned were in existence long before the centres themselves were built. The alterations that have been made in public transport provision as a result of the completion of offices at the locations concerned has
[image:9.485.52.427.75.316.2]30 Andrew MacLarall and James Killen
Figure S. Blackrock: Public Transport Routes
Cabra
Phibsborough
City
Centre {1][!]~
,
.
.
-
'
••••• 7[1II~ '~,8
~.;~
t
5,_Bam ,,' D<II
r~HaroIds •••••
Crumlin
p
p_
Cross Donnyt:lrobk.S" Ralt1mines " '\
"!~""
Terenurii-' Ratl'ogar \ .... , Blackrock
: Windy ," - 17 Ij'j4l
, Arbour- '-.. 17. / · . ~
lRathfarJ'lham : ... ...., ••• ... _ ••••• -~~ ... rehtown
Tampleogue
,
, '.
: ·~,---_.",.l .. f Dun Laoghalre
o..oo.m
Firtlouse
,.,
N
,
16C: Bus roote
t
,
•• 0[!jg
Bus terminus"*
Off<o Development5 kilometres
114: .. Monkstown 'p
-:
"
:
--.----" 7' 8 ..
.. Daahs .' : Oalkey
Kilmacud ...
Grarva
~_ r"-'·-___ .-·' \ 45 SaIlynoggin~d Leopardstown \ t,
fjW \ ..
~
'.
'
Kilcross '.
,
Cabintee!y,
\
'"•
\ :(1]
'.,~OUghtinstown
, ,
,
,
,
,
'
"
'.
, ,
s,
,
,
,
'., -,. __ , Bray
,
,
,
,
,
,
'."
'.~p---'
Public transport is best placed to make a significant contribution towards meeting travel demands when these demands comprise relatively large flows concentrated along a relatively
limited number of well defined routes. Such a pattern of work-trip flows has not been the end product of the suburbanisation of office functions. Rather, the overall geography of
office work trip patterns has become more diffuse. connecting a plethora of suburban locations
to range of office locmions. The main implication of this is that the car has to be the main mode of transport for the workjoumeys associated with the new office developments. This sits uneasily against a transport policy that calls for an increased emphasis on the use of public transport and, in particular, the rail-based modes. It is also difficult to justify within
The Suburbanisation of Office Development in Dublin and its Transport 31
Figure 6. Tallaght: Public Transport Routes
...,
'"'-
-.
*
"
15C: Sus fOJI.
-"'"'-,
.t
...
'\ / To BIuaingIion [@
...
tltfmlnua,
5"*>m8tresFuture Public Transport Provision
Bearing in mind the current poor provision of public transport at the major suburban office
localions in Dublin, it is interesting to note how the various locations in Table I will be served if the current transport planning proposals for the city and its surrounding region
(Dublin Transportation Office. 2000) are implemented fully. Sandyfordl Leopardstown is scheduled to be served by the Luas (later to be upgraded to Metro) from 2003. It is planned that Citywest be served by Luas at a later date while East Point will ultimately enjoy access to both DART and suburban rail. No proposals exist in the current plans to link Clonskeagh or Santry to rail-based public transport. Nor is any improvement foreseen in the case of Nangor road which at present has access to a peripherally located railway station which
offers a relatively low frequency train service. Even if the current transport proposals arc implemented in full, something that seems less likely with recent economic trends, there will have been a significant time lag between the coming on stream of the office developments and the public transport infrastructure to serve them.
Long-Term Planning Implications
As was stated at the outset, the typicalland-use arrangements of West European and North American cities traditionally involved the concentration of office functions in the downtown
area with employees commuting from suburban locations. This created a predominantly radial pattern of journey to work trips with relatively large flows on the main routes with,
traditionally, a significant proportion of these trips being undertaken by public transport. As
[image:11.485.47.419.90.371.2]32 Andrew MacLaran and James Killen
Figure 7. Santry: Public Transport Routes
Bus route Bus terminus Office Development S kilometres
"
t
To 1;ke,ries
!:
IBaIbriooan "
'~" " 33
Im'-~-' 4t'j Swords !!!Qt-·,.,!
•
.
"
;;
16'
'
l41C"
16.
.
l 746 ' , __ -IDublin":
Airpot1/16 16A 16C
/746
'"
'"
lb~ ,:41C
r.::::t 104 ____ f!£!*_~~!~17A 6aIdoyIe
~,~ iaai~unt.f lr.;:;:;']'-: -~'~_~04 17A ~Kilbarrad<~C:::---I
Cappagh ~'" ___ .l.. ______ • -t '~a..aumont '_~_.---•• ~.--.: 51.1"011 - Finglas 17'\ ~!~~
r
\_:.~~_~ 104/CooIoc:k .'-l_/ 103" Artar"lEt 16 16A ISC,' ' - " ,
43(/
···~··
••
i
Orumoond'lI 103 ClQntart '103
41C : ,.,~ . . 1I_.,..,£. .. C·-·>,'~.;.-<J
746/ - ..
.
'.
AshtownChapeli
:
~'"
..
.J~~~
1311411419;lC~It~y~'~.~
Centre \...
-::===-~~~~~:r--::~~
'Ballyferrno1 Islandbridge :" ".
i
~746
''''''''"'.
Dolphin" Barn [_J ""Crumlin WalklnstQWfl
.
.
HatOIds J '"
Cross , Donnybrook
16~/ AIlIhmir"lEt$ "'"
16C: Rllthga, '"
Te,enure : \,
Windy
, Arbour \.
: Rathfam,!WQ ,
·.,.,._.U!!lChurchtown "'. MonkS\QWn •
\J!!l
Dondrum StillQrgan\ 746 Deans(".1
'. Bal~nteer "" G'8f>9I;'~ lSC " " . • •
Kilmacud " ••• '
~ Marlay ord L dstown Templeogue
Dalke
Dublin. This is in contrast to many other European cites where the rail-based modes have traditionally been of far greater importance.
The Subllrbanisalion of Office Deve[opmenl in Dublin and ilS Transpon 33
Looking to the fUlUre. it is obvious that there is no simple solution to the strains Ibat have
emerged as a resuh of the land-use and tranmort policies that have been followed in Dublin
in reeent times. There exists no simple transport fix because the 'problem' is not one of congestion. Rather it concerns the nexus between development. land-uses and the circulation
between them. It is highly disturbing that there seems to be little official recognition of the
nature, depm and complexity orthis nexus; indeed, it could be argued thai the current proposal
10 create a body to coordinate land-use and transport planning in the Greater Dublin area
(Department of the Environment and Local Government and Department of Local Enterprise,
200 1) represents the first time at national level mat the link between these two has been acknowledged formally. On the ground. those currently charged with exccUling and planning
transport policies still tend to approach the 'problem' with highlycompanmentalised modes
of thinking.
The overall conclusion that must be drawn is that while a planning model that places virtually all office functions in the city centre area, as was the situation traditionally, is inappropriate, one that spreads office development widely at a plethora of peripheral locations, as has been occurring in Dublin recently. is also inappropriate. This leads inevitably to the conclusion
that if Ibe macro-scale land-usc arrangements in Dublin are to become more sustainable. the only appropriate planning policy is one which limits office locations to the central area and
to a very limited number of carefully chosen suburban nodes and which incorporates
appropriate transport measures at the design stage.
What properties should these outer suburban office locations have'! The most important
would seem to be that they must possess a well-developed transport infrastructure and. in particular, that they be served, at least in the future, by high quality public transport. The
pre-availability of services and other commercial activities. as would be found at a pre-existing suburban node, would also seem to be an important advantage, if only because such mixed -use developments would help to sustain a high-quality and preferably rail-based public
transport service mroughout the day. rather than just at rush hour when it would be used by
office workers. The development at Uffey Valley, where 8,400 sq. m. of office space is due for completion in 200 1-2, is a good example of where the retailing element should provide a rationale for a full public transport service beyond the peak. commuting times for office workers.
Figure 8 suggests an arrangement where a limited number of suburban office locations are pennittcd and are so arranged on a metropolitan scale as to be servcd by both radial and circumferential public transport services. togethcr with local feeder routes. The model suggests
seven suburban locations as candidates for major development as office and retail nodes. These would be linked to the city cenlre and to one another by high-quality. prefcrably rail
-based public transpoil routes. Each node would also have local public transport services
connecting its hinterland to the core. Such a model which retains a primary status forme city
centre whilst assigning significant importance to a limited number of other locations and which has the provision of high quality transport corridors at its core would appear to be the
only logical way in which development can be managed into the future. To develop along
these lines would be very much in keeping with the philosophy underlying the current Strategic
34 Andrew MacLaran and James Kif/en
Figure 8. A Model for Public Transport and Office Nodes
~:---
'
'.
.
'.
.
Dun laoghaire
\.
\••
' ~SandyfOrd \
~\
,
~.).\1,---,
Major circumferential public transport route
___ .. Major radial public
transport corridor
Conclusions
local public transport feeder network
OMice and retail
development nodes
In terms of long-term sustainabiJity, rather than profitability for developers, the current land
-use/transport arrangements relating to suburban offices are highly inappropriate and
inefficient. They do not suggest that any progress has been made in managing the use and
conservation of environmental assets. Indeed, they suggest the opposite. The land-use arrangements we permit determine the operational efficiency of the cities we devise, as reflected in the cost of negotiating the 'friction of distance', whether measured by time wasted in travel or the costs of energy consumed.
Clearly, there will always be a need for some movement within cilies, butlhe key implication
arising from sustainability considerations is that circulation between functional areas of the
city needs to be greatly reduced by moving towards a greater heterogeneity of land-uses.
The Suburbanisalion of Office Development in Dublin and its Transport 35
developments are promoted which move our cities towards the type of model depicted in Figure 8. Such a model recognises the valu~ 9f the mosaic·like structure of the city and of that now largely abandoned planning concept of the neighbourhood. It is one that fully supports the European Commission's Green Paper on the Urban Environment (1993,60) which states that:
Note
"The strict zoning policies of the past decades which have led to the separation of land·use and the subsequent development of extensive suburbs have in tum stimulated commUier traffic, which is at the heart of many of the environmental problems currently
facing urban areas. We therefore need a fundamental review of the principles on which town·planning practice has been based. Strategies which emphasise mixed·use and denser development are more likely to result in people living close to workplaces and the services they require for everyday life. The car can then become an option rather than a necessity."
An earlier version of this paper was presented at the Rio+IO Achievement llnd Challenge
conference, Sept. 2001, in University College Dublin in 2001 and published in Convery, F. & Feehan, J. (eds.) (forthcoming 2002).
References
Brady Shipman Martin et al (1999) Srrategic Planning Guidelines for the Greater Dublin Area.
Brady Shipman Martin & Associates, Dublin.
Commission of the European Communities (1990) Green Paper on the Urban Environment.
Commission of the European Communities, Luxembourg.
Department of me Environment and Uxal Govemmenl and Department of Public Enterprise (2001)
New In.~tjl!ltio,,al Arrangemelllsfor wnd Use (100 Transport in the Gremer Dublin Area. Stationery
Office. Dublin.
Dublin Transportation Office (2000) A Platfarmfor Change. Dublin Transponation Office, Dublin.
MacLarnn,A. (1999) Inner Dublin: Change and Development, in Killen.J. and MacLarnn.A. (cds.)
Dublin: Contemporary Trends and Issues/or the Twenty.First Century. The Geographical Society
of Ireland, Special Publication No. 11. Centre for Urban and Regional Studies, Trinity College
Dublin.
MacLaran. A. and Beamish. C. (1985) Industrial Propeny Development in Dublin, 1960·1982.
Irish Geography. 18. 1985.37-50.
O'Farrell. P.N. and Markham, J. (1974) The Joumey to Work: a Behavioural Analysis, Progress in
Planning, 3 (3), 187·288.
Parker.A. J., Kelly, EM. and Kyne, D. M. (2001) The Dublin Shopping Centre (J/ld Retail Park
Digest. The Centre for Retail Studies, University College, Dublin.
Williams, B. and Shiels. P. (2000}Acceleralion into Spmwl: Causes and Potential Policy Responses.