Journal of Criminal Law and Criminology
Volume 53
Issue 3
September
Article 2
Fall 1962
Comparison of the Executed and the Commuted
Among Admissions to Death Row
Marvin E. Wolfgang
Arlene Kelly
Hans C. Nolde
Follow this and additional works at:
https://scholarlycommons.law.northwestern.edu/jclc
Part of the
Criminal Law Commons
,
Criminology Commons
, and the
Criminology and Criminal
Justice Commons
This Article is brought to you for free and open access by Northwestern University School of Law Scholarly Commons. It has been accepted for inclusion in Journal of Criminal Law and Criminology by an authorized editor of Northwestern University School of Law Scholarly Commons.
Recommended Citation
COMPARISON OF THE EXECUTED AND THE COMMUTED AMONG
ADMISSIONS TO DEATH ROW
MARVIN E. WOLFGANG, ARLENE KELLY AN HANS C. NOLDE
Marvin E. Wolfgang is Associate Professor of Sociology at the University of Pennsylvania. He is the author of Patterns in Criminal Homicide, for which he received the August Vollmer Research Award in 1960, and is a frequent contributor to this and other journals concerned with criminology and corrections. Dr. Wolfgang is President of the Pennsylvania Prison Society and Co-Director of the Ford Foundation Research on The Measurement of Delinquency. Arlene Kelly is a graduate in sociology from the University of Pennsylvania and is presently engaged in social work. Hans C. Nolde, also a graduate in sociology from the University of Pennsylvania, is a student at the University of Pennsylvania Law School.
Is a rational, fair scheme, consistent with the principles of equality of justice, discernible in the com-mutation of death sentences? Or does a selective system appear to operate, differentiating between.
the executed and commuted upon improper bases? With these questions in mind, the authors have studied the case records of 439 persons sentenced to death for first degree murder and detained on death row in Pennsylvania between 1914 and 1958. How did the case records of those whose sentences were commuted differ from the case records of those who died in the electric chair? In this article, the authors present the differences in terms of type of murder committed, age, race, nativity, occupation, marital status, type of counsel, and other relevant factors; evaluate the statistically significant differ-ences; and discuss the implications of their findings.-EmToR
BASIS FOR THE STUDY
The purpose of this study is to analyze statisti-cally the social characteristics of those persons who have been sentenced to death for the crime of murder since introduction of the electric chair in Pennsylvania. The basic data consist of the case records of 439 persons sentenced to death for first degree murder' and detained under custody on death row between 1914 and 1958.2 These
I "All murder which shall be perpetrated by means of poison, or by lying in wait, or by any other kind of wilful, deliberate and premeditated killing, or which shall be committed in the perpetration of, or attempting to perpetrate any arson, rape, robbery, burglary, or kidnapping, shall be murder in the first degree." PA.
P . CODE art. XII, §701.
The first statute to divide the crime of murder into degrees was enacted in Pennsylvania on April 22, 1794. Many other states of the union adopted this model with slight changes in the substantive law but with consider-able variations in judicial interpretations, See, e.g., Keedy, History of the Pennsylvania Statute Creating
Degrees of Murder, 97 U. PA. L. REv. 759 (1949); Keedy, A Problem of First Degree Murder: Fisher v. United States, 99 U. PA. L. REv. 267 (1950); Keedy, Crimi-nal Attempts at Common Law, 102 U. PA. L. REv. 464 (1954).
2 A recent review of data in the archives of the State Correctional Institution at Rockview, furnished by
W. W. Thomas to the Bureau of Corrections, indicates that there were 433 total dispositions from death row in that institution between 1915 and 1959; of these, 347 were executed (80%), and 86 were commuted (20%). Populations in the Bureau of Correction During 1960, p. 3 (Directorate of Research and Statistics, Pa. Dep't of Justice, Bureau of Correction) (unpublished).
records are filed at the State Correctional Institu-tion at Rockview, Pennsylvania, the only place in the state where the death penalty is admin-istered. Because an offender sentenced to die is transported there only as his date of execution ap-proaches, there are a number of offenders who were sentenced to die during the 1914-1958 period who do not appear in the present study because their sentences were commuted before being placed on death row at Rockview. Of those who did reach Rockview, 341 were executed and 71 were com-muted; the remaining 27 included persons who either died of natural causes on death row or for whom it has not been possible to determine the final disposition.
Although the amount and kind of information on individual cases varies greatly, most records provide sufficient data for analysis of the following major attributes of the convicted offender: age, sex,3 race, nativity, occupation, and marital status. Additional information usually obtainable and secured from examination of the original bill of indictment and of the Pennsylvania Legislative Journal includes: type of counsel for the defendant
For an interesting historical survey of early execu-tions in Pennsylvania, see Teeters, Public Execuexecu-tions
in Pennsylvania 1682 to 1834, 64 J. LAcAsrzR CouNTY
HIsT. Soc'Y 85 (No. 2, 1960).
Especially stimulating and useful for its comparative data is the study reported by Johnson, Selective Factors
(private or court-appointed); type of murder (felony or non-felony); reasons for commutation of the death sentence.
There is a growing body of literature concerned with differential treatment of offenders who have committed similar offenses, but discussion usually centers around the sentencing problem, and judicial caprice in sentencing is contrasted with the need for individual treatment.4 It is a widely held belief that minority groups, particularly Negroes, suffer discrimination in the courts, but there are few studies that examine this hypothesis empirically.5 Because there are always many diffi-culties encountered when seeking to hold constant a variety of factors in the personal and social background of offenders who appear before the courts, carefully controlled research in this area of differential judicial treatment is still in its nas-cency.
The present study does not pretend to overcome these difficulties. We are required to assume, in the absence of detailed psychological analyses and other kinds of data regarding the specific character of the murder, the offender, and his victim, that there has been some randomness in the distribu-tion of known factors. Hence, we are able to work only with the accessible gross social variables in the records. However, -there is one common under-lying factor, it must be remembered, that is socially and legally visible and that permits us to examine the present cases as a homogeneous group already controlled for the most significant at-tribute: all of these persons have been
convicted-3 The number of females sentened to die is too small to analyze separately, so that for all intents and pur-poses we are referring to males throughout the study. In only 4 cases during the entire period were females detained on death row; and of these, 2 were executed and 2 were commuted.
4 For cogent discussions of these matters, see S. Glueck, The Sentencing Problem, 20 Fed. Prob. 15
(Dec. 1956); EDWARD GREEN, JUDICIAL. ATTITUDES IN
SENTENCING (XV Cambridge Studies in Criminology,
London, 1961); WHAT's NEw N SENTENcING (Bul. No.
7 Correctional Research, Morris ed., Oct. 1957).5 Gaudet, Harris & St. John, Individual Differences in the Sentencing Tcn,icncies of Judges, 23 J. CRam. L. & C. 811 (1933); Lane, illogical Variations in Sentences of Felons Committed to Massachusetts State Prison, 32 J. CaRI. L. & C. 171 (1941); Frankel, The Offender and the Court: A Statistical Analysis of the Sentencing of Delinquents, 31 J. Cane. L. & C. 448 (1940); Lemert & Rosberg, The Administration of Justice to Minority Groups in Los Angeles County, 2 U. CA.IF.
PuBLIcA-TIONS IN CULTURE AND SOCIErY 1 (No. 1, 1948); Bullock, Significance of the Racial Factor in the Length of Prison Sentences, 52 J. Cam. L., C. & P.S. 411
1961); EDWARD GREEN, op. cit. supra note 4.
justly or unjustly-of having committed first degree murder and have been sentenced to death. There are, of course, many social and legal forces that function selectively prior to this stage and that have produced many differences in the conditions surrounding commission of the crime. Age, race, sex, social status, and other factors have long been recognized as functioning se-lectively in the commission of this and other types of crime.6 Moreover, the youthful first offender, even though having committed a heinous murder, is rarely sentenced to death.
The reasons and emotions involved in court decisions that refrain from legally permitted use of the death penalty are so numerous that research has only scratched the surface of these phenomena. There are no official public national statistics on the number of capital crimes committed in the United States each year, but good estimates suggest that not more than 15 per cent of all crim-inal homicides are capital crimes. In any case, the Uniform Crime Reports for 1959 reveal that there were 8,583 murders and non-negligent man-slaughters throughout the country.7 For the same year National Prisoner Statistics reported only 49 executions for the nation.8 In 1959 there were 285 murders and non-negligent manslaughters re-ported in Pennsylvania, and the state executed three persons during that year. Because only nine states presently have abolished the death penalty by statute, it is obvious that executions are dis-appearing de facto if not de jure and that a variety of factors in concatenation function to spare most convicted murderers from execution.
We are not here analyzing the factors that
determine whether a penalty of death or some lesser penalty is more likely to be the sentence of the court. We recognize that from the total pop-ulation capable of committing murder, selective forces are operating to "cause" some persons rather than others to commit the crime of murder, to be detected, to be prosecuted, to be convicted, to be sentenced to death, and to be held in custody on death row. The cases presently under analysis are taken from this last level of the whole cultural and judicial process of selectivity. We begin with all persons who have been sentenced to die and 6WOLFGANG, PATTERNS IN CpxmeNAL HomcmE (1958).
7U. S. DEP'T or JUsTIcE, UI.oRM Can.! RE-PoRTs-1959, 33 (1960).8
FED. BUREAU OP PRISONS, EXEcuFiONS 1959
THE EXECUTED AND THE COMMUTED ON DEATH ROW
who have been detained on death row. We then dichotomize this group into (a) those persons who actually were executed (whose sentences were in fact carried out) and (b) those whose sentences of death were commuted to a lesser penalty (usually life imprisonment).9 Whether there was legal or moral justification for the sentences of death is not our immediate concern. We may even assume (for lack of primary evidence upon which to base any other assumption) that all of these persons were equally guilty of first degree murder and were given equal treatment by the courts. At any rate, all of these offenders received identical sentences for their crimes. This element of ho-mogeneity is one of the most severe that our society can, place upon its citizens, but our judicial ma-chinery permits reconsideration of the sentence in the form of a pardon or commutation. It is im-portant, therefore, for us to know something about any differences that may exist between those persons who suffer the full extent of the law through death and those who have enjoyed the privilege of administrative reconsideration and retraction of the original sentence.
ColpwmsoN oF THE EXECUTED AND THE COMM ED
Because our political institutional machinery does provide a means for mitigating the severity of a death sentence pronounced in the judicial process, we should expect some differences to be apparent between offenders who have been ex-ecuted and those who were commuted. However, assuming that this legal machinery functions on the basis of rational and legal principles and discriminates among convicted offenders only on such basis, any class or racial differences that are noted between the executed and commuted cast doubt on the basic principles.
Only a minimal number of factors can presently be examined in this kind of comparison because of the paucity of data available to the researcher. But statistical analysis even on a macroscopic level is useful for it provides a point of departure for more intensive examination of the refined differentials that are placed in focus in this way. To assure elimination of spurious associations due to chance operation we have employed
corn-9 For discussion and research on pardons and com-mutations, see Pardon and Commutation, 39 PRISON J. 1 (Pa. Prison Soc'y, April 1959); Wolfgang, Murder, the
Pardon Board, and Recommendations by Judges and District Attorneys, 50 J. Can. L., C. & P.S. 338 (1959).
mon devices for testing the data. These include the chi-square (x2) with correction for continuity and the test of significance of differences between
proportions, both with a probability level (P value) of less than .05. The total N, or number of cases possible for comparison among each of the variables under analysis, differs from one table to another because not all of the same information was available for all 439 cases. Among those cases for which data are available, we have used test statistics to determine whether statistically significant differences occur between the executed and commuted, and where the P value is less than .05 we are in effect saying that the difference is not due to chance factors, or that some selectivity is functioning that differentiates those who were put to death from those who were spared the ultimate penalty.
Type of Murder
Although all of these cases are defined in Penn-sylvania as first degree murder, an important legal and social difference is whether the death occurred in conjunction with, or as a result of, commission of another type of felony.'0 In Penn-sylvania any death that occurs during the com-mission of arson, burglary, robbery, rape, or kidnapping is by statute classified as first degree murder, whether or not the felon committed, intended, or premeditated the slaying. This type of slaying is referred to as "felony murder," and all other types of murder are "non-felony murder." While extenuating circumstances may have been involved in commission of a non-felony murder. nonetheless there can be little doubt in a capital conviction that the court found the defendant guilty of a premeditated, intentional killing. A felony murder may involve deliberate killing concomitant to another felony, but usually this type of slaying is incidental and peripheral to the principal purpose of another crime, which most commonly is some form of theft or other crime for financial profit 1
Relative to these two types of murder a null hypothesis states: Among felony and non-felony murderers sentenced to death and detained on death row there are no significant differences in the proportions who are subsequently executed or
10 Savitz, Capital Crimes as Defined in American
Statutory Law, 46 J. Cans. L., C. & P.S. 355 (1955). See also WOLGANG, PATrERNs iN CRImNAL HOMICmE
ch. 13 (1958).
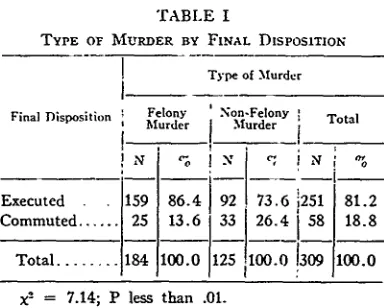
TABLE I
TYPE OF MURDER BY FINAL DISPOSITION
Type of Murder
Final Disposition 1 Felony Non-Felony
Murder
IMurder
TotalExecuted 159 86.4 92 73.6 '251 81.2 Commuted . 25.. 13.6533 26.4 158 18.8
Total ... 14 100.0 125 1100.0 1309 100.0
j2 = 7.14; P less than .01.
commuted. Table I presents the distribution of these cases, and a test for significance of difference reveals that there is an association between felony murder conviction and execution for the crime. Not only are there absolutely more felony mur-derers (184) than non-felony murmur-derers (125) among the total cases for which information is available, but also proportionately more felony murderers than non-felony murderers actually suffered the death penalty; contrariwise, more non-felony cases had their sentences commuted. We shall later examine these relationships by holding constant the factor of race.
These findings are interesting simply as descrip-tive statistics of the disposition of capital crimes, but they take on important meaning because of wide state variations in the definition of felony murder.12 Moreover, suggestions have recently been made to eliminate from the penal code an automatic charge of first degree murder in felony homicide cases. The felony murder rule has been abrogated in England, from which country our own use of this rule has evolved.3 An act that is by statute labeled "first degree murder" is con-sequently a capital crime and subjects the
offend-12 Savitz, supra note 10.
U The Engish Homicide Act, enacted in 1957, pro-vides as follows:
"§ 1. Abolition of 'constructive raice'.-(1) Where a person kills another in the course or furtherance of some other offense, the killing shall not amount to murder unless done with the same malice aforethought (express or implied) as is required for a killing to amount to murder when not done in the course or furtherance of another offense.
"(2) For-the purpose of the foregoing subsection, a killing done in the course or for the purpose of resisting an officer of justice, or of resisting or avoiding or pre-venting a lawful arrest, or of effecting or assisting an escape or rescue from legal custody, shall be treated as a killing in the course or furtherance of an offense."
ers, whether principals in the first or second degree, to the maximum penalty. Thus, all other things being equal a state such as Kansas that considers as a felony murder a death occurring during any felony has a proportionately greater number of capital offenders involved in the ad-ministration of justice than does a state such as Massachusetts that considers as felony murder a death occurring only during a crime punishable by death or life imprisonment. On the basis of the experience in Pennsylvania, one convicted of a felony murder, regardless of the kind of felony in which he participated concurrent to the death and irrespective of how the death occurred (by acci-dent, by a police officer, or by the offender di-rectly), has less probability of having his death sentence commuted. Although we cannot speak conclusively about experience in other states, it would appear that states with felony murder statutes so broad in scope as to include a death during any felony would have an even higher pro-portion of executions than we have found in Penn-sylvania. This assumption leads to a generalization requiring further study; namely, that the more inclusive the definition of felony murder, the higher the proportion of executions and the greater the differential in final disposition between felony and non-felony murderers.
We cannot know what would have been the fate of the 184 felony murderers sentenced to death had there been no statutory definition of felony homicide as first degree murder; but it is probably safe to say that more than a few of the 159 de-fendants who were executed under this ruling would have been convicted of less serious forms of criminal homicide and consequently would not have received sentences of death and would not have been executed.14 It appears, then, that aboli-tion of the felony murder rule would reduce the number of executions if the past proportion of commutations for non-felony cases should con-tinue. At any rate, nearly half a century of Penn-sylvania history indicates that a significantly higher proportion of felony murder than of non-felony murder cases provoked the full extent of society's negative reaction to homicide.
Age of te Offender
Table II shows the distribution of 407 cases for whom age at time of arrival on death row was
1
[image:5.505.36.228.52.206.2]THE EXECUTED AND THE COMMUTED ON DEA THI ROW
TABLE II
FINAL DISPOSITION BY AGE or OFFENDER Final Disposition
Age of
Offender Executed Commuted Per Cent Total
N N Executed N
15-19 7 7 50.0 14
20-24 96 8 92.3 104 25-29 71 21 77.2 92
30-34 58 12 82.9 70
35-39 48 9 84.2 57
40-44 26 6 81.3 32
45-49 18 2 90.0 20
50-54 7 1 87.5 8
55+ 5 5 50.0 10
Total... 336 71 82.6 407
known. As might be expected, the polar ends of the age groups (15-19 years, and those 55 years and over) have the lowest frequency of execution and consequently the highest frequency of com-mutation. As a matter of fact, an equal number in each of these age groups was executed as was commuted. The highest frequency (92 per cent) of execution occurs in the age group 20-24 years. Although the highest rate of criminal homicide occurs in this same age group,", this fact does not explain their highest proportion of executions. The answer seems to lie in the fact that this age group contributes most disproportionately to felony murders 6 Of the 160 felony murderers executed, 57, or 36 per cent, were aged 20-24 years; while of the 99 non-felony murderers executed, only 16, or 16 per cent, were aged 20-24. Although persons in the youngest (15-19 years) and the oldest (55 years and over) age groups may be treated differentially because of age, it appears that within the age range from 20 through 54, age per se has little or no influence on final disposition. Rather, it is the higher frequency of felony murders that most directly affects the final disposition, as is indicated by the association between felony murder, execution, and the age class 20-24 years. This age group has the highest frequency among
15WOLFGANG, PATTERNS IN CRIMINAL HOMICIDE
65-78 (1958).1 0
Among those cases for whom information was available for both age and type of murder (N = 317), there are 185 felony murderers and 132 non-felony murderers; of the felony murderers, 160, or 87%, were executed compared to 99, or 75%, of non-felony murderers.
all felony murderers; consequently, any change in the statutes regarding felony murder would most directly affect homicide offenders in their early twenties. Non-felony murders appear to be more evenly distributed throughout the age groups from 15-19 to age 55 and over. Finally, the median age for executed felony murderers is 27.5 years, and the median age for executed non-felony murderers is 35.7 years. The interrelationship therefore is strikingly obvious between the pro-portion of persons convicted of murder who (a) are executed, (b) are young adults, and (c) have committed felony murder.
Race of the Offender
Much previous research in criminal homicide, which includes murder in the first degree, has demonstrated that a disproportionate contribu-tion to the homicide rate is made by Negroes." It is no surprise, therefore, that as many as 36 per cent of the persons placed on death row are Negro. Consistent with independent research and the Uniform Crime Reports, Negroes comprise between three and four times more of the criminal homicide cases (either as offenders or as victims)
than they do of the general population.
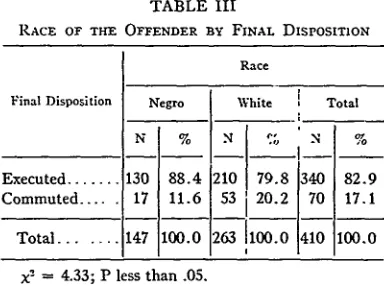
What interests us in the present analysis, how-ever, is not the rate of criminal homicide but the ratio of executed-to-commuted Negroes compared to this same ratio among whites. Using the null hypothesis again, we may assert that there is no significant difference between Negroes and whites in the proportionate distributions of capital offend-ers who are ultimately executed and those who are
commuted. Table III indicates that this hypothesis is rejected and that there is an association between race and type of disposition. The probability value resulting from the X2 reveals in this table that compared to whites a significantly higher propor-tion of Negroes are executed instead of com-muted.
Although there may be a host of factors other than race involved in this frequency distribution, something more than chance has operated over the years to produce this racial difference. On the basis of this study it is not possible to indict the judicial and other public processes prior to the death row as responsible for the association be-tween Negroes and higher frequency of executions;
17 For an analysis of criminal homicide rates by race
both in Philadelphia and in other community studies. see WOL'GANG, PATTERNS IN CRIMINAL HOMICIDE
[image:6.505.19.215.60.247.2]TABLE III
RACE OF THE OFFENDER ny FINAL DisPosITioN Race
Final Disposition Negro White Total
N % N '~ N %
Executed ... 130 88.4 210 79.8 340 82.9 Commuted. 17 11.6 53 120.2 70 17.1
Total ... 147 100.0 263 100.0 410 100.0
4.33; P less than .05.
nor is it entirely correct to assume that from the time of their appearance on death row Negroes are discriminated against by the Pardon Board. Too many unknown or presently immeasurable factors prevent our making definitive statements about the relationship. Nevertheless, because the Negro/high-execution association is statistically present, some suspicion of racial discrimination can hardly be avoided. If such a relationship had not appeared, this kind of suspicion could have been allayed; the existence of the relationship, although not "proving" differential bias by the Pardon Boards over the years since 1914, strongly suggests that such bias" has existed.
Within the confines of the data available ex-amination has been made of race and type of final disposition by holding constant the factor of age. Of the total number of cases for which there is information for each of these variables (N = 308), no significant differences emerged. When tests were run to determine association only between race and type of murder (excluding final disposi-tion), both among Negroes and among whites a little over six out of ten had been convicted of felony murder.8 (See Table IV.) No significant differences occurred in this comparison; hence, the previously noted significant association between
felony murder and a high proportion of executions could not account for the proportionately greater number of Negro offenders who are executed. Furthermore, there are no important differences in the distributions of Negro and white offenders among non-felony murder cases according to the type of disposition (Table IV). In short, although among non-felony cases a higher percentage of 18 Of 207 whites, 121, or 59%, had been convicted of felony murder; of 101 Negroes, 63, or 63%, had been
convicted of felony murder.
Negroes (79 per cent) than of whites (71 per cent) are executed, it is not a statistically significant difference and could be due to chance.
But, as Table IV indicates, it is among felony murder cases that major differences may be noted when type of disposition is examined: 94 per cent of Negro felony murderers are executed compared to 83 per cent of white felony murderers. Thus, we see that the earlier statistical association be-tween executions and felony murder is principally due to the fact that proportionately a much greater number of Negro felony murderers are executed. In terms of final disposition, no significant differ. ences occur when Negro felony murder is com-pared with Negro non-felony murder; and no significant differences occur when white felony murder is compared with white non-felony murder. Here, then, is a point at which the lack of statistical significance carries important meaning when placed side by side with a relationship that is significant. Thus,. the fact that Negroes on death row do not comprise a significantly higher proportion of felony murderers than do whites, combined with the fact that a significantly higher proportion of Negro felony murderers are executed than are white felony murderers focuses the direction of differential treatment. It is the Negro felony murderer more than any other type of offender who will suffer the death penalty. Es-pecially is this finding striking when we note that nearly three times more white (17.4 per cent) than Negro (6.3 per cent) felony murderers have their sentences commuted.
Nativity
Although differentials between the native-born and the foreign-born have been noted relative to the commission of certain types of crime9 our point of reference once again is executions and commutations among those who have been sentenced to death and have been held in custody on death row. A null hypothesis states: There is no significant difference between native-born and foreign-born in the proportions executed and commuted. (Negro males have been eliminated from this particular analysis for obvious reasons.) Table V presents data by nativity and disposition and shows that the hypothesis generally is ac-cepted. Too many national groups are involved to
19 For a general survey of nativity and crime, see
DONALD R. TAR, CmD.NoLooY 152-66 (3d ed. 1956); SUTHERLAND & CRESSEY, PINCIPLES OF CRMINNOLOGY
[image:7.505.32.224.62.205.2]THE EXECUTED AND THE COMMUTED ON DEATH ROW
TABLE IV
RACE OF OFFENDER BY TYPE OF MURDER AND FINAL DISPOSITION
Negro White
(A) (B)
Final Disposition (A) N (on-Felony (C)
Felony Murder Murder Felony Murder
Nf
% N1
%
NExecuted ... Commuted ...
59 93.7 4 6.3
61
25 (D) n-Felony
Murder
70.9 29.1
Total
.N
I
250 181.2 58 18.8
Total
...
63
100.038
100.0 1,21
86
,0
308 1oo.0
For columns (A) and (C): )e = 4.27; P less than .05
For columns (B) and (D); (A) and (B); (C) and (D): not significant.
analyze these cases statistically by country of origin.
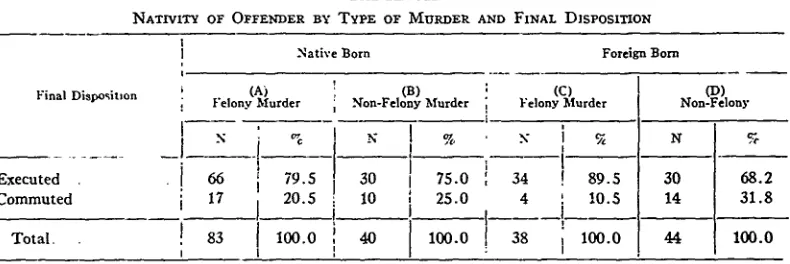
In order to determine whether there are inter-relationships obscured by the factor of type of murder, Table VI is presented below. Among those on death row, proportionately and signifi-cantly more native-born than foreign-born offend-ers committed felony murder. Of the 123 native-born offenders two-thirds had committed felony murder; whereas, among the 82 foreign-born offenders less than half had committed felony murder. We should expect, on the basis of our previous finding of a relationship between felony murder and higher frequency of executions, that significantly more native-born than foreign-born offenders would be executed. Therefore, the ob-served absence of any significant association between nativity and final disposition (as shown in Table V) is meaningful and Table VI indicates that proportionately fewer native-born than for-eign-born felony murderers are executed.
Table VII should help to clarify the relation-ships among these various attributes. As it in-dicates, nearly 90 per cent of foreign-born felony murderers are executed compared to slightly less than 80 per cent of native-born felony murderers. However, the difference does not quite reach the level of statistical significance. It is important to recognize what cannot be asserted statistically from this table. We cannot say, for example, that compared with the native-born significantly more foreign-born felony murderers are executed (columns A and C); nor that more foreign-born non-felony murderers are executed (columns B and D); nor that among the native-born more felony murderers than non-felony murderers are
TABLE V
NATIVITY OF OFFENDER BY FINAL DISPOSITON
Native Born Foreign Born Final Disposition
N % N %
Executed ... 127 80.9 83 79.8 Commuted ... 30 19.1 21 20.2
Total ... 157 100.0 104 100.0
Chi-square test not significant.
TABLE VI
NATIVITY BY TYPE OF MURDER
Native Born Foreign Born
Type of Murder
N % N
Felony ... 83 67.5 38 46.3 Non-Felony ... 40 32.5 44 53.7 Total ... 123 100.0 82 100.0
X2 = 8.25; P less than .01.
[image:8.505.20.422.62.205.2]TABLE VII
NATIVITY OF OTFENDER BY TYPE OF MURDER AND FINAL DIsPosITIoN
Native Born Foreign Born
Final Dipo~itmon Felony Murder (A) Non-Felony Murder (B) (C) (D) Felony Murder Non-Felony
N
I
I
.I
N795
30. .Executed 6 . 0 1 75.0 4 89.5 30 68.2
Commuted 17 20.5 10 25.0 4 10.5 14 31.8
Total. 83 100.0 40 100.0 38 100.0 44 100.0
For columns (C) and (D): x2 = 4.14; P less than .05
For columns (A) and (B); (A) and (C); (B) and (D): not significant.
finding suggests that there may have been some kind of conflict between the communal mores of the foreign-born who committed non-felony murder and the legal codes of the host cultures to which the immigrants came, and that the Pardon Boards (if not the courts) recognized this culture conflict as a basis for mitigation of the severity of the sentence.2 0
Race and Nativity Compared
At this point in our analysis we can make some interesting generalizations about the various sets of attributes consisting of ethnic status (Negro, white, native-born, foreign-born); type of murder (felony, non-felony); and type of final disposition (execution, commutation).
1. If an offender commits a first-degree murder, he is more likely to be executed than commuted (in a ratio between three and four to one) regard-less of his ethnic affiliation.
2. Negroes (in a ratio of five to one) more than whites (in a ratio of four to one) are more likely to be executed than commuted.
3. If the offense is a non-felony first-degree murder, there are no statistically significant differences among ethnic groups in the proportions that are executed, although a higher proportion of foreign born (32 per cent) than of native born (25 per cent) or of Negroes (21 per cent) have their sentences commuted.
4. If the offense is a felony murder, a sig-nificantly higher proportion of Negroes (94 per cent) than of whites (83 per cent) are executed. 5. If the offense is a felony murder, there is no significant difference in the proportion of offenders
20 SEWIN, CULTURE CoNr1LcT ANI CRME (Social Science Research Council Bul. no. 41, 1938).
executed when Negroes (94 per cent) are compared with the foreign-born whites (90 per cent), nor when the foreign-born whites are compared with. the native-born whites (80 per cent).
6. If the offense is a felony murder, there is a significant difference between the proportion of Negroes (94 per cent) and of native-born whites (80 per cent) executed.
7. The statistically greatest likelihood of being executed occurs among Negro felony murderers (94 per cent).
8. The statistically greatest likelihood of being commuted occurs among foreign-born white non-felony murderers (32 per cent).
Occupation and Marital Status
Our null hypothesis again states that there are no significant differences in the distribution by occupational status of capital offenders who have been executed, compared to capital offenders who have been commuted. Table VIII presents these distributions, and analysis accepts this hypothesis. Moreover, no significant differences occur when the table is compressed into relatively similar occupational groupings, or when race or type of murder is held constant. It cannot be said, there-fore, on the basis of these data, that differential application of the death penalty among those persons who ultimately reach death row is due to social class variation as represented by occupa-tion. The race differential previously noted re-mains therefore unaffected by the factor of social class.
[image:9.505.40.435.70.202.2]THE EXECUTED AND THE COMM'UTED ON DE.17" ROW
among the commuted as among the executed, even though the executed outnumbered the commuted nearly five to one. The major reason appears to be that many of the commuted had slain their wives in non-felony murders.
Counsel
An a priori assumption suggests that a private counsel will devote more attention and energy to his client's case than will a court-appointed at-torney. A variety of reasons may be offered to explain why this assumption appears valid, al-though we are not necessarily casting any derision
TABLE VIII
FINAL DISPOSITION BY OCCUPATION OF OFFENDER*
Final Disposition
Exe- Com-cuted muted
Professional ... 5 0 5 Farmers and farm :managers... *1 0 2 2 Managers, officials, proprietors.. 7 1 0 7 Clerical, sales ... 5
I
1 6 Craftsmen, foremen ... 60 9 69 Operatives, kindred workers... 75 20 95 Laborers, incl. farm ... 122 21 143 Service workers, household .... 51 15 66Total ... 325
j
68 393* Adapted from occupational categories in
ALPHA-BETICAL INDEX Or OCCUPATIONS AND INDUSTRIES
at vi (United States Department of Commerce, Bureau of Census 1950).
TABLE IX
RACE OF OFFENDER AND TYPE OF COUNSEL
on capable court-appointed attorneys. However, the expenses incurred in pursuing a murder case through the judicial process from indictment to petition for commutation would seem to handicap
the court-appointed counsel in preparation of his case. If incentive to work diligently on the case is present, expenses usually are not; and lack of the latter may sometimes reduce the former. Moreover, it is suggested that younger lawyers eager or willing to accept these cases for experience are often appointed by the courts to act as counsel for persons indicted for murder. More thorough analysis of the system of court-appointed counsel, the methods of selection of counsel, and the qual-ification of the appointed attorneys are needed before any valid assertions can be made that the defendant with a court-appointed counsel is at a definite disadvantage.
However, the data presented in Table IX in-dicate that there is a significant relationship between type of counsel and final disposition, for less than 15 per cent of the death-row offenders with a court-appointed counsel received com-mutation of sentence compared to over 25 per cent of those offenders with private counsel. Refined examination of the data leads us to con-clude that race is the major factor influencing this association. Among whites, no significant differences are noted in the final disposition according to whether the defendant had a private or a court-appointed counsel; but among Negroes, a decided relationship is discernible. It appears that if a Negro offender has a private counsel he is much more likely to have his death sentence commuted than if he has a court-appointed
at-BY FINAL DISPOSITION
Negro White
Final Disposition (A) (B) (C) (D)
Court-Appointed Counsel Private Counsel Court-Appointed Counsel Private Counsel
N % N % N % N %
Executed ... 93 91.2
j
9 69.2 121 81.2 53 75.7Commuted ... 9 8.8 4 30.8 28 18.8 17 24.3
Total...102 100.0 13 100.0 149 100.0 70 100.0
For columns (A) + (C) and (B) + (D): x5 = 4.14; P less than .05 For columns (A) and (B): )e = 5.40; P less than .05
[image:10.505.21.216.221.401.2] [image:10.505.20.422.467.605.2]torney. The number of cases (13) of Negroes on death row having a private attorney is so small that statistical analysis must be viewed with much caution. If the counsel is private, no sig-nificant differences are noted between whites and Negroes in the final disposition; hence, the race differential under private counsel disappears. But if the counsel is court-appointed, the race differ-ential is again evident, for proportionately twice as many whites (19 per cent) have sentences com-muted as do Negroes (9 per cent).
REASONS FOR COMMUTATION
Of the total 71 commutations over the period
examined, information was available regarding the reasons for commutation in 62 cases. The number
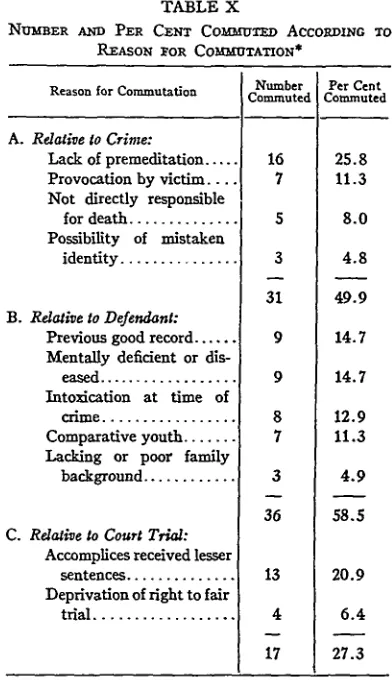
is too small for more refined analysis than the frequencies presented in Table X. (Overlapping in these commutation themes means that the total percentage is more than one hundred.) The 71 cases represent over 17 per cent of the total 407 persons sent to death row between 1914 and 1958. Thus, in nearly one out of six cases in which a court had pronounced the death sentence and the defendant had moved as dose to the electric chair as being in custody at the center for executions, a politically designated body-the Board of Par-dons-found legally justifiable reasons to impose limits on the courts' decisions.
It is especially interesting to note that of the eleven reasons given for commuting sentences, four involve serious doubts about the circum-stances of the slaying so that the status of first degree murder is legally in question. These items include: lack of premeditation (26 per cent), provocation by victim (11 per cent), not directly responsible for the death (8 per cent), and the possibility of mistaken identity (5 per cent). All told, these items (under "A" in Table X) related to the crime itself account for 50 per cent of the reasons for commutation.2n In another 59 per cent
the commutation themes ("B" in Table X) are related to the character of the defendant rather than to aspects of the crime and include such items as the comparative youthfulness of the offender, his previous good record, poor family background, mental condition, and intoxication
21 It is conceivable that "intoxication at time of
crime" could be added to this list of items that relate to the crime instead of being listed under items related to the defendant. However, drunkenness is not gener-ally a leggener-ally justifiable basis for reduction of the seriousness of the crime nor for mitigation of the penalty.
TABLE X
NUMBER AND PER CENT CoMmmD ACCORDiNG To
REASON FOR COMWUTATION*
Number Per Cent
Reason for Commutation Commuted Commuted
A. Relative to Crime:
Lack of premeditation ... 16 25.8 Provocation by victim .... 7 11.3 Not directly responsible
for death ... 5 8.0 Possibility of mistaken
identity ... 3 4.8
31 49.9
B. Relative to Defendant:
Previous good record ... 9 14.7 Mentally deficient or
dis-eased ... 9 14.7 Intoxication at time of
crime ... 8 12.9 Comparative youth ... 7 11.3 Lacking or poor family
background ... 3 4.9
36 58.5 C. Relative to Court Trial:
Accomplices received lesser
sentences ... 13 20.9 Deprivation of right to fair
trial ... 4 6.4
17 27.3
* More than one reason was given for some of the 62 persons commuted; hence, the per cent commuted on the table totals more than one hundred. Our interest, however, is in the frequency with which each reason for commutation occurred among the total persons commuted.
at the time of the crime. Finally, in 27 per cent of these commutation statements ("C" in Table X) the reason given was most directly related to the conduct of the trial, for in 21 per cent it was noted that accomplices had received lesser sen-tences and in 6 per cent the defendants had been considered as having been deprived of fair trials.
SUMMARY AND CONCLUSION
THE EXECUTED AND THE COMMUTED ON DEATH ROW
awaiting final disposition at the state center for execution. This number was reduced as additional variables were introduced for analysis, for all data were not available for each case. The major focus of attention has been on the proportion of persons whose sentences were executed and those whose sentences were commuted. Significant relationships (P less than .05) were found to exist between the type of final disposition and several attributes summarized under A and B below. The numbered item under A was compared with the same numbered item under B relative to final disposition.
A
Attributes Associated With Execution
1. Felony murder 2. Offenders 20-24 years
of age
3. Negro offenders 4. Negro felony offenders
5. Foreign-born white fel-ony offenders 6. Offenders with
court-appointed counsel 7. Negro offenders with
court-appointed counsel
8. Negro offenders with court-appointed counsel
B
Attributes Associated With
Commutation
1. Non-felony murder 2. Offenders 15-19 yrs.
or 55+ yrs. 3. White offenders 4. White felony offenders
5. Foreign-born white non-felony offenders 6. Offenders with private
counsel
7. Negro offenders with private counsel
8. White offenders with court-appointed
counsel
No significant differences in distributions were noted when the following were analyzed:
Age and race with type of murder Race and felony murder
Race and non-felony murder
Among Negroes, type of murder and final dis-position
Among whites, type of murder and final dis-position
Among native-born whites, type of murder and final disposition
Non-felony murder, by nativity and final dis-position
Occupation and final disposition
Occupation, by race and type of murder Marital status and final disposition
Among whites, type of counsel and final dis-position
Among offenders with private counsel, race and final disposition
The quality and quantity of the data available for research do not permit more refined analysis, but on the basis of what we have, it appears that the three significant findings are intricately inter-related: type of murder, race of the offender, and type of counsel. The one factor that links each of the others together is race; for while more offenders convicted of felony murder and offenders with court-appointed counsel are executed than offend-ers convicted of non-felony murder and offendoffend-ers with private counsel, respectively, these differ-ences are produced by the fact that significantly more Negroes than whites are executed. This race differential bears no relationship to the fact that the homicide rate (or perhaps even the murder rate) is higher for Negroes than for whites in the general population. We have consistently posed
the question: After the pre-death-row factors have selectively functioned to produce a group posses-sing the major element of homogeneity charac-terized by being convicted of first-degree murder and held in custody at the center for execution, what measurable factors differentiate those who are executed from those who are commuted? While the present study has not been able to draw any conclusions regarding differential treatment of Negroes in the courts, and although there may be many factors obscured by the available gross data, there is reason to suspect-and statistically significant evidence to support the suspicion-that Negroes have not received equal considera-tion for commutaconsidera-tion of the death penalty.
Thus, although differences in the disposition of capital offenders probably function to the greatest extent before sentencing, differences may be found even after offenders have been committed to death. This study of the Pennsylvania data has discovered nothing new; Johnson's analysis in North Carolina has many similarities and also used death-row data.Y But any empirical verification of previously assumed differences among persons who received society's ultimate sanction should be of value in understanding the operation of our legal principles. That race is one of these significant differences constitutes a social and political violation of the principle of equal justice and is an obvious argu-ment for those who favor abolition of the death penalty.