Adaptive Crisp Active Contour Method for
Segmentation and Reconstruction of 3D Lung
Structures
Pedro Pedrosa Rebouc¸as Filho
Federal Institute of Technology of Cear´aAv. Treze de Maio, 2081 Benfica, Zip-code: 60040-531
Roger Moura Sarmento
Federal Institute of Technology of Cear´aAv. Treze de Maio, 2081 Benfica, Zip-code: 60040-531
Paulo C. Cortez
Federal University of Cear´aCampus do Pici, S/N
Antˆonio Carlos da Silva Barros
Universidade de Fortaleza Washington Soares Av. 1321, Bl. J-30 Edson Queiroz, Zip-code: 60811-905Victor Hugo C. de Albuquerque
Universidade de Fortaleza Washington Soares Av. 1321, Bl. J-30 Edson Queiroz, Zip-code: 60811-905ABSTRACT
Computing systems have been playing an important role in vari-ous medical fields, notably in image diagnosis. Highlighted among the existing exams that allow diagnostic aids and the application of computing systems in parallel is Computed Tomography (CT). This work focuses on the segmentation and reconstruction phases of CT lung images using the Adaptive Crisp Active Contour Model 2D (ACACM) and the OpenGL library to present and analyse the results in three dimensions. The results of the proposed method were compared with those of the 3D Region Growing method and then evaluated by two pulmonologists. The results showed the su-periority of the proposed method, thus confirming that that this method could integrate medical diagnostic aid systems in the pul-monology field. Finally, some applications are shown utiizando segmentation and 3D reconstruction proposals demonstrating that the proposed method can be used to aid in medical diagnosis.
General Terms:
Lung Structures, Computed Tomography, Computer Vision
Keywords:
Crisp Active Contour Method, Computed Tomography, Image Seg-mentation, 3D Reconstruction, Lung Structures.
1. INTRODUCTION
A large number of diseases that affect the population of the world are lung-related. Therefore, research in the field of Pulmonology has great importance in public health studies and focuses mainly on asthma, bronchiectasis and Chronic Obstructive Pulmonary Dis-ease (COPD) [33, 15].
The World Health Organization (WHO) estimates that there are 300 million people who suffer from asthma, and this disease causes around 250 thousand deaths per year worldwide [4]. Also, WHO
estimates that 210 million people have COPD. This disease caused the death of over 300 thousand people in 2005 [32]. Recent studies reveal that COPD is present in the 20 to 45 year-old age bracket, al-though it is characterized as an over-50-year-old disease. WHO es-timates that the number of deaths due to COPD will increase30% by 2015, and by 2030 COPD will be the third cause of mortality worldwide [9].
In the period from 1992 to 2006,15%of all hospitalizations fi-nanced by the Brazilian Federal Health System (SUS) were due to pulmonary diseases, of which asthma and COPD together summed up 562,016 hospitalizations [4].
Thus, it is of fundamental importance for the public health system to obtain an early and correct diagnosis of any pulmonary disease. Diagnostic aid is important from a clinical point of view as it in-creases the amount of information the specialist has concerning the patients state of health. Therefore, with such data certain illnesses can be detected precociously, and lives saved lives in some cases. Also, some techniques allow the clinical image of the disease to be tracked appropriately [11, 21].
The segmentation stage of CT pulmonology images is essential for the correct and accurate medical diagnosis, as this stage delimits the lung area in CT images of the thorax, which must be analyzed by the diagnostic aid or by a specialist.
The segmentation of objects and structures in medical images is a process that, in most cases, is more complex if compared to the segmentation of other image types, such as metallographic and syn-thetic aperture radar remote sensing. This is due to the variability of structures and/or internal organs, and the different visualization planes of these images. Furthermore, there is the possibility of dis-eases affecting these organs. All of which contribute to increase the difficulty to develop efficient techniques for medical image seg-mentation [11, 21].
Growing, Thresholding and Edge Detection methods to obtain even more accurate results. [7] e [19] used traditional Active Contour Model (ACM) techniques for lung segmentation; meanwhile [27] used the Watershed transform.
Another methodology for lung segmentation is the 3D Region Growing approach, and this is applied to segment the lung and its internal structures, such as the vessels and airways [3, 18, 31, 22]. This method works similarly to the 2D region growing technique that is initialized by a seed point and then expanded through its neighbors, obeying an aggregation rule.
However, the traditional threshold-based segmentation methods, and the Region Growing, Edge Detection and Watershed meth-ods do not normally present consistent results in CT thorax images [14, 24]. This may happen due to the lack of precision in the detec-tion of lung edges generated by the internal structures such as veins, arteries and airways [8] or due to pulmonary disease or noise which can distort the radiological densities expressed in HU (Hounsfield units) of the lungs [14]. Also, segmentation techniques that utilize edge information or region characteristics separately, in general, present insufficient results and are only adequate for specific cases [14]. This is because these techniques often include structures that do not constitute the pulmonary tissue, such as the hilum and parts of the thorax cavity [17, 28, 29, 10] which are not under analysis. In order to overcome the technical restrictions of the previously mentioned methods, other segmentation techniques have been de-veloped. The most important ones are the Pulmonary Emphysema Detection System (PEDS) [13], the Active Crisp Contour Method [24] and the Active 2D Hilbert Contour method [14]. The PEDS system automatically segment the lung using the Region Growing technique associated with morphological closing and erosion oper-ations [13].
In this work, the Adaptive Crisp Active Contour two-dimensional Method (ACACM) was used for lung segmentation [24]. This method has shown itself to be superior compared to other CT image lung segmentation methods, in efficiency, as well as efficacy. This work aimed to segment a whole lung in a CT thorax exam, segment-ing each image individually through ACACM, and used the result of each piece of the CT exam to generate a three dimensional (3D) lung segmentation. The results were compared to the 3D Region Growing method results, which is the most widely used method for this type of work found in the literature. Then, both methods were evaluated by two physicians (pulmonologists).
These methods aim to assist medical diagnostic aids in pul-monology diseases using 3D visualization and reconstruction from two-dimensional CT images. After image segmentation it is pos-sible to visualize and quantify the lung structures, as well as their internal structures three-dimensionally. This facilitates the diagno-sis by the medical experts and reduces/eliminates the subjectivity of interpretation of the exam. The results obtained from the proposed method and the 3D Region Growing method were evaluated and validated by two medical specialties (physicians/pulmonologists). One of the important contributions of this work is to use the pro-posed method on personal computers (PC), maintaining, or in some cases improving the performance. Also a PC reduces the process-ing costs, the use of the CT scanner workstation as well as reducprocess-ing the overall time to evaluate a CT image.
2. EXPERIMENTAL PROCEDURES
This work proposes a new segmentation and 3D lung reconstruction method. The Adaptive Crisp Active Contour Method (ACACM) was used to segment the lung from each part of the CT thorax image, and a new methodology using the open-source computer
graphics library (OpenGL) was proposed to reconstruct the lung and its respective 3D visualization.
2.1 Medical Image Acquisition
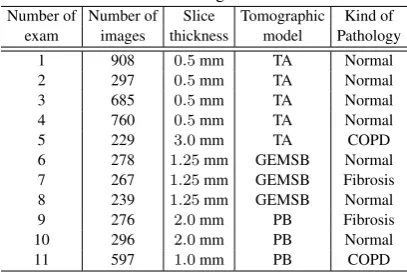
[image:2.595.335.539.262.399.2]The tomographic models used to acquire the complete exams were the Toshiba Aquilion (TA), the GE Medical system LightSpeed16 (GEMSL) and the Phillips Brilliance 10 (PB). All images had a 512 x 512 resolution with 16 bits. Table 1 gives the characteris-tics of these exams, conceded by a pulmonologist, with the patients authorization. These images constitute an image cluster obtained in partnership with the Walter Cantdio Hospital of the Federal Univer-sity of Cear, submitted to an earlier study [33, 15]. This study was approved and evaluated by the UFC Research Ethics Committee COMEPE, (Protocol n 35/06) and complied with the requirements of Resolution n 196/96 of the National Health Council, concerning research in human beings [33, 15].
Table 1. Description of the exams used to analyze the 2D and 3D algorithms.
Number of Number of Slice Tomographic Kind of exam images thickness model Pathology
1 908 0.5mm TA Normal
2 297 0.5mm TA Normal
3 685 0.5mm TA Normal
4 760 0.5mm TA Normal
5 229 3.0mm TA COPD
6 278 1.25mm GEMSB Normal 7 267 1.25mm GEMSB Fibrosis 8 239 1.25mm GEMSB Normal
9 276 2.0mm PB Fibrosis
10 296 2.0mm PB Normal
11 597 1.0mm PB COPD
The CT lung images shown in Table 1, were acquired on apex, hilum and on the base of the axial plane, under the following con-ditions: Each slice was1.5mm thick, field of vision was312mm, electrical tension in the tube was120kV, electric current in the tube was200mA, lung window adjustment: centre and width, were -600 and 1-600 HU respectively, the dimension of the reconstructed window was512×512pixels and the voxels had dimensions of 0,585×0,585×1,5mm and were quantified in16bits. 2.2 Automatic CT image lung segmentation using
ACACM
The ACACM method [24] appeared as an evolution of the Crisp Active Contour Method [26] for thorax CT image lung segmenta-tions. The ACACM can identify the edges of objects with concav-ities, projections or bifurcations without restrictions. Therefore the total energy at a pointc(s)of ACACM is given by [24]:
ECRAD[c(s)] =Eintadap[c(s)] +EextCRAD[c(s)], (1) whereEintadapis the internal adaptive energy andEextCRAD is the external Crisp Adaptive energy.
The internal proposed ACACM 2D energy is given by [24]:
associated with each force to adjust the importance of each one of its respective terms in the calculation of the internal energy
Eintadap.
The Balloon Adaptive force uses topology information of the curve to expand the contour. This information is specific for each point, and assumes that the curve possess distinct formats along its topol-ogy. In this way, the Adaptive Balloon force dislocates each point of the curve towards the edges of the object of interest, adapting the topology it is placed onto.
To calculate this new internal force, information based on the coor-dinates of the point of interest of the immediate neighbours and the information based on the form of the curve is obtained. The data of the coordinates of the point of interest of the immediate neighbours is used to calculatFadap. These coordinates are used to determine the mean point of the neighbours, which is used as reference to de-termine the direction ofFadap. The other information is given by the location analysis of this mean point, determining if it is inside or outside the curve.
After finding this topology dataFadapis given by [25]:
Fadap[c(s)] =
p
E2
x+Ey2, (3)
whereExandEycomponents are defined by:
Ex=|x(s)±xm|, (4) and
Ey=|y(s)±ym|, (5) wherex(s)andy(s)are the coordinates of the pointc(s)where
Fadapis being calculated,xmandymare the coordinates of the neighbours mean point. The topology information concerning lo-cation determines the plus or minus sign used in Equations 4 and 5, negative means the point is external to the curve and positive when the point is internal.
Concerning the external energy of the ACACM method, the pro-posed EextCRAD uses the concept of Lung Densities Analysis (LDA) of a neighbourhood applied to the Crisp ACM method [24]. This is done to obtain the percentages of the6uiclasses, in which
ivaries from0to5:
—u0- Hyper aerated (−1000to−950HU) ; —u1- Normally aerated (−950to−500HU); —u2- Poorly aerated (−500to−100HU); —u3- Not aerated (−100to100HU); —u4- Bone (600to2000HU);
—u5- Areas not classified (densities that do not fit with the others). To bypass the external Crisp energy restrictions, this new energy in-corporates a multilayer perceptron artificial neural network (MLP) to determine the origin of each edge found in the thorax CT im-ages. The inputs of this MLP are the 6 percentages of theuiclasses found by the LDA method [26]. Meanwhile there is only one out-put to indicate that the edges found in thorax images are or are not pulmonary walls.
In this method just one hidden layer is used in the topology of MLP is used, and this layer is responsible for solving non linearly sepa-rable problems. Thus, to demonstrate the quantity of neurons in the hidden layer (HN) the solution described by [34] was used:
HN=2×max(M1, M2)
3 , (6)
in wichM1andM2are the quantities of neurons in the input and output, respectively.
The result of Equation6usesM1 as the6percentages of theui classes andM2as the only output to determine if the edge belongs to the lung or not. This results in a6/4/1configuration, in other words,6entry neurons,4neurons in the occult layer and1neuron in the output. The specified topology is verified by the method of cross-validation [16], in which a conjunction of samples is sepa-rated randomly, and one group is used for the training of the neural network and the other for experimental tests, in order to validate the classifier.
The training data were extracted from thorax CT images in the apex, hilum and base positions of patients with COPD, fibrosis and healthy volunteers as described in Section 2.1.
The data for the training phase are selected manually in order to ob-tain a greater representation of different pulmonary structures. On average, 150 pixels were added per image, indicating whether the origin of the edges found by the Sobel operator were from the pul-monary wall or were made up of the bone edges, veins airways, air and other structures. In this training step 500 images from different exams, diseases and levels of cuts were used.
The data of the input group was obtained from aP pixel(xp, yp), wherexpandypare the coordinates of the pixel used in the func-tion f(xp, yp, si), to obtain allui percentages used as input of MLP. The training of the neural network is carried out and tested according to the cross-validation [16].
Using the previously trained MLP, the execution phase of its output is given by the function:
fmlp(u) =
1, when the detected edge constitutes a pulmonary wall and 0, otherwise.
(7) Usingfmlpto determine the origin of the edges found in thorax CT images, the external energyEextCRAD, defined in Equation 1, is given by:
EextCRAD(x, y) =
S(x, y), parafmlp(u) = 1and
1, otherwise, (8)
whereS(x, y)is the Sobel operator, anduis the percentage vec-tor of the LDA method [26], using the coordinates(x, y)of the analyzed pixel.
The external energy of this method is capable of identifying the origin of the edges of fibrosis, emphysema and healthy lungs. This is because MLP has been trained to recognize these patterns, as they are the more common cases seen on lungs in thorax CT images. The MLP adopted by this work was retrained inserting fibrosis that was not used by [24], in thus increasing the scope of applications for this method.
The automatic segmentation of the lungs in thorax CT images uses the automated curve initialization, the addition and the point re-moval methods are described in ACACM [24].
The first step to automatically segment the lung in CT images is to open the DICOM image using the open-source library DCMTK. After that, the external force of the image is calculated using the LDA method and a MLP to detect the origin of the edges obtained by the Sobel operator. The edges detected within the lung are ex-cluded from the external energy, however they are used as the ini-tialization of the curve.
The curve is initialized using the proposed method, in which the false lung edges determine the point of initialization within the lung. This point is a regular polygon centroid used as the initial-ization of the curve.
curve, angle-based point removal and point addition in the curve. In the flowchart this method sequence is called cycles, and the letter
nindicates the order of the results obtained in eachncycle. The curve is labelled stable when the perimeter does not increase after two successive iterations. When this happens, lung segmen-tation is concluded, and the generated polygon is said to be the segmentation result of the object of interest.
2.3 3D visualization
Application Programming Interface (API) Open Graphics Library was used for the 3D visualization. This API is an open specification and multiplatform of a modelling and graphical routine library used for computer graphic applications, such as games and visualization systems [2].
OpenGL is extremely efficient and many of its algorithms are in-stalled in modern graphic hardware [1]. It operates in a similar way to a C library, and provides a number of functions. Normally a pro-gram is based on OpenGL or it is an OpenGL application, which means that it is written in some programming language that calls one or more OpenGL libraries. The OpenGL applications vary from CAD tools to modelling programs used to create cinema characters, such as a dinosaur [1].
Besides basic graphics, such as lines and polygons, OpenGL sup-ports illumination, colouring, texture mapping, transparency and animation, among other special effects. Nowadays, OpenGL is rec-ognized and accepted as an API standard for the development of real time graphical 3D applications [5].
This work used two libraries from OpenGL, GLU and GLUT, both open source. GLU (OpenGL Utility Library) contains numerous routines that uses low level OpenGL commands to execute tasks such as, for an example, define the matrixes for the projection and orientation of the visualization, and rendering of a surface [5]. GLUT (OpenGL Utility Toolkit) is a platform with an independent toolkit that includes graphical interface elements [1].
Thus, the 3D visualization system in this work was developed in C/C++ language, and call routines from the OpenGL library. GLU library is called to render objects, configure their looks and their il-lumination. The GLUT library, which is a multiplatform visualiza-tion system, is used to create windows and receive user commands. To model the 3D objects the data structure was assumed to be a stacked block of 2D data and since the 2D data are images then the 3D data were considered to be a block of piled images. These images have a space between them, which depends on each appli-cation.
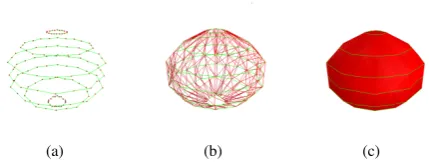
In the specific case of CT imaging, the spacing between images, or planes, is one of the properties stored in the DICOM pattern, de-fined by the Slice Thickness property. The size of a pixel is also specific for each application when these images are modelled in 3D, and in the DICOM pattern, which is determined by the Pixel Spacing property. Using these two parameters it is possible to re-construct a CT exam on the same scale that it was generated. Each plane represents an image, so each plane can have a curve, represented by a determined polygon. As previously seen, these curves are composed of points and are connected with their neigh-bours. Figure 1(a) illustrates the data structure used in this model, where each plane possesses a curve composed of interconnected points. In this Figure the points are presented in red, and the con-nections between them in green.
To render an object in 3D, the points that belong to each plane must be connected to the other layers, and not just to the neighbouring points of their original plane, as in the data structure of the ACACM method. Thus each point of a layer is connected to the two nearest
[image:4.595.327.542.72.154.2](a) (b) (c)
Fig. 1. Rendering stages a) overlapping of the existing curves in each im-age; b) connection of different layers generating triangles; and c) rendered surface.
points of the layer immediately superior to it. This operation gener-ates a net, linking all the layers through traced lines between them. Figure 1(b) presents an example of these connections, in which the lines between points of the same layer are in green, and the lines between points of different layers are in red.
To complete the rendering proposed in this work, the net presented in Figure 1(b) is used to generate the surface of the 3D object. These surfaces are generated by triangles, in which two neighbour-ing points of a layer and the closest point to these in a superior layer compose each triangle. A sample of an object generated this way is shown in Figure 1(c).
Properties such as colour, lighting, texture, including the surface transparency can be configured using the OpenGL library. Therefore the 3D visualization to render objects uses three distinct stages: overlap the curves presented in each image, connect the points of different layers to build triangles and generate surfaces from these triangles.
3. EXPERIMENTAL TESTS AND DISCUSSIONS
In this work, the Adaptive Crisp Active Contour Model is com-pared with the 3D Region Growing method for the segmentation of the lung in CT exams. A total of 11 complete CT thorax exams of healthy, fibrosis and COPD patients were used.
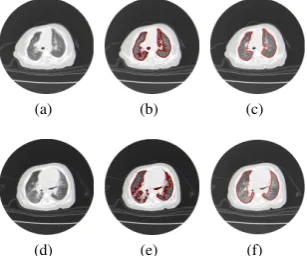
The configuration used in the ACACM is adapted from [24], using the parametersα = 0.6,β = 0.1and τ = 0.3in the compo-sition of the total energy. Figure 2 shows a step-by-step example of the segmentation carried out by this method from the initializa-tion in Figure 2(a) to the stabilizainitializa-tion in Figure 2(f). It is important to mention that each image of a slice of the CT exam possess the initialization of its contour independently of the other slices. Each contour seeks its own stabilization independently according to the flowchart in Figure??. Figure 2 presents the evolution of the con-tour group through 3D visualization proposed in this article. The 3D Region Growing (RG) method uses the same methodology proposed by [23], using the same initialization as in the ACACM method applied in three dimensions, while the adopted neighbour-ing region addition method uses information from the anatomy of the lung, by adding voxels that are in some intensity bracket inside the lung: normally aerated, poorly aerated or hyper aerated. This addition takes place by successive iterations, until stabilization is reached, when no voxel is added.
(a) (b) (c)
[image:5.595.59.288.71.203.2](d) (e) (f)
Fig. 2. Example of the evolution of the ACACM method for the lung segmentation of thorax CT exams: a) initialization b) to c) evolution of the method and f) final result.
minutes. Thus, this automatic implementation of 3D RG makes the fastest method, which makes a lot of authors use this methodology in medical image processing.
(a) (b) (c)
(d) (e) (f)
Fig. 3. Example of the evolution of the 3D RG method for the lung seg-mentation of CT thorax exams: a) initialization b) and c) evolution of the method and d) final result.
The results of the 3D segmentation visualization using ACACM for each slice are shown in pink, following the visualization structure proposed in Section 2.3 using only the 3D contour of the object to build the visualization. The 3D Region Growing segmentation is presented in blue and uses a solid construction of the whole region obtained by this method. Therefore, some of the lighting and shad-owing effects are not the same as the results obtained by the ACM Adaptive Crisp 3D. The construction prevents such effects when using the graphical library OpenGL as in this work.
The segmentation of structures other than the lung, such as the tra-chea, is common with the 3D RG method, as well as the exclusion of pulmonary parts that present diseases such as fibrosis. Thus, to evaluate the results obtained by these two methods, a qualitative evaluation made by two specialists and an evaluation of the pro-cessing time to measure the cost benefit of each method is neces-sary.
3.1 Qualitative evaluation by pulmonology physicians
The segmentation of the 3D method is performed using a complete thorax CT exam, in these kinds of exams the number of images can
vary from one procedure to another, depending on the patients body structure and the thickness of the slice of the DICOM image. Thus, since thorax CT exams vary from 250 to 1000 images, an evaluation of all images by a pulmonologist physician becomes impracticable. Thus, a sample of the images to be analyzed is necessary.
The set of images for analysis was made up of 3 images for each CT exam region, totalling 12 images per exam. As 11 complete exams were used, a total of 132 images were employed in the eval-uation by specialized physicians for the lung segmentation in tho-rax CT exams, corresponding to 264 lungs evaluations. This was accomplished using qualitative metrics due to the impossibility of using quantitative ones, as it would be impracticable for a special-ist physician to manually segment a total of 132 images, which is overly dull, tedious and tiresome.
Therefore a qualitative evaluation was used for the lung segmenta-tion assessment of the 3D Region Growing and ACACM methods. This evaluation consisted of attributing grades to the segmentations of the two methods by the two pulmonologist physicians responsi-ble. The grades attributed have values ranging from 1 to 5:
(1) Worst, no part of the object of interest is found;
(2) Bad, just a small part of the object of interest is obtained; (3) Reasonable, medium quality, with some serious errors; (4) Good, with few errors;
(5) Best, high quality, as good as is required.
The physicians that assessed the results of the said methods are pro-fessors and pulmonologists at the Walter Cantdio University Hos-pital of the Federal University of Cear (UFC), and are nominated physician 1 (M1) and physician 2 (M2).
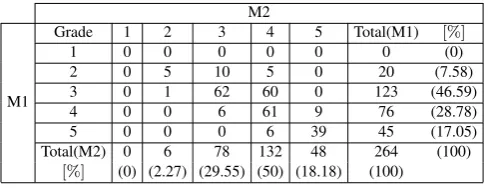
[image:5.595.58.288.301.435.2]The assessment of the physicians here was used to build the Con-tingency Table, also called confusion matrix, for the evaluation of each method. The lines present the assessments of the physician M1 and the columns those of physician M2, for all the 264 lungs analyzed. The contingency tables of the physicians evaluation of 3D Region Growing and the ACACM 2D are shown in Tables 2 and 3, respectively.
Table 2. Qualitative assessment by physicians M1 and M2 for the results obtained by 3D RG.
M2
M1
Grade 1 2 3 4 5 Total(M1) [%]
1 0 0 0 0 0 0 (0)
2 0 5 10 5 0 20 (7.58)
3 0 1 62 60 0 123 (46.59)
4 0 0 6 61 9 76 (28.78)
5 0 0 0 6 39 45 (17.05)
Total(M2) 0 6 78 132 48 264 (100)
[%] (0) (2.27) (29.55) (50) (18.18) (100)
Based on the presented contingency tables it is possible to measure the inter observer concordance, using the kappa index (K) [6]. Thus the value of Kappa obtained through the data in Table 2 is0.464, indicating a moderate agreement between the physicians for the assessment of the 3D Region Growing method.
But for the results obtained by ACACM, the Kappa value obtained through the data in Table 3 is0.614, indicating a substantial agree-ment between the physicians.
[image:5.595.316.563.469.563.2]Table 3. Qualitative assessment by physicians M1 and M2 for the results obtained by ACACM.
M2
M1
Grade 1 2 3 4 5 Total(M1) [%]
1 0 0 0 0 0 0 (0)
2 0 1 0 0 0 1 (0.38)
3 0 0 1 2 1 4 (1.51)
4 0 0 4 201 11 216 (81.82)
5 0 0 0 13 30 43 (16.29)
Total(M2) 0 1 5 216 42 264 (100)
[%] (0) (0.38) (1.89) (81.82) (15.9) (100)
Table 4. Qualitative assessment by physicians M1 and M2 for the results obtained by the 3D
RG and ACACM methods. Classification 3D RG ACACM
method M1[%] M2[%] M1[%] M2[%]
1 0.00 0.00 0.00 0.00
2 7.58 2.27 0.38 0.38
3 46.59 29.55 1.51 1.89
4 28.78 50.00 81.80 81.82
5 17.05 18.18 16.29 15.90
Satisfactory 45.83 68.18 98.11 97.72
The percentage indexes shown in Table 4 for physician agreement show that the assessment results of the 3D RG method are diver-gent. This can be seen in the classifications 3 and 4. In the classifi-cation 3 the physician M1 has46.59%and physician M229.55%, meanwhile in classification 4, the physician M1 has28.78%and physician M250%. This analysis presents the disagreement be-tween the evaluating physicians, and is shown by the Kappa index of 0.464, indicating moderate agreement between them.
The same analysis for the ACACM results concerning the agree-ment between the physicians, and using the percentage index ob-tained from Table 4, shows that the assessment is convergent, and the difference between the physicians is less than1%for all classi-fication levels. This fact is supported by the Kappa index of 0.614, indicating a substantial agreement between them.
However, analyzing the indexes obtained from Table 4 concern-ing the quality of the segmentation results indicates that the two methods for classes 1 and 5 are close. They do not have incidence of class 1 because no doctor assign the worst rating for the result. Meanwhile, the results on class 5, the percentages obtained by the 3D RG method were17.05%and18.18%, a little higher than the ones obtained by ACACM that were16.29%and15.9%, however, the results for classes 2, 3 and 4 are distinct between these methods. In class 4, the results obtained by the 3D RG were 28.78% and50%, indicating that physician M1 observed few mistakes in 28.78%and physician M2 identified50%in this method. However, both physicians obtain the same81.82%for ACACM, indicating an acceptable class (few errors) in more than80%of the images. Considering the serious errors determined by class 3, the results obtained by 3D RG were46.59%and29.55%by ACACM were 1.51%and1.89%, indicating that for ACACM the presence of se-rious errors was less than2%according to both physicians. This does not occur for the 3D RG method, where physician M1 iden-tifies the classification reasonable (serious errors) in46.59%and physician M229.55%.
While for class 2, the results obtained by 3D RG were7.58%and 2.27%and for ACACM they were0.38%and0.38%, indicating that both physicians identified a bad segmentation, as just a small
part of the object of interest was obtained by both methods. The incidence for 3D RG was more significant as it achieved7.58%, in just one image while ACACM produced a percentage index of 0.38%.
Considering the general segmentation quality, two of the classes, class 4 and class 5 were considered satisfactory. These two classes are considered satisfactory because they indicate that the segmen-tations did not possess any flaws or only minor errors, and therefore the physicians can use the results to analyze the internal regions as they are similar to the ideal region or they are the region of interest itself. Besides, any minor errors can be corrected manually. Thus, satisfactory results are obtained by adding classes 4 and 5. Following this the 3D RG method obtained45.83%and68.18%, while the ACACM 2D method obtained98.11%and 97.72% of satisfactory results according to the physicians M1 and M2, respec-tively. Thus the ACACM applied to the 3D segmentation of the lung in thorax CT images is superior to the 3D RG according to the two pulmonology physicians. The ACACM model had only1.89%and 2.28%of unsatisfactory results.
Figures 4 and 5 show some example results of these methods pre-sented by the physicians. One example in Figure 4 shows two dis-tinct classifications presented by the physicians, due to the presence of the hilum and the trachea as pulmonary regions. Physician M1 considered this a serious error and physician M2 considered it a minor error.
Thus in Figure 4 for the 3D RG method physician M1 attributed grade 3 to the lung on the left of the Figure 4(b) due to the presence of the trachea and on both lungs of Figure 4(e) due to the pres-ence of the hilum; however M1 attributed grade 5 to the lung on the right of Figure 4(b). For the ACACM method, physician M1 as-sessed the segmentation results of Figure 4(c) with grade 5 and the results shown in Figure 4(f) with grade 4. The analysis of physician M2 was the same as physician M1, except for the results with the presence of the hilum or trachea to which he attributed grade 4 as this physician consider this to be a minor error.
(a) (b) (c)
[image:6.595.358.513.432.562.2](d) (e) (f)
Fig. 4. Example of the lung segmentation in CT images, a) and d) original images. The hilum is aggregated to the pulmonary region by the 3d RG as seen in b) and e), which does not happen with ACACM; the ACACM results are shown in c), and f).
Other errors in the lung segmentation of the CT images that the physicians disagreed upon are shown in Figure 5, in which, in ad-dition to the error generated by the presence of the hilum or trachea, there was also a lung disease, in this case fibrosis.
(a) (b) (c)
[image:7.595.96.250.73.201.2](d) (e) (f)
Fig. 5. Example of the lung with fibrosis segmentation in CT images, a) and d) original images. The fibrosis region is excluded from the pulmonary region by the 3D RG as seen in b) and e), which does not happen with ACACM; the ACACM results are shown in c), and f).
segmentation, and considered this to be a serious error, as well as the fact that the lung on the left also aggregated the trachea into its region. Also, the physicians assessed the segmentation of the lung on the right of Figure 5(e) with grade 3 as the fibrosis regions were not in the segmentation and this was considered a serious error; and the lung on the left was given grade 2 as only part of the object was segmented because fibrosis was present in the greater part of the lung. For the ACACM 2D method the physicians attribute grade 4 to the lungs on the right of Figures 5(b) and 5(e) but also noted the presence of minor errors and grade 3 to the lungs on the left of the same Figures, due to the presence of some serious errors.
4. CONCLUSION AND FUTURE WORKS
This work proposed a new segmentation methodology for the lungs in thorax CT exams, using a 2D segmentation method and the OpenGL library for a 3D visualization and reconstruction. The 2D segmentation method used is called Adaptive Crisp Active Contours Model that is able to segment both healthy lungs, lungs suffering from emphysema, and lungs with fibrosis. This latter dis-ease is harder to segment as the disdis-eased pulmonary tissue is sim-ilar to healthy pulmonary tissue. This extra ability of this method is possible because the MLP existing in the calculation of the ex-ternal energy of the ACACM method that defines the origin of the pulmonary edges can be adjusted.
The other main contribution of this article is the new method-ology of reconstruction and visualization of lungs in 3D using the OpenGL library. The combination of this methodology with the ACACM method generated a new 3D automated segmentation method of lungs in thorax CT images.
The new methodology of 3D segmentation of the lung is compared with the 3D RG method in the segmentation of thorax CT exams of healthy volunteers and patients with COPD and fibrosis. The results were assessed in a qualitative form by two pulmonologist physi-cians. According to the physicians M1 and M2 3D RG had45.83% and68.18%, while the proposed method had98.11%and97.72% of satisfactory results, respectively. This shows that the proposed method is superior to 3D RG according to both pulmonology physi-cians, and that ACACM has only1.89%and2.28%of unsatisfac-tory results. Thus the physicians M1 and M2 concluded that the proposed method was 2 and 1.5 times better than the 3D Region Growing method, respectively.
The proposed method was also better than the 3D RG method in terms of physician agreement for each method. The proposed method received a substantial concordance, while the 3D RG just had a moderate concordance. This was because the 3D RG method presented errors, such as the hilum and trachea in the pulmonary region, exclusion of part of the lung with disease, and the joining of lungs, among another errors, whereas the proposed method did not. These errors were evaluated in different ways by the two physi-cians, generating a lower agreement than the proposed method. However, the 3D RG method was superior in the processing time by spending half the processing time of the proposed method. This work and the results do not bring an end to this line of re-search. Future works applying other techniques of computational intelligence and pattern recognition to detect lung edges and to in-vestigate and developed methods to recognize disease in lungs or other organs, as well as to adapt the developed methods to detect the pulmonary lobes are still required.
Acknowledgements
The authors acknowledge the financial support and encouragement from CNPq.
The authors thank the Post-Graduate Program in Computer Science from IFCE and Pulmonology and Image of Walter Cantdio Univer-sity Hospital, Federal UniverUniver-sity of Cear.
5. REFERENCES
[1] Dave Astle and Kevin Hawkins.More OpenGl Game Pro-gramming. Thomson, EUA, 2005.
[2] Dave Astle and Kevin Hawkins.Begnning OpenGl Game Pro-gramming. Thomson, EUA, 2nd edition, 2009.
[3] S. Born, Dirkiwamaru, M. Pfeile, and D. Bartz. 3-step seg-mentation of the lower airways with advanced leakage-control. IJCAI 2009 Workshop on Explanation Aware Com-puting, pages 239–255, 2009.
[4] H.S. Campos and A.C.M.A. Lemos. Asthma and copd in view of the pulmonologist.Brazilian Journal of Pulmonology, 35(4):301–309, 2009.
[5] Marcelo Cohen and Isabel Harb Manssour. OpenGl: Uma abordagem pr´atica e objetiva. Novatec, 2006.
[6] R. G. Congalton and K. Green.Assessing the accuracy of re-motely sensed data: Principles and practices. Lewis Publish-ers, New York, 1999.
[7] Jos´e Silvestre Serra da Silva. Lung segmentation on studies CT scanner. Master’s thesis, Department of Electronics and Telecommunications, University of Aveiro, 2005.
[8] Tarique da Silveira Cavalcante. Technique for automatic seg-mentation of airway in computed tomography images of the chest. Master’s thesis, Universidade Federal do Cear´a, Fort-aleza, Cear´a, Brasil, 2010.
[9] R. de Marco, S. Accordini, I. Cerveri, A. Corsico, J. Sunyer, F. Neukirch, N. Kunzly, B. Leynaert, C. Janson, T. Gislason, P. Vermeire, C. Svanes, J.M. Anto, and P. Burney. An inter-national survey of chronic obstrutive pulmonary disease in young adults according to gold stages.Thorax, 59:120–125, Julho 2004.
[11] J. H. S. Felix, P. C. Cortez, M. A. Holanda, and R. C. S. Costa. Automatic segmentation and measurement of the lungs in healthy persons and in patients with chronic obstructive pulmonary disease in ct images. volume 18, pages 370–373, Margarita Island, Venezuela, Outubro 2007. V Latin Ameri-can Congress on Biomedical Engineering 2007, Bioengineer-ing Solutions for Latin America Health.
[12] John Heber S. Felix, P. C. Cortez, M. A. Holanda, D. F. Colac¸o, V.H. C. Albuquerque, and A. R. Alexandria. Lung and chest wall structures segmentation in CT images. pages 291–294. Computational Vision and Medical Image Process-ing (VIPMAGE), Outubro 2007.
[13] John Hebert Silva Felix, Paulo C´esar Cortez, Pedro Pedrosa Rebouc¸asFilho, Auzuir Ripardo de Alexandria, Rodrigo Car-valho Sousa Costa, and Marcelo Alcantara Holanda. Identi-fication and quantiIdenti-fication of pulmonary emphysema through pseudocolors.Lecture Notes in Computer Science, 5317:957– 964, 2008.
[14] John Hebert Silva Flix.Methods of Active Contours in Hilbert 2D image segmentation of lungs in CT of the Chest. PhD the-sis, Department of Computer Engineering, Federal University of Cear, Fortaleza, Cear´a, Brasil, 2011.
[15] Simone Castelo Branco Fortaleza. Acute effects of adminis-tration of continuous positive airway pressure mode noninva-sive about airing of lung parenchyma in patients with chronic obstructive pulmonary disease. Master’s thesis, Department of Clinical Medicine, Federal University of Cear, Fortaleza, CE, 2006.
[16] Simon Haykin.Neural Networks: A Comprehensive Founda-tion. Prentice-Hall, EUA, 2nd edition, 1999.
[17] Shiying Hu, Eric A. Hoffman, and Joseph M. Reinhardt. Au-tomatic lung segmentation for accurate quantitation of vol-umetric X-ray CT images. IEEE Transactions on Medical Imaging, 20:490–498, Junho 2001.
[18] B. Irving, P. TaylorR, and A. Todd-Pokropek. 3D segmenta-tion of the airway tree using a morphology based method. IJ-CAI 2009 Workshop on Explanation Aware Computing, pages 297–307, 2009.
[19] Yoshinori Itai, Hyoungseop Kim, and Seiji Ishikawa. A seg-mentation method of lung areas by using snakes and auto-matic detection of abnormal shadow on the areas. Interna-tional Journal of Innovative Computing Information and Con-trol, 3:277–284, Abril 2007.
[20] Michael Kass, Andrew Witkin, and Demetri Terzopoulos. Snakes: Active contour models. International Journal of Computer Vision, 1:321–331, 1987.
[21] Tan Kok Liang, Toshiyuki Tanaka, Hidetoshi Nakamura, Toru Shirahata, and Hiroaki Sugiura. An automated 3D emphy-sema extraction method using lung CT.SICE Annual Con-ference 2008, pages 3110–3114, 2008.
[22] S. Matsuoka, T. Yamashiro, G.R. Washko, and Y. Kurihara. Quantitative CT assessment of chronic obstructive pulmonary disease.RadioGraphics, 30:55–66, 2010.
[23] P. P. Rebouc¸as Filho, P. C. Cortez, and V. H. C. Albuquerque. 3D segmentation and visualization of lung and its structures using CT images of the thorax.Journal of Biomedical Science and Engineering, 6:1099–1108, 2013.
[24] P. P. Rebouc¸as Filho, P. C. Cortez, J. H. S. Felix, Tarique da Silveira T. S. Cavalcante, and M. A. Holanda. Adaptive 2D crisp active contour model applied to lung segmentation
in CT images of the thorax of healthy volunteers and patients with pulmonary emphysema,.Brazilian Journal of Biomedi-cal Engineering, 29:363–376, 2013.
[25] Pedro Pedrosa Rebouc¸as Filho, Paulo Cesar Cortez, Anto-nio Carlos da Silva Barros, and Victor Hugo Costa de Albu-querque. Novel adaptive balloon active contour method based on internal force for image segmentation - a systematic eval-uation on synthetic and real images.Expert Systems with Ap-plications, pages 7707–7721, 2014.
[26] Pedro Pedrosa Rebouc¸as Filho, Paulo C´esar Cortez, and Marcelo Alcantara Holanda. Active contour modes crisp: new technique for segmentation the lungs in CT images.Brazilian Journal of Biomedical Engineering, 27:259–272, 2011. [27] Rushin Shojaii, Javad Alirezaie, and Paul Babyn. Automatic
lung segmentation in CT images using watershed transform. IEEE International Conference on Image Processing-ICIP,, 2:1270–1273, Setembro 2005.
[28] A. Silva, J. S. Silva, B. S. Santos, and C. Ferreira. Fast pul-monary contour extraction in X-ray CT images: A method-ology and quality assessment. volume 4321, pages 216–224, San Diego, EUA, 2001. Proceding SPIE Conference on Medi-cal Imaging: Physiology and Function from Multidimensional Images, SPIE Digital Library.
[29] Arist´ofane C. Silva, Paulo Cezar P. Carvalho, Rodolfo A. Nunes, and Marcelo Gattass. Segmentation and reconstruc-tion of the pulmonary parenchyma. pages 73–82. VI Work-shop de Inform´atica M´edica - WIM, Maio 2006.
[30] Ingrid Sluimer, Mathias Prokop, and Bram van Ginneken. To-ward automated segmentation of the pathological lung in CT. IEEE Transactions on Medical Imaging, 24(8):1025–1038, Agosto 2005.
[31] J. Tschirren, T. Yavarna, and J.M. Reinhardt. 3D segmenta-tion of the airway tree using a morphology based method. IJ-CAI 2009 Workshop on Explanation Aware Computing, pages 227–238, 2009.
[32] WHO. Global strategy for the diagnosis, management and prevention chronic obstrutive pulmonar disease. Technical re-port, World Health Organization, 2014.
[33] Ge´orgia Freire Paiva Winkeler. Acute effects of administra-tion of continuous positive airway pressure mode not about invasive pulmonary parenchyma of healthy volunteers in supine and prone positions: Changes in high resolution com-puted tomography. Master’s thesis, Department of Clinical Medicine, Federal University of Cear, Fortaleza, 2006. [34] X.C. Yin, C.P. Liu, and Z. Han. Feature combination using