Combining Gene-Phenotype Association Matrix with
KEGG Pathways to Mine Gene Modules
Using Data Set in GAW17
Hua Lin
*, Yang Zheng, Ping Zhou
Biomedical Engineering Institute of Capital Medical University, Beijing, China Email: *[email protected]
Received August 2013
ABSTRACT
Currently, genome-wide association studies have been proved to be a powerful approach to identify risk loci. However, the molecular regulatory mechanisms of complex diseases are still not clearly understood. It is therefore important to consider the interplay between genetic factors and biological networks in elucidating the mechanisms of complex dis-ease pathogenesis. In this paper, we first conducted a genome-wide association analysis by using the SNP genotype data and phenotype data provided by Genetic Analysis Workshop 17, in order to filter significant SNPs associated with the diseases. Second, we conducted a bioinformatics analysis of gene-phenotype association matrix to identify gene mod-ules (biclusters). Third, we performed a KEGG enrichment test of genes involved in biclusters to find evidence to sup-port their functional consensus. This method can be used for better understanding complex diseases.
Keywords: Gene Modules; KEGG Pathways; Biclusters
1. Introduction
It is well known that genome-wide association studies (GWAS) have become an increasingly effective tool to identify genetic variation associated with the risk of complex disease. However, in this case, univariate sin-gle-locus association analyses may not be the most ap-propriate strategy. Instead, many multivariate methods that were used for identifying causal loci have been de-veloped rapidly. Gauderman et al [1] induced a princip-al-components method to assess whether multiple SNPs within a candidate are associated with disease. In fact, it is suggested that gene-gene interaction or gene modules (gene–gene networks) may play important roles and pro-vide more information. Xiaoqi Cui et al [2] proposed a new combinatorial association test incorporating multiple traits at the same time to detect gene-gene interaction unlike other general methods for studying gene-gene interaction. In addition, there are some attempts to inte-grate the biological knowledge (e.g., Gene Ontology and KEGG pathways) into the genomics field. For example, Iossiov et al. [3] predicted pathways or networks of inte-racting genes that contribute to common heritable dis-orders by combining the standard genetic linkage for-malism with whole-genome molecular-interaction data. Furthermore, many gene set analysis methods, such as
GeneTrail (http://genetrail.bioinf.uni-sb.de/) and GSEA [4], are used to detect disease-related risk pathways or gene modules. These methods integrate heterogeneous data to elucidate biological mechanisms, which is an essential and challenging problem in systems biology.
In this paper, we conducted a genome-wide associa-tion analysis by combining the SNP genotype data with the phenotype data to filter significant SNPs associated with the diseases. Then, further bioinformatics analysis to gene-phenotype association matrix was used to identi-fy gene biclusters (gene modules). A KEGG enrichment test of genes involved in biclusters was applied to find whether they were functional aggregated. This method can be used for better understanding complex diseases.
2. Methods
2.1. Materials
The GAW17 data consisted of two data sets. One con-sists of a collection of 697 unrelated individuals and their genotypes and phenotypes. These are subjects from the 1000 Genomes Project. The second data set is comprised of 697 individuals in eight extended families and their genotypes and phenotypes. The 202 founders in the fam-ily data set were chosen at random from the set of unre-lated individuals. The extended families are loosely based on the families from previous GAWs. SNP
types were obtained from the sequence alignment files provided by the 1000 Genomes Project for their pilot3 study (http://www.1000genomes.org). There is a total of 24487 SNPs, all of which are autosomal. A total of 200 replicates (phenotypes) of the trait simulation were car-ried out in both data sets. In this paper, we only selected the disease status (coded 0 = no, 1 = yes) of the first ten replicates as dichotomous disease phenotype to perform our analysis.
2.2. Data Preprocessing
Plink software can be used to calculate the association of genome-wide SNPs with the phenotypes. Here, all of p-values were used to construct gene-phenotype associa-tion matrix. This matrix is 24487 × 10 (SNPs × number of phenotypes) matrix. We performed bioinformatics analysis by using the bicluster method to this matrix in the following step.
2.3. Applying Bicluster Method to
Gene-Phenotype Association Matrix
A bicluster is a subset of the SNPs exhibiting consistent association strength over a subset of the phenotypes. We applied Statistical-Algorithmic Method for Bicluster Analysis (SAMBA) algorithm [5] to detect significant biclusters from our constructed gene-phenotype associa-tion matrix. This algorithm includes three phases. In the first phase, the bipartite graph was formed and vertex pair weights were calculated using weighting methods. In the second phase, the hashing technique was applied to find the heaviest bicliques in the graph. In the last phase, a local procedure on the biclusters in each heap was per-formed. We used Expander software (http://acgt.cs.tau. ac.il/expander/) to implement this algorithm.
2.4. Functional Gene Modules Mining in
Combination with KEGG Pathway
To see if the genes significantly aggregating in extracted, biclusters are also aggregating in functional categories, we performed a KEGG enrichment test. For a given KEGG pathway, a gene is either in this pathway or not in this pathway. We suppose that a total of N (=3205) genes for the analyzed data are presented in KEGG pathways in which a set of genes in biclusters are significantly ag-gregated. We applied GeneTrail software (http://genetrail. bioinf.uni-sb.de/) to identify functional gene modules (gene biclusters) enriched on KEGG pathways signifi-cantly. In this study, to avoid the possible loss of the true positives, the multiple test correction was not performed and the p-value quoted should be considered as a heuris-tic measure, useful as an indicator that roughly rates the relative enrichment of significantly aggregated genes for
each KEGG pathway.
3. Results
3.1. Constructing Gene-Phenotype Association
Matrix
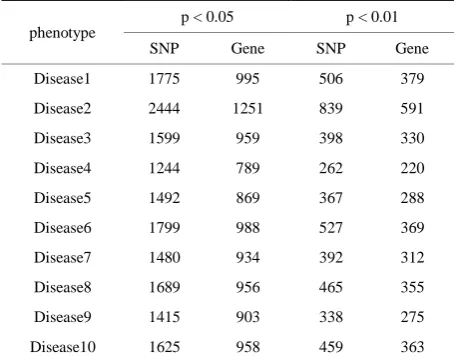
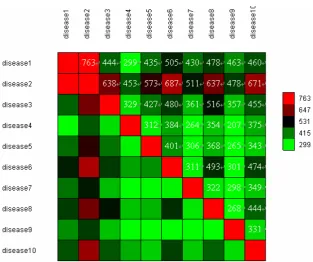
Of 22487 genome-wide SNPs, we found 1775, 2444, 1599, 1244, 1492, 1799, 1480, 1689, 1415 and 1625 SNPs are significantly associated with disease1-dis- ease10, respectively according to p < 0.05. Table 1 shows the distributions of the number of significant SNPs (genes) associated with diseases in terms of p < 0.05 and p < 0.01. We found that there are more signifi-cant overlapping SNPs between disease1 and disease2 than that of between any of other two diseases (See Fig-ure 1). Further look at the pool of significant SNPs, only C10S2297 (FRMPD2) was shared by all of ten diseases (phenotypes), thus likely to be associated with some of complex diseases. In fact, Nina Stenzel et al [6] approved that the down regulation of FRMPD2 protein in Caco-2 cells is associated with an impairment of tight junction formation.
Additionally, it is noted that at the level of 0.05 the number of significant association was dramatically re-duced as the increasing of the number of diseases (See Figure 2).
3.2. Biclustering to Gene-Phenotype Association
Matrix
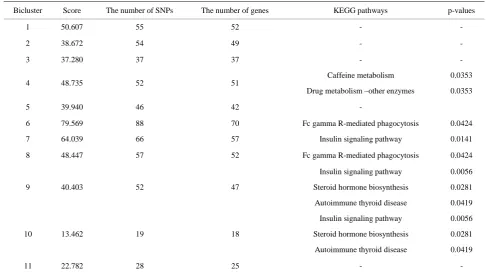
[image:2.595.309.538.550.731.2]We applied Statistical-Algorithmic Method for Bicluster Analysis (SAMBA) algorithm to detect biclusters from our constructed gene-phenotype association matrix. All parameters were selected as default. As a result, a total of 11 biclusters were acquired (See Table 2). Each bicluster includes at least 18 genes. The scores given in the second
Table 1. The number of significant SNPs associated with ten diseases according to p < 0.05 and p < 0.01.
phenotype
p < 0.05 p < 0.01
SNP Gene SNP Gene
Disease1 1775 995 506 379
Disease2 2444 1251 839 591
Disease3 1599 959 398 330
Disease4 1244 789 262 220
Disease5 1492 869 367 288
Disease6 1799 988 527 369
Disease7 1480 934 392 312
Disease8 1689 956 465 355
Disease9 1415 903 338 275
Disease10 1625 958 459 363
Figure 1. The number of significant overlapping SNPs between any of two diseases. (The number of significant overlapping SNPs between any of two phenotypes (diseases) is depicted by a color cell, where the red colour indicates that the greater number of overlapping SNPs is shared by two different diseases).
Figure 2. The trendy of the number of significant overlapping SNPs as the increasing of the number of diseases (phenotypes). (The transverse axis stands for the first k (k = 2, 3 …10) phenotypes which were used to be compared and the longitudinal one denotes the number of overlapping significant SNPs shared by them).
column of Table 2 were acquired by the SAMBA algo-rithm and they are size-dependent, thus, it is not recom-mended to use them to compare the quality of two bic-lusters of different sizes. Further bioinformatics analysis will identify functional biclusters enriched on KEGG pathways significantly.
3.3. Performing KEGG Enrichment Test
[image:3.595.149.446.393.615.2]Table 2. Extracted biclusters and their enrichment effect on KEGG pathways.
Bicluster Score The number of SNPs The number of genes KEGG pathways p-values
1 50.607 55 52 - -
2 38.672 54 49 - -
3 37.280 37 37 - -
4 48.735 52 51
Caffeine metabolism 0.0353
Drug metabolism –other enzymes 0.0353
5 39.940 46 42 -
6 79.569 88 70 Fc gamma R-mediated phagocytosis 0.0424
7 64.039 66 57 Insulin signaling pathway 0.0141
8 48.447 57 52 Fc gamma R-mediated phagocytosis 0.0424
9 40.403 52 47
Insulin signaling pathway 0.0056
Steroid hormone biosynthesis 0.0281
Autoimmune thyroid disease 0.0419
10 13.462 19 18
Insulin signaling pathway 0.0056
Steroid hormone biosynthesis 0.0281
Autoimmune thyroid disease 0.0419
11 22.782 28 25 - -
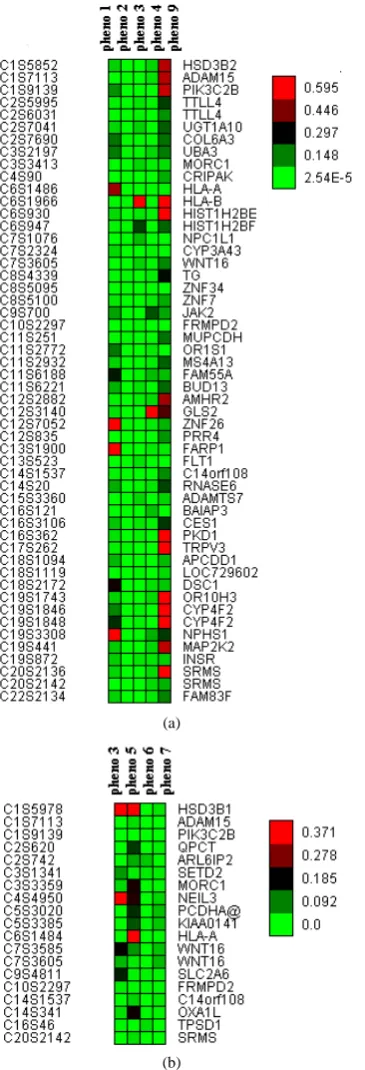
significantly function aggregated genes. We found that more than half of the biclusters (54.5%) were signifi-cantly enriched on KEGG pathways. Table 2 lists the significantly (nominal p ≤ 0.05) enriched KEGG path-ways. It is interesting to note that the majority of the enriched KEGG pathways relate to insulin signaling, autoimmune thyroid disease and Fc gamma R-medidated phagocytosis. It is noteworthy to look at a highly aggre-gated genes included in bicluster 9 (See Figure 3), three of which (HLA-A, HLA-B and TG) have direct relev-ance to immunology. Fred Sanfilippo et al [7] indicated that good HLA-A and B matching is highly dependent on a system for sharing organs among institutions, and re-sults in decreased graft rejection, better long-term graft function, and less need for post-transplantation immuno-suppression. Another example, genes HSD3B2 and UGT1A10 included in bicluster 9 were insulin-related. Goldy Crabunaru et al [8] tested the hypothesis that HSD3B deficiency in hyperandrogenic females (HF) is related to insulin-resistant polycystic ovary syndrome (PCOS), and Katriina Itaaho et al [9] shed new light on the structure and function of UGT1A10 which can cata-lyze dopamine glucuronidation at substantial rates, yiel- ding both dopamine-4-O-glucuronide and dopamine-3- O-glucuronide.
4. Discussions
This study is the attempt to relate the functional aggrega-
(a)
[image:5.595.86.269.86.622.2](b)
Figure 3. The heatmap of bicluster 9(a) and bicluster 10(b). (The p-values of gene-phenotype association are depicted by cells with different colours, where the green colour indicates the significant association between gene and disease (phe-notype)).
5. Conclusion
In this paper, we conducted a genome-wide association analysis by combining the SNP genotype data with the
phenotype data to filter significant SNPs associated with diseases. Further bioinformatics analysis revealed that aggregated genes in biclusters tended to aggregate on some KEGG pathways and to be functional association.
6. Acknowledgements
We thank reviewers for their valuable comments and suggestions.
This work is supported by the National Natural Science Foundation of China (Grant Nos. 31100905) and the Science Technology Development Project of Beijing Municipal Commission of Education (SQKM 201210025008). This study is also funded by the excel-lent taexcel-lent cultivation project of Beijing (2012D 005018000002) and the young backbone teacher’s culti-vation project of Beijing Municipal Commission of Edu-cation, and supported by the foundation-clinical coopera-tion project of capital medical university (11JL30, 11JL33 and 12JL75).
REFERENCES
[1] J. Gauderman, C. Murcray, F. Gilliland and D. Conti, “Testing Association between Disease and Multiple SNPs in a Candidate Gene,” Genetic Epidemiology, Vol. 31, No. 5, 2007, pp. 383-395.
[2] X. Cui, Q. Sha, S. Zhang and H.-S. Chen, “A Combina-torial Approach for Detecting Gene-Gene Interaction Us-ing Multiple Traits of Genetic Analysis Workshop 16 Rheumatoid Arthritis Data,” BMC Proceedings, Vol. 3, Suppl. 7, 2009, p. S43.
[3] I. Iossifov, T. Zheng, M. Baron, T. C. Gilliam and A. Rzhetsky, “Genetic-Linkage Mapping of Complex Here-ditary Disorders to a Whole-Genome Molecular-Interac- tion Network,” Genome Research, Vol. 18, 2008, pp.
1150-11
[4] M. Holden, S. Deng, L. Wojnowski and B. Kulle, “GSEA- SNP: Applying Gene Set Enrichment Analysis to SNP Data from Genome-Wide Association Studies,” Bioin-formatics, Vol. 24, No. 23, 2008, pp. 2784-2785.
[5] A. Tanay, R. Sharan and R. Shamir, “Discovering Statis-tically Significant Biclusters in Gene Expression Data,” Bioinformatics, Vol. 18, Suppl. 1, 2002, pp. 136-144.
[6] N. Stenzel, C. P. Fetzer, R. Heumann, S. Kai, “PDZ-Do- main-Directed Basolateral Targeting of the Peripheral Membrane Protein FRMPD2 in Epithelial Cells,” Journal of Cell Science, Vol. 122, 2009, pp. 3374-3384.
[7] F. Sanfilippo, W. K. Vaughn, E. K. Spees, J. A. Light and W. M. LeFor, “Benefits of HLA-A and HLA-B Matching on Graft and Patient Outcome after Cadaveric-Donor Renal Transplantation,” The New England Journal of Medicine, Vol. 311, No. 6, 1984, pp. 358-364.
Hop-wood, F. Ziai, Y. T. Chang, S. Myers, J. Mason and S. Pang, “The Hormonal Phenotype of Nonclassic 3β-Hy- droxysteroid Dehydrogenase (HSD3B) Deficiency in Hyperandrogenic Females Is Associated with Insulin- Resistant Polycystic Ovary Syndrome and Is Not a Va-riant of Inherited HSD3B2 Deficiency,” The Journal of Clinical Endocrinology & Metabolism, Vol. 89, No. 2, 2003, pp. 783-794.
[9] K. Itäaho, M. H. Court, P. Uutela, R. Kostiainen, A. Ra-dominska-Pandya, M. F. Dopamine, “Is a Low-Affinity
and High-Specificity Substrate for the Human UDP-Glu- curonosyltransferase 1A10,” Drug Metabolism & Dispo-sition, Vol. 37, No. 4, 2009, pp.768-775.
[10] Y. Zhu, A. Hoffman, X. Wu, H. Zhang, Y. Zhang, D. Leaderer and T. Zheng, “Correlating Observed Odds Ra-tios from Lung Cancer Case-Control Studies to SNP Functional Scores Predicted by Bioinformactic Tool,” Mutation Research, Vol. 639, No. 1-2, 2008, pp. 80-88.