The Hidden Risk Factor
J. H. Witte, D. Ples, J. Corominas
Record Currency Management, Windsor, UK
Email: [email protected], [email protected], [email protected]
Received July 19, 2013; revised August 21, 2013; accepted September 10, 2013
Copyright © 2013 J. H. Witte etal. This is an open access article distributed under the Creative Commons Attribution License, which permits unrestricted use, distribution, and reproduction in any medium, provided the original work is properly cited.
ABSTRACT
To achieve maximum returns consistent with an investor’s appetite for risk, the correct identification and estimation of all relevant risk factors in a portfolio are necessary. In this paper, we identify the role of foreign currency as an impor- tant risk factor from an international investor’s point of view.
Keywords: Currency Risk; Risk Premium; Risk Factor; FX Hedge; Currency Overlay
1. Introduction
It has been noted repeatedly (cf. [1]) that, since the start of the financial crisis in 2007, global asset correlation has been increased steadily. This effect has made it much harder for portfolio managers to achieve performance
alpha by skillfully selecting superior investment oppor-
tunities. In order to outperform in such a world (cf. [2]), investors have to correctly identify and characterise the available risk premia, and build a portfolio that matches their appetite for risk while attempting maximum diver- sification (cf. [3,4]).
A risk factor is usually understood to be any variable that contributes to explaining the composition of the total portfolio risk. This means that if we can decompose the total portfolio risk into different components, i.e., the dif-
ferent risk factors, then this will give us a clearer under- standing of where our existing risk originates. More im- portantly, it allows us to analyse the risk premia of the different risk factors, and enables us to make sure that these are consistent with our overall requirements for diversification and appetite for risk.
In a sense, a risk factor analysis reverses the view taken by Markowitz’s modern portfolio theory (cf. [5,6]). In a Markowitz setting, an investor makes his investment decisions ex ante, based on his expectations about the
statistical properties of the individual assets under con- sideration. In contrast, in a risk factor analysis, we look at the portfolio ex post, attempting to describe the total
portfolio risk as accurately as possible by decomposing it into the different drivers of risk, the main risk factors. This enables us to observe effects that show a big impact only if considered in aggregate in a large portfolio.
In this paper, we show that currency is an important risk factor to an international investor, and we emphasise that any change in an investor’s international currency position may increase or decrease the total portfolio risk, depending on market circumstances. Therefore, the re- ward/risk ratio induced by currency, in line with classic risk factors such as equities, inflation, and credit, has to be regarded as indicative for investment performance. In particular, we attempt to quantify the extent to which such change would impact portfolio risk.
The effect of currency on international investments has been widely studied in the literature. In [7], it is discuss- ed how country factors affect stock prices far more than, e.g., market sectors and industries, and most of this dif- ference can be attributed to currency (see also [8]). In [9], the currency risk premium is compared to market risk premium, and the interaction between the two is analysed; in some ways, this is a first step towards the more recent studies on the marginal contribution of specific risk fac- tors.
Over the past decade, we have also seen an expansion in the literature on risk factors and the calculation of marginal risk contributions to portfolio risk, as investors have become increasingly concerned with downside man- agement (see for example [1,2,10-12]) and have recog- nised the need for an improved understanding of the im- pact of risk factors.
preted in our framework. In Section 5, we apply our meth- odology to a representative international portfolio, and we compare the risk factor impacts of the most com- monly studied risk factors. We demonstrate that, empiri- cally, currency is an important risk factor to an interna- tional investor. We conclude by summarising our find- ings in Section 6.
2. Defining a Risk Factor
Consider a portfolio of return sources, and consider an investor who is holding this portfolio with the aim of maintaining or increasing its value over some future time horizon. In this setting, we define risk as follows.
Definition 1.Riskisthe (exposureto) thepossibilityof unpredicted portfolio moves; every chance or situation involvingsuchapossibility.1
Hence, risk is defined based on unexpected changes to our portfolio value. We then move on to very generally defining a riskfactor as anything providing us with
in-formation about our portfolio risk.
Definition 2. A risk factor is a variable associated withthemagnitudeofportfoliorisk.2
We emphasise the following corollary, which is at times overlooked.
Corollary 1. Risk factors are correlational, not nec- essarilycausal. Correlationdoesnotimplycausation.
For example, a fund manager who is fully invested in shares of a single company will not necessarily under- perform in a group of more diversified managers. He is merely more likely to underperform due to higher vola- tility, but his lack of diversification does not imply un- derperformance (e.g., imagine he had bought shares in Apple or Google early on).
3. The Risk Factor Challenge
In the previous section, we have very generally intro-duced the notion of risk and risk factor. We will now
explain how portfolio risk can be analysed by studying a portfolio’s risk factors.
3.1. Risk Factor Decomposition
We start by introducing what we understand to be a risk factordecomposition of a given portfolio.
Definition 3.Supposeourportfolioreturnisdescribed bytherandomvariable . Ariskfactordecomposition is any finite number of random variables
X
1, , N
X X
andscalarvalues 1, ,N suchthat
1 .
N i i i
X
X (1)Inthiscase, theportfoliovarianceisgivenby
2 2 2
, ;
2 ,
i i
X i i X i k i k i k X Xk ik
where ik isthecorrelation coefficientof Xi and Xk, and Xi is the standard deviation of Xi. We denote theportfolioriskby X .
Remark 1.Onewayofconstructingarisk factorde- composition as given in Equation (1) is to consider
1, , N
X X asthereturnsoftheindividualassetsinour portfolio, with 1, ,N
X
denoting therespective weights oftheexposure. However, thisisbyno meansaunique
decompositionof .
In Section 5, we will explain how to also analyse other risk factors, such as inflation and credit. Any decomposi- tion into return sources can form a foundation for a risk factor analysis.
Remark 2.ByEquation (1), ariskfactordecomposi- tiondoesnotallowforanypurelycorrelationalriskfac- tors, asthesedonotaddtotheinformationcontainedin thecausationalfactors. Putdifferently, thismeansthata risk factor which has no impact on portfolio volatility willnotbeadmittedinthedecomposition.
3.2. Risk Factor Impact
To measure the particular effects of the different risk fac- tors on our total portfolio risk, we come to define what we understand to be the riskfactorimpact.
We aim to measure risk impact of a factor Xk by
taking into account the following three aspects. 1) Weight k: exposure to Xk.
2) Volatility
k X
: volatility of Xk.
3) Correlation ik,ik: relationship to the other fac-
tors X ii, k.
In detail: we want the risk factor impact to increase/ decrease in accordance with weight or volatility; and we
want the risk factor impact to increase and decrease,
respectively, with positive and negative cumulative cor- relation to the other risk factors. Our mathematical defi-
nition is as follows.
Definition 4: Considerthe risk factor decomposition
(1). Wedefinetheimpactofriskfactor Xk tobe
2
1
: .
k i k
X
k k X i k i X
k X
X ik (2)From Equation (2), we see how k generally respects
the desired characteristics listed in 1), 2), and 3).
More specifically, since k is the partial derivative of
X
by k, it measures the rate of change of the
portfolio volatility X in response to small changes
in the weight k. In other words, it is the marginal risk
contribution of factor Xk. We will clarify this property in
Section 4.
3.3. A Two Asset Portfolio
Consider a portfolio return X 1X12X2, consist-
ing of the returns X1 and X2 of two assets, with
weights 1 and 2 1 1, respectively. The portfolio
variance is given by
1 2 1
2
1 1 2 2
2 2 2 2
1 2 1 2
Var
2 ,
X
X X X
X X
X2
where denotes the correlation coefficient of X1 and 2
X , and we have
i i
X
i i X k
X k X
(3)
for
i k, 1, 2 , ik.Example 1.Suppose 1 and X1 X2. Wehave
1 2.
Hence, for equally volatile and perfectly correlated riskfactors, theriskfactorimpactsareidentical.
Suppose 1. Inthiscase, wehave
1 1
2 2
1 2 1
4 . X X X X
Hence, inaportfoliowithtwoperfectlyanticorrelated assets, the difference between the risk factor impacts scaleslinearlywiththeweight 1.
Suppose 0. Inthiscase, Equation (3) becomes
1 1
2 2
1 2 1
2 . X X X X
(4)
In a portfolio with two perfectly independent assets thatare equallyvolatile, theallocation 1 betweenthe twoassets linearlydetermineswhich ofthe twohasthe higherimpact.
Suppose X3 is a third asset with weight 31. Suppose X3isindependentof X1 and X2. Supposethat
1
X and X2 arecorrelatedby 0, andthat
1 2
X X X3
. Inthiscase, wehave
1
1 1
2
2 2
3 1 1 2 1
1 . X X X X X
Weobservethat, because X1 iscorrelatedwith X2, theriskfactorimpactof X1 isgreaterthanthatof X3.
Inotherwords, ifweaddathirdassettoourportfolio which isstrongly correlatedwith oneofthe two we al-ready have, thenthe third asset will have ahigher risk impactthanifitwasslightlycorrelatedorindependent.
Example 2.Suppose 12. Wehave
1 22 2
1
1 2 X X .
X
2 (5)Hence, fortwoequallyweightedassets, the difference
between the risk factor impactsscales linearlywith the difference in variance, independently of the correlation coefficient.
Suppose, inaddition, that X1 X . Wehave
1 2.
Hence, fortwoequallyvolatileassetswithequalweights, theriskfactorimpactsareidentical, independentlyofthe correlationcoefficient. This isdesireable since, all else being equal, the correlation coefficient contains no in- formation that can be usedto measure the relative im- pactsoftheindividualriskfactors.
4. What a High Risk Factor Impact Means
Suppose our portfolio return is described by the random variable . Suppose we have a risk factor decomposi- tion X 1 . N i i i
X
XRemark 3. Consider two risk factors Xi and Xk withimpacts i and k, respectively. Suppose i k. In this case, adding a small quantity to the weight of
i
X will add more risk to our portfolio than increasing the weight of Xk by the same quantity. The opposite effectholdswhendecreasingtheweightbysmallquanti- ties.
We present this property more rigorously in the fol- lowing theorem.
Theorem 1. Consider two risk factors Xi and Xk withimpacts i and k, respectively. Suppose i k. Then, thereexistsathreshold h*0 suchhat
, i , k and , i ,
X h X h X h Xk h
(6)
forall 0 h h*, where X,kh denotesthe standard deviationof
.i i k k
i k
X
X h XProof. Suppose X is differentiable with respect to i
and k, respectively. Wehave
, 0 , 0 lim lim . i k
X h X
X i
h i
X h X X
k h k h h
Let 0 such that i k 20. There exists suchthat * 0 h , , , i k
X h X X h X
h h
5. Analysis of an International Portfolio
We now come to apply the risk factor methodology in- troduced in this paper to an actual investment scenario. We study two sample portfolios as outlined below; in
Tables 1 and 2, we indicate return sources, data sources,
and weights.
For each of the two sample portfolios, we derive a risk factor decomposition and compute the marginal risk con- tributions of a series of pre-defined risk factors. We pro- ceed as follows.
We analyse the following risk factors; our choice is driven by the risk premia we believe investors are seek- ing to exploit3.
International Equity
Currency
Cash
Domestic Equity
Inflation (Duration + Term Premium)
Credit
Commodities
Certain risk factors are not directly investible in the sense that they depend on two or more carrier assets to be identified. This is the case with inflation, credit, and cur- rency. Still, they are important risk factors when making
forward looking judgements about markets within a Global Tactical Asset Allocation (GTAA) framework, for in- stance. We capture these by rewriting the equations as
Currency = Int. Equities − Hedged Int. Equities Inflation = Government Bonds − Cash
Credit = Corporate Bonds − Government Bonds
This decomposition helps bring to light certain risk factors which would otherwise not be directly observable and quantifiable in an appropriate manner since they are embedded in other asset classes, yet can represent a sub- stantial risk to the portfolio. Currency is our main exam- ple here.
Based on the monthly returns of the listed indices, we compute a rolling standard deviation and correlation for all factors, using a 12 months look back window. In other words, for every month, we estimate k and ik from
the previous 12 data points, 1 , Together with the weights k
9
.
i k
, , indicated in Tables 1 and 2,
we then have all required information to calculate the risk factor impacts k
1 k 9
, , on a monthly basis, following Equation (2).
1 k 9
Our monthly data set starts in January 1994 and ends in June 2012. We rebalance our sample portfolio monthly to maintain the constant weights given in Tables 1 and 2.
How to interpret each risk factor? To make the de-
composition intelligible in a single framework, Figures 1
and 2 illustrate the size of each risk factor relative to the
total size of all risk factors: it shows the absolute mar-ginal risk contribution of each risk factor relative to the aggregate measure of such absolute marginal risk con-tributions (see also Table 3).
In mathematical terms, Figures 1 and 2 show our
monthly values for
1 9
, 1 9,
k i i
k
(7)describing the evolution of the relative absolute magni- tude of all risk factor impacts over time.
[image:4.595.309.540.319.428.2]Remark 4.Unlikethenotionofriskfactorimpact k, introduced in Section 3.2, the absolute values k showninFigures 1and2donotcontainanydirectional
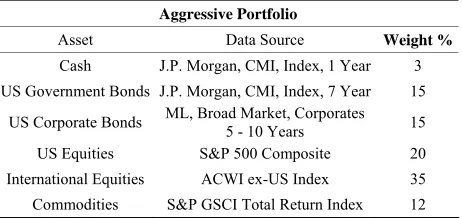
Table 1. Allocation and data source. Aggressive sample portfolio.
Aggressive Portfolio
Asset Data Source Weight %
Cash J.P. Morgan, CMI, Index, 1 Year 3 US Government Bonds J.P. Morgan, CMI, Index, 7 Year 15
US Corporate Bonds ML, Broad Market, Corporates 5 - 10 Years 15
[image:4.595.309.540.467.576.2]US Equities S&P 500 Composite 20 International Equities ACWI ex-US Index 35 Commodities S&P GSCI Total Return Index 12
Table 2. Allocation and data source. Defensive sample port- folio.
Defensive Portfolio
Asset Data Source Weight %
Cash J.P. Morgan, CMI, Index, 1 Year 5 US Government Bonds J.P. Morgan, CMI, Index, 7 Year 35
US Corporate Bonds ML, Broad Market, Corporates 5 - 10 Years 15
[image:4.595.309.538.644.736.2]US Equities S&P 500 Composite 20 International Equities ACWI ex-US Index 20 Commodities S&P GSCI Total Return Index 5
Table 3. Based on monthly returns, we compute a rolling standard deviation and correlation for all factors, using a 12 months look back window. We then compute the risk factor impacts on a monthly basis. In the table below, we see the June 2012 values for the defensive sample portholio.
Risk Factor k
1 i9iHedged Int. Equity 7.49% 0.0028 0.0028 44.38%
Currency 2.65% −0.0003 0.0003 4.9% Domestic Equity 5.83% 0.0021 0.0021 32.96%
Inflation 3.12% −0.0006 0.0006 8.91%
Credit 1.14% 0.00004 0.00004 0.7% Commodities 3.42% 0.0005 0.0005 8.11% 3It is important to note that there is no single unique risk factor
Figure 1. Risk factor impacts. Aggressive sample portfolio.
Figure 2. Risk factor impacts. Defensive sample portfolio.
information.
The absolute values in Equation (7) indicate the mag- nitude to which changes in the exposure to different risk factors affect the total volatility of investment
performance. It serves as an index of risk relevance.
The directionality says whether an increased exposure to a risk factor results in an increased or decreased over- all volatility. It can only be meaningfully evaluated when studying the risk factor impact in conjunction with the expected returns of the different factors. In that case, the risk factor impacts can serve as a starting point for re- calibration of portfolio weights.
6. Conclusions
In this paper, we have introduced a theoretical frame- work for risk factor analysis. We have introduced the risk factorimpact as
change in portfolio risk , change in weight of factor
k
k
which presents a unique way of understanding the effects
of risk factor weights on the total portfolio risk. Our measure of risk factor impact is identical to the marginal risk contribution, and we provide a rigorous account why this measure is of relevance and how to interpret it.
By studying a representative global portfolio, we have empirically analysed the different risk factor impacts with particular focus on currency. We find that an interna- tional investor’s currency exposure is one of the most impactful risk factors. This suggests that currency expo- sure, in line with classic risk factors as domestic and in- ternational equities, inflation, credit, and commodities, is indicative of future investment performance. Hence, cur- rency exposure, together with all assets in a portfolio, should be given thoughtful and prudent risk and return analysis to help guide an investor’s expectations.
REFERENCES
[1] S. Page and M. Taborsky, “The Myth of Diversification: Risk Factors versus Asset Classes,” JournalofPortfolio Management, Vol. 37, No. 4, 2011, pp. 1-2.
http://dx.doi.org/10.3905/jpm.2011.37.4.001
[2] D. Rosen and D. Saunders, “Risk Factor Contributions in Portfolio Credit Risk Models,” Journal ofBanking and Finance, Vol. 34, No. 2, 2010, pp. 336-349.
http://dx.doi.org/10.1016/j.jbankfin.2009.08.002
[3] J. Lintner, “The Valuation of Risk Assets and the Selec- tion of Risky Investments in Stock Portfolios and Capital Budgets,” TheReview ofEconomics andStatistics, Vol. 47, No. 1, 1965, pp. 13-39.
http://dx.doi.org/10.2307/1924119
[4] O. Ruban and D. Melas, “Risk Parity Portfolios: Rebal- ance, Leverage, Or Both?” TheJournalofInvesting, Vol. 20, No. 1, 2011, pp. 99-108.
http://dx.doi.org/10.3905/joi.2011.20.1.099
[5] H. M. Markowitz, “Portfolio Selection,” TheJournal of Finance, Vol. 7, No. 1, 1952, pp. 77-91.
[6] H. M. Markowitz, “Portfolio Selection: Efficient Diversi- fication of Investments,” John Wiley & Sons, New York, 1958.
[7] J. Diermeier and B. Solnik, “Global Pricing of Equity,” FinancialAnalystsJournal, Vol. 57, No. 4, 2001, pp. 37- 47. http://dx.doi.org/10.2469/faj.v57.n4.2464
[8] J.-F. L’Her, O. Sy and M. Y. Tnan, “Country, Industry, and Risk Factor Loadings in Portfolio Management,” The JournalofPortfolioManagement, Vol. 28, No. 4, 2002, pp. 70-79. http://dx.doi.org/10.3905/jpm.2002.319856
[9] G. De Santis and B. Gerard, “How Big Is the Premium for Currency Risk?” JournalofFinancialEconomics, Vol. 49, No. 3, 1998, pp. 375-412.
http://dx.doi.org/10.1016/S0304-405X(98)00029-4
[10] A. S. Cherny and D. B. Madan, “Coherent Measurement of Factor Risks,” 2006.
http://arxiv.org/abs/math/0605062v1
[image:5.595.61.281.278.447.2]JournalofPortfolioManagement, Vol. 36, No. 2, 2010, pp. 17-25. http://dx.doi.org/10.3905/JPM.2010.36.2.017
[12] S. Maillard, T. Roncalli and J. Teiletche, “On the Proper- ties of Equally-Weighted Risk Contributions Portfolios,” The Journal of Portfolio Management, Vol. 36, No. 4, 2010, pp. 60-70.
http://dx.doi.org/10.3905/jpm.2010.36.4.060
[13] MSCI Barra, “Barra Risk Model Handbook,” 2007. [14] C. R. Harvey, “The Risk Exposure of Emerging Equity