Munich Personal RePEc Archive
Decoupling: Myth or Reality?
Bernhardt, Thomas
New School for Social Research
September 2010
Decoupling: Myth or Reality?
Thomas Bernhardt1
Abstract:
When, in the mid-2000s, large parts of the global South experienced an impressive economic boom, the idea that a number of emerging market economies were
“decoupling” from the industrialized economies in the North gained considerable prominence. The financial and economic crisis that originated in the US and the global recession that it entailed, however, put this idea into question. The present paper analyzes different channels of crisis transmission and crisis effects in emerging markets (and the BRIC countries in particular) to demonstrate that decoupling is a myth rather than reality.
Key Words: Decoupling, Emerging markets, Economic crisis, Transmission channels, Dependence
JEL codes: F1, F3, F44, O11, O19
1
Ph.D. candidate, Department of Economics, New School for Social Research, New York, United States The author is grateful to Laura Carvalho and Lance Taylor for helpful comments on an earlier draft. All remaining errors are, of course, my own.
1. Introduction
“For the past hundred years the rate of growth of output in the developing world has depended
on the rate of growth of output in the developed world. When the developed grow fast the
developing grow fast, and when the developed slow down, the developing slow down. Is this
linkage inevitable?” (Sir A. Lewis 1979)
For most of the time in the past, the economic development of developing countries has been
considered to be highly dependent on the level and dynamism of economic activity in the
industrialized world, particularly in the United States. External factors and external shocks were
attributed a great importance in the determination of the economic fate of the countries in the global
South. And they seemed to be more relevant than ever in an era of intensified global economic
integration starting in the 1970s, usually labeled “globalization” and shaped by an ideological
paradigm known as “neoliberalism”. Also, the outstanding boom experienced by almost the entire
developing world in the very recent past, i.e. in the years 2003 to 2007, was mainly driven by
favorable external conditions (Griffith-Jones/Ocampo 2009: 4).
However, this time – according to a number of observers, columnists, economists, and (stock)
market analysts – the nature and reach of the boom were different in the sense that it had led to a
longer-term strengthening at least of the most dynamic and most potent economies in the developing
world. In this interpretation, which gained considerable prominence in certain economic circles in the
years 2007 and 2008, this last economic boom and the longer-term economic consolidation it
apparently triggered for emerging economies and particularly for the BRIC countries (Brazil, Russia,
India, and China) have allowed them to “decouple” from the economic developments in the
industrialized hemisphere.2 In view of the initial resilience of many developing countries against
contagion from financial and economic turmoil in the US, the old proverb “when the US sneezes, the
rest of the world catches a cold” was said to have lost its relevance. However, in the light of more
2 With a view on the historical context, Kohn (2008) argues that “[p]art of the reason the hypothesis of decoupling has
recent events and developments in the global economy it can be claimed that this announcement of
decoupling was premature. In fact, the still ongoing financial and economic crisis has had much more
repercussions on the economies of the developing world than initially thought. This can be taken as
indication that the myth of decoupling lacks substance.
Taking a descriptive approach and examining and interpreting recent data, the present paper aims
at collecting evidence for dismantling the notion of decoupling. It starts with a brief sketch of what is
commonly meant by the term “decoupling”. The next section analyses how the current economic crisis
spread over the entire globe, highlighting various channels of transmission. This is taken as a first
counterevidence against decoupling. Examining these spillover channels, it will be demonstrated that
emerging economies have been harshly affected by this crisis that initially emerged in the
industrialized world. Going one step further, the fourth section shows that key economic indicators of
industrial countries on the one hand and emerging markets on the other hand have moved in tandem,
undermining the notion of decoupling even more. The paper ends with some concluding remarks.
2. A brief sketch of “decoupling”
Even a long time after the end of the colonial era, the profound dependence of developing
countries’ economic well-doing on the prosperity of industrial countries was reflected, inter alia, in
more or less pronounced co-movements of economic activity in the global North and the global
South3. This dependence also helped to explain the clustering in time of growth successes and
collapses of developing countries during the 20th century (Ocampo/Ros 2008: Ch. 1, Ocampo et al.
2009: 29-30). Against this historical backdrop, to some optimistic observers and business analysts it
looked like the world economic system had undergone a substantial transformation when (at least until
mid-2008) most of the so-called emerging markets remained relatively unscathed from the economic
turbulences occurring in the US and later also in Western Europe. This led some of them to bring up
the notion of “decoupling”4, a term that was coined back in the year 2007 when the IMF asked in
chapter 4 of its World Economic Outlook “Decoupling the train?” while referring to “spillovers and
cycles in the global economy” (IMF 2007). Although the term gained considerable prominence in
certain economic circle, no attempt has been made to come up with a coherent definition of what and
who exactly is meant by “decoupling”. In other words, there is no unique, agreed-upon definition
which one could refer to. What is more, there is hardly any academic literature one could draw on. In
fact, the term “decoupling” has been rather used by (stock) market analysts, columnists and
commentators (see, for example, Goldman Sachs 2007 or JP Morgan 2009).
As a result, there are a number of slightly different and varyingly far-reaching definitions in use.
While some focus specifically on stock markets, what is usually meant with “decoupling”, though, is a
shrinking relationship between the economic activity in industrial countries on the one hand and emerging market economies on the other hand. A narrower interpretation claims that a certain
“divergence” or “de-synchronization” of business cycles has taken place (Kose et al. 2008: 4). Proponents of a more comprehensive definition of “decoupling”, however, suggest that – thanks to a
diversification in the sources of economic growth (i.e. strengthening of growth in domestic demand
components while lowering the relative contribution of exports), structural changes and domestic
policy improvements – emerging market economies have reduced external vulnerabilities and, thus,
become more resilient to external and global shocks. The combination of these developments, in turn,
has allegedly allowed emerging markets to become more independent of, i.e. to “decouple” from
advanced economies in recent years (The Economist 2009a, Kohn 2008). At the extreme end,
however, some even go as far as viewing emerging market economies, and in particular China, as
“new engines” or “new locomotives of global growth” (Das 2006; Smith 2006; Financial Times
2009a).
Facing this lack of a consistent widespread definition of “decoupling”, we have to come up with
our own version. In fact, we will base our analysis on a rather broad definition and refer to the
4 For a particularly enthusiastic account of promoting the idea of decoupling, see Bergsten (2008). Kose et al. (2008)
“decoupling” of the aggregate of emerging market economies from the industrialized world as a
whole, while paying special attention to the BRIC countries. Basically, our understanding of
“decoupling” relates to the question whether there are actually divergences in economic performance
among different regions of the world economy. In this perspective, “decoupling” refers to the degree
of sensitivity of economic activity in emerging economies to external or global factors. In that sense, we stick to the latter of two definitions identified by Levy-Yeyati (2009), according to whom
“decoupling” has “two distinct interpretations: business cycle synchronicity (in the sense of globally
synchronised expansions and recessions) and sensitivity (closer to the cold metaphor)”, with the “cold
metaphor” saying that “whenever the world [catches] a cold, emerging markets [get] pneumonia”
(ibid.). Examining both financial and real economy indicators, we will try to answer Sir Arthur Lewis’
question quoted at the beginning of this paper, i.e. whether or to which extent the economic fate of
emerging markets is still dependent on the economic activity in developed countries.
3. The spreading of the current crisis: channels of transmission
In the years before the crisis almost every developing and emerging economy experienced a
veritable boom. Between 2003 and 2007, the developing world recorded average growth rates of 7%
per year. The boom was based on an extraordinarily favorable international economic environment,
characterized by at least three coinciding positive factors: 1) high commodity prices, 2) thriving
international trade, and 3) high liquidity in international capital markets, implying exceptional
financing opportunities especially for emerging market economies. However, all these factors reversed
when what started as a subprime crisis in the US turned into a global economic crisis after the collapse
of Lehman Brothers in September 2008. In other words, the external factors that fueled the previous
boom started to operate in the opposite direction (Griffith-Jones/Ocampo 2009: 4). As a consequence,
most developing and emerging economies found themselves in the middle of an economic crisis. This
section is dedicated to the analysis of the different channels of transmission of the financial and
3.1 International trade as transmission channel
During the recent boom, international trade grew very dynamically, at an average annual rate of
9.3% between 2003 and 2006. With that, world trade has expanded at a rate more than twice the rate
of world output growth (3.8% per year). Yet, international trade has shown a strong pro-cyclical
pattern and has indeed been more volatile than world production (Ocampo 2009: 706). That’s why the
expansion of the volume of trade of developed countries started to decelerate rapidly since mid-2007
when the subprime crisis started to unfold. In contrast, developing and emerging economies were left
relatively unscathed until the third quarter of 2008. The financial meltdown in September 2008,
however, triggered a radical downturn in trade across the globe. International trade experienced a
sharp contraction already in the last quarter of 2008 and declined by 19% on a year-to-year basis in the
first quarter of 2009 (UNCTAD 2009a: 18). For the entire year of 2009, the volume of world trade in
goods and services is forecast to contract between 9% and 12.2% (WTO 2009; UN 2009: 2; IMF
2009a: 2), highlighting how the crisis that originated in the US now impacts the whole world.
However, not all developing countries are affected in the same way. For exporters of manufactures and
services (especially tourism) the dominant transmission channel of the crisis is the fall in trade
volumes whereas exporters of primary goods are particularly affected by commodity price trends
(Griffith-Jones/Ocampo 2009: 7). In the following, these two transmission channels will be examined.
a) Declining export demand
As can be seen in Figure 1, emerging market economies were particularly hard hit by the cutback
in world trade. Both in terms of value and volume, their exports have fallen more pronouncedly than
developed countries’ exports. Among the countries that are most affected are those Asian exporters for
which manufacturing exports take a sizeable share of GDP, e.g. Korea, Malaysia, Singapore, Taiwan
and Thailand. They suffer from the fact that the purchase of investment and durable consumer goods is
Fig. 1:World Trade, January 2000-September 2009 (in billion US$)
Source: IMF International Financial Statistics Database
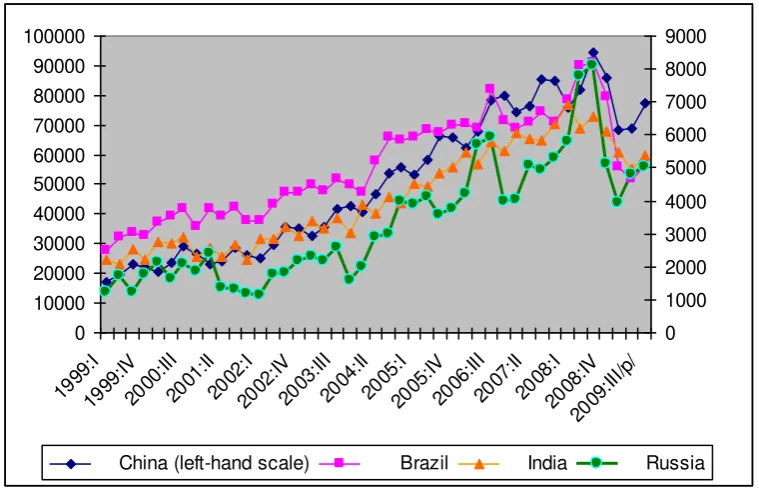
Fig. 2: Quarterly US imports of goods from BRIC countries, 1999:I-2009:III (in million US$)
0 10000 20000 30000 40000 50000 60000 70000 80000 90000 100000 1999 :I 1999 :IV 2000 :III 2001 :II 2002 :I 2002 :IV 2003 :III 2004 :II 2005 :I 2005 :IV 2006 :III 2007 :II 2008 :I 2008 :IV 2009 :III/p / 0 1000 2000 3000 4000 5000 6000 7000 8000 9000
China (left-hand scale) Brazil India Russia
Source: Bureau of Economic Analysis, International Economic Accounts Database
On the recipient end, the evolving recession implied the advanced economies slashing import
demand. Their import volume of goods and services grew by a meager 0.47% on a year-to-year basis
in 2008 and is estimated by the IMF to plummet by 13.7% in 2009 – compared to an average annual
growth of 5.8% in the time period between 2002 and 2007.5, 6 For example, the US, the single most
important importer on a world scale, reduced its imports dramatically. In the first three quarters of
5 All data are from the IMF World Economic Outlook Database, October 2009.
6 According to the same forecasts, emerging and developing economies will also be forced to cut their imports by 9.5%
in 2009 – following an episode of tremendous expansion by an annual 10.8% between 2000 and 2008. This indicates how the economic slowdown has gained ground also in these countries.
Value of exports
0 200 400 600 800 1000 1200 1400 1600 M1 2000 M1 2001 M1 2002 M1 2003 M1 2004 M1 2005 M1 2006 M1 2007 M1 2008 M1 2009
World Advanced Economies Emerging & Developing Economies
Value of imports
0 200 400 600 800 1000 1200 1400 1600 1800 M1 2000 M1 2001 M1 2002 M1 2003 M1 2004 M1 2005 M1 2006 M1 2007 M1 2008 M1 2009
[image:8.595.72.452.320.564.2]2009, US imports of goods were 32% below their level of the previous year.7 As Figure 2 shows, this
also affected all the BRIC countries, who without exception suffered from decreasing US imports
from mid-2008 on.
Looking at the other big importer in the developed world, the euro zone, gives the same picture. Its
imports fell sharply in the second half of 2008 and since mid-2009 it even registers a current account
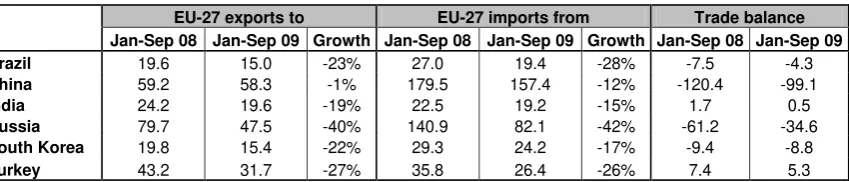
surplus, i.e. it is a net exporter (EUROSTAT 2009: 6). Table 1 and Figure 3 highlight that this had
major impacts on leading emerging economies, among them the BRIC countries. In the first 9 months
of 2009, EU-27 imports from the BRIC countries declined by an unweighted average of 24%
[image:9.595.81.506.358.449.2]compared to the same time period in 2008 (see Table 1).
Table 1: EU-27 trade with emerging markets (in billion euro)
Source: EUROSTAT (2009: 4)
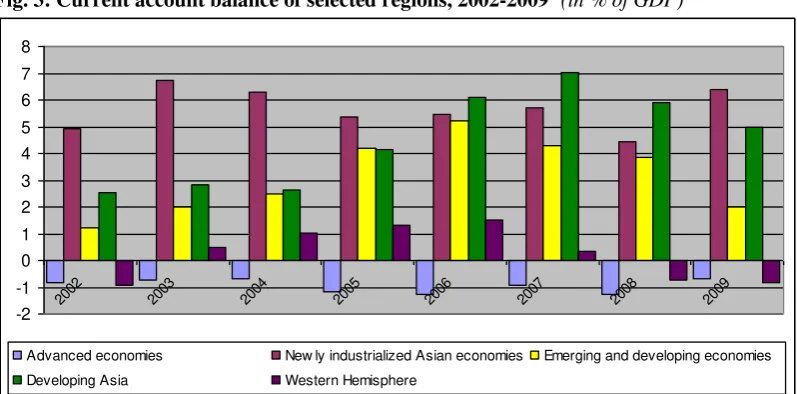
As a consequence of slipping import demand from the US and the EU, the current account
surpluses of developing Asia (including China and India), the newly industrialized Asian economies8,
and the developing and emerging economies in general have shrunk while the trade balances of
Western Hemisphere countries have turned negative (see Fig. 3).In the latter case and particularly in
the case of the South American exporters of primary goods, however, this deterioration is not only
related to falling demand but also to declining commodity prices.
7 They fell from 1,648 billion US$ in 2008 to 1,131 billion US$ in 2009. Data from Bureau of Economic Analysis,
International Economic Accounts, http://www.bea.gov/international/
8 According to IMF classification: Hong Kong, Singapore, South Korea, and Taiwan.
EU-27 exports to EU-27 imports from Trade balance
Jan-Sep 08 Jan-Sep 09 Growth Jan-Sep 08 Jan-Sep 09 Growth Jan-Sep 08 Jan-Sep 09 Brazil 19.6 15.0 -23% 27.0 19.4 -28% -7.5 -4.3
China 59.2 58.3 -1% 179.5 157.4 -12% -120.4 -99.1
India 24.2 19.6 -19% 22.5 19.2 -15% 1.7 0.5
Russia 79.7 47.5 -40% 140.9 82.1 -42% -61.2 -34.6
South Korea 19.8 15.4 -22% 29.3 24.2 -17% -9.4 -8.8
Fig. 3: Current account balance of selected regions, 2002-2009*(in % of GDP)
-2 -1 0 1 2 3 4 5 6 7 8
2002 2003 2004 2005 2006 2007 2008 2009
Advanced economies New ly industrialized Asian economies Emerging and developing economies Developing Asia Western Hemisphere
* Figures for 2009 are estimates
Source: IMF World Economic Outlook Database, October 2009
b) Worsening Terms of Trade (ToT)
For the large number of commodity-exporting developing and emerging economies, the spreading
crisis affected them primarily via a drastic worsening of their Terms of Trade (ToT). One of the main
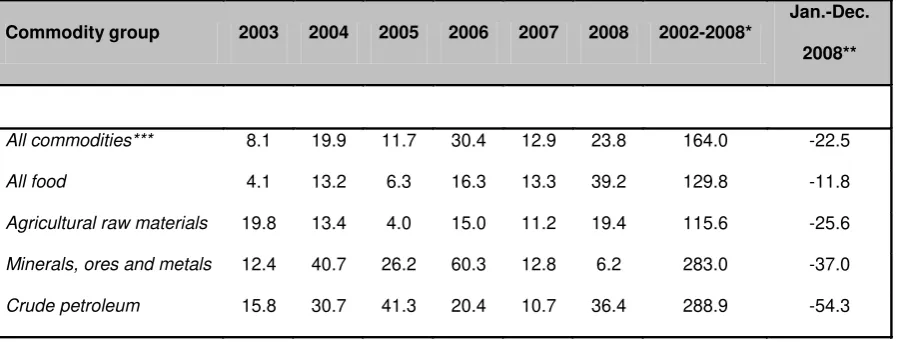
characteristics of the economic boom preceding the crisis was the unprecedented boom in commodity
prices. Between 2004 and mid-2008 the world economy witnessed the most impressive commodity
boom in over a century in terms of duration, magnitude and product coverage, although the boom was
more pronounced for mining and energy products than for agricultural goods (World Bank 2009a: Ch.
2, see also Table 2). However, the boom came to an abrupt end in mid-2008 with “the downturn in
commodity prices (…) first triggered by a reorientation of speculative influences” (UNCTAD 2009a:
7) and then exacerbated by the deterioration of both global economic prospects and global demand.
Between mid-2008 and December 2008, commodity prices fell by almost 42% (Ocampo 2009: 707)
and for 2009 the World Bank (2009a: 40) predicts the prices of energy products and non-energy
products to decline by a further 25% and 23.2%, respectively. According to the IMF9, Terms of Trade
will worsen by 6.3% in 2009 (compared to 2008) for the entirety of emerging and developing
economies, particularly hitting commodity-exporting countries in the Middle East and the Western
Hemisphere, while developing Asia will experience only a modest improvement of 2.2%. Among the
BRIC countries, Russia is the most affected by these trends, owing to its dependence on oil exports.
Overall, commodity price volatility has been a key channel of crisis transmission from the advanced to
[image:11.595.75.524.187.358.2]all developing and emerging economies (Bhushan 2009: 4).
Table 2: World primary commodity prices, 2002-2008 (% change over previous year)
* Percentage change between 2002 and 2008
** Percentage change between January 2008 and December 2008 *** Excluding crude petroleum
Source: UNCTAD (2009: 8)
3.2 Financial transmission channels
The bursting of the US house price bubble in mid-2007 roiled international financial markets but
the collapse of Lehman Brothers in September 2008 was the decisive turning point, “replacing
financial exuberance by financial fear” (Palley 2008) not only in the US but on the entire globe.
Financial contagion spread quickly across regions and asset classes, with private capital flows being
among the key channels of crisis transmission.
a) Foreign capital flows
In reaction to the mid-September 2008 meltdown, credit to emerging markets banks and
businesses was frozen and capital outflows were registered through two channels: investors’ typical
“flight to quality” (in particular to US Treasury bonds) and “the sale of assets throughout the world to
finance the withdrawal of resources from mutual and hedge funds in the USA” (Ocampo 2009: 713).
As a result, overall private capital flows to emerging market economies have fallen sharply. They
dropped by about 50% to 466 billion US$ in 2008 and are forecast to further decline to 165 billion
Commodity group 2003 2004 2005 2006 2007 2008 2002-2008*
Jan.-Dec. 2008**
All commodities*** 8.1 19.9 11.7 30.4 12.9 23.8 164.0 -22.5
All food 4.1 13.2 6.3 16.3 13.3 39.2 129.8 -11.8
Agricultural raw materials 19.8 13.4 4.0 15.0 11.2 19.4 115.6 -25.6
Minerals, ores and metals 12.4 40.7 26.2 60.3 12.8 6.2 283.0 -37.0
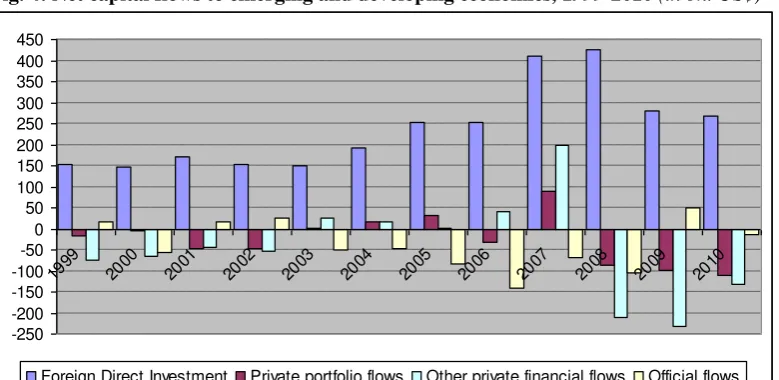
US$ in 2009, down from a record level of 929 billion US$ in 2007 (UN 2009: 11). As a consequence,
net capital flows are expected to turn negative in 2009 (see Fig. 4). The category of private capital inflows that experienced the sharpest cutback was bank lending to emerging markets10, reversing
inflows of 410 billion US$ in 2007 and 167 billion US$ in 2008 into a projected outflow of 60 billion
US$ in 2009 (Griffith-Jones/Ocampo 2009: 6). Among the countries that suffered most from this
turnaround of international bank lending were Russia and several economies in Central and Eastern
Europe. Increasing risk aversion among international investors became also manifest in the reversal of
private portfolio investments from inflows of 88 billion US$ in 2007 to outflows of 85 billion US$ in
2008. In contrast, foreign direct investment (FDI) inflows have remained relatively stable. However,
their upward trend was halted and they declined considerably in the first quarter of 2009. In fact, they
are projected to further decrease in 2009 for all regions (see Fig. 4, UNCTAD 2009b: 3, UNCTAD
[image:12.595.76.466.409.599.2]2009c: 8-11).
Fig. 4: Net capital flows to emerging and developing economies, 1999-2010 (in bn. US$)*
-250 -200 -150 -100 -50 0 50 100 150 200 250 300 350 400 450
1999 2000 2001 2002 2003 2004 2005 2006 2007 2008 2009 2010
Foreign Direct Investment Private portfolio flows Other private financial flows Official flows
* Figures for 2009 and 2010 are estimates
Source: IMF World Economic Outlook Database, October 2009
b) Rising costs of external financing and declining bond issuance
The crisis spilled over not only through volumes but also through the associated costs of private
capital flows, with these costs largely determined by sentiments in international financial markets and
international investors’ risk perception. In fact, one central feature of such flows is their pro
-cyclicality. In the early phase of the boom, from mid-2004 to early 2006, risk spreads on emerging
market bonds (and thus also the cost of emerging markets’ external financing) fell substantially and
stabilized at low historical levels afterwards (Ocampo 2009: 711). With turmoil starting in US
financial markets in mid-2007, first signs of contagion became visible as spreads on emerging market
bonds began to increase. This trend culminated in a drastic jump of risk spreads and yields with the
global financial meltdown of mid-September 2008 (see Fig. 5), when risk evaluation was revised
dramatically by international investors and rating agencies, leading to a “flight to safety”. At this
point, exuberance was replaced by panic, and widespread risk appetite turned into general risk
aversion. In combination with the rising costs of external financing, this change in sentiments –
reflected in private capital withdrawals – had severe negative impacts on the issuance of both
sovereign and corporate bonds. Emerging economies were affected more severely than developing
countries since the latter are less integrated into international private capital markets. Emissions in
bond markets virtually came to a halt in many emerging economies during the last quarter of 2008,
with the key problem being the interruption of bond issues in international capital markets (IMF
[image:13.595.74.535.511.733.2]2009b: 204).
Fig. 5: Yield spreads on emerging market bonds, January 2006-July 2009
In short, far from being isolated from the turmoil in advanced economies, the financial markets of
developing and particularly of emerging economies were hit hard, confirming “the strong correlation
between markets that are not fundamentally related to each other but are subject to the same kind of
global portfolio management decisions.” (UNCTAD 2009a: 17)
4. Co-
movement of key economic indicators: Is this really “decoupling”?
As has been shown, the crisis that originated in the US spread across the globe within a bit more
than a year, taking different channels of transmission to different countries and regions. In a lot of
these countries, contagion was severe and the effects of these spillovers dramatic, both on the real
economy and on financial markets. These will be analyzed in the following, before taking a specific
look at the BRIC countries and, finally, discussing “decoupling”.
4.1 Real economy effects of the spreading of the crisis
Almost all developed countries slipped into recession in the course of 2008. In 2009, advanced
economies as a group registered a negative growth rate of 3.4%. Meanwhile, although developing and
emerging economies do not slide into a downright recession, they follow suit, experiencing a
considerable growth slowdown (see Fig. 6). After expanding at an average annual rate of 6.4%
between 2000 and 2008, they grew by a meager 1.7% in 2009.11
11 Of course, this average covers regional differences. Some regions registered negative output growth in 2009 (CEE:
Fig. 6: Real GDP growth, selected regions and BRIC countries, 1999-2010 (in %)*
-6 -4 -2 0 2 4 6 8 10
1999 2000 2001 2002 2003 2004 2005 2006 2007 2008 2009 2010
Advanced economies
Newly industrialized Asian economies**
Emerging and developing economies
BRIC countries***
* Figures for 2009 and 2010 are estimates
** Composed of 4 countries: Hong Kong SAR, Korea, Singapore, and Taiwan Province of China. *** Unweighted average
Source: IMF World Economic Outlook Database, October 2009
As we have seen in the previous section, developing and emerging economies have suffered from
sliding export demand since mid-2008. Moreover, except for China, India and South Africa, all major
emerging markets experienced falling investment demand in the first quarter of 2009 – in part due to
declining FDI inflows, which account for about 13% of gross fixed capital formation in these countries
(UNCTAD 2009a: 20). Correspondingly, on the supply side, industrial production slumped in the
second half of 2008, following similar trends in advanced economies. Unsurprisingly, this also
affected the labor market. In view of an increase of global unemployment by 10.7 million people – the
largest year-on-year rise since 1998 – to a global number of unemployed at around 190 million in
2008, the International Labor Organization (ILO) argues that the motto for 2008 was: “From financial
crisis in developed countries to a global economic and jobs crisis” (ILO 2009a: 9). In fact, in 2008,
unemployment measured in absolute terms rose not only in the developed world, where the crisis
originated, but in all world regions, including Africa, CEE, Latin America as well as East, South and
Southeast Asia (ILO 2009a: Annex 3). As Figure 7 shows, this trend was continued in 2009, with
unemployment in developing countries following the upward trend in developed countries, although at
a slower pace and with the typical time lag with regard to the business cycle. Likewise, employment in
manufacturing and in non-agricultural activities has been decreasing since January 2009 (ILO 2009b).
In any case, an estimated 10.7 million jobs have been lost in selected emerging economies (for which
data was available)12 during the last quarter of 2008 and the first quarter of 2009 (ILO 2009c: 4).13
12 Argentina, Brazil, Chile, China, Colombia, Ecuador, Egypt, Jamaica, Mauritius, Mexico, Morocco, other EU, Peru,
Fig. 7: Recent trends in unemployment, April 2008-June 2009 (Percentage change over the same period of the previous year)
Source: ILO (2009b: 1)
4.2 Effects on financial markets
With economic growth down and unemployment up, inflation decreased not only in industrial
countries but also in emerging economies, signaling a global rather than a regional downturn of
economic activity (see Fig. 8). In view of this, national authorities had to adapt their monetary policy.
While several central banks in emerging economies initially raised their key interest rate in an attempt
to halt capital outflows, all of them have now followed the US Federal Reserve’s downward move at
[image:16.595.71.347.88.269.2]least since the beginning of 2009 (UNCTAD 2009a: 27).
Fig. 8: Global Inflation (12-month change in consumer price index unless otherwise noted)
Source: IMF (2009a: 3)
13 However, this data seems to be indeed very fragmentary. Other sources report that in China alone 41 million jobs
[image:16.595.71.509.526.744.2]In international financial markets, as was shown above, sentiments deteriorated radically in
September 2008, with capital outflows and rising risk premia hitting emerging economies severely.
The effects of this were manifold. Not only did risk spreads skyrocket in the initial panic, they also
remained higher (see Fig. 5) and much more volatile than in the years prior to the shock. With the
unwinding of carry trade and mutual and hedge funds withdrawing capital from July 2008 on, there
was also a massive reversal of currency positions out of high-yielding emerging markets assets into
advanced countries’ currencies (Griffith-Jones/Ocampo 2009: 2). This had a significant negative
impact on the exchange rates of emerging economies, generating volatility and depreciation. Indeed,
with the notable exception of China whose authorities de facto re-pegged the Renminbi to the US
dollar when the financial turmoil escalated (Financial Times 2009c, 2009d), most emerging market
currencies depreciated against the US dollar in the second half or at least in the forth quarter of 2008
(IMF 2009b: 196). All this made attracting external financing more difficult. As a result, bond and
equity issuance began to stagnate and finally came to a standstill at the end of 2008. According to the
IMF (2009b: 204), bond issuance of developing and emerging economies fell from 186 billion US$ in
2007 to 106 billion US$ in 2008, while equity issuance dropped from 207 billion US$ to 54 billion
US$.14 This latter figure highlights that, in the second half of 2008, most emerging markets
experienced major stress not only in their foreign exchange and sovereign debt markets but also in
their stock markets where share prices collapsed and Initial Public Offers (IPOs) decreased
substantially (Kannan/Koehler-Geib 2009). On average, contraction in emerging economies’ stock
markets was more pronounced than in industrial countries’ stock markets (see Fig. 9).
14 This affected also the BRIC countries. For example, there was no bond issuance in China during the last quarter
Fig. 9:Stock market indices, May 2003-Nov. 2008 (Index: July 2003-June 2004 = 100)
Source: Ocampo (2009: 713)
In summary, there have been clear co-movements in all of the main economic indicators of the
aggregate of industrial countries on the one hand and the aggregate of emerging economies on the
other hand. In the cases of capital (out)flows and emerging market risk spreads, in turn, the reversals
were induced by events in the industrialized hemisphere. Let us now take a closer look at those
emerging markets that have been said to be the strongest, the most dynamic and the most promising
cases for “decoupling”, namely the BRIC countries.
4.3 The BRIC countries
So, as has been shown, on the aggregate, developing countries and emerging market economies remain to a considerable degree coupled to the industrialized world. A first glance at real GDP growth
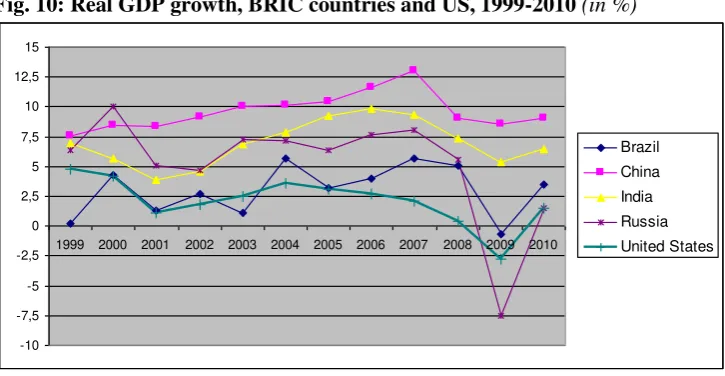
rates suggests continuing coupling also for the BRIC countries, at least to a certain degree. As depicted
in Figure 10, all the BRIC countries experience a trough at the same time the US does. Although the
degree of contagion varies and although only two of them (Brazil and Russia) undergo a recession in
2009, none of them has remained unaffected. In the following, some arguments will be presented for
Fig. 10: Real GDP growth, BRIC countries and US, 1999-2010 (in %)*
-10 -7,5 -5 -2,5 0 2,5 5 7,5 10 12,5 15
1999 2000 2001 2002 2003 2004 2005 2006 2007 2008 2009 2010
Brazil China India Russia United States
* Figures for 2009 and 2010 are estimates
Source: IMF World Economic Outlook Database, October 2009
China is arguably the country that comes closest to decoupling with its powerful growth
performance. But also China has suffered from a growth slowdown. As Figure 10 shows, the steady increase in GDP growth rates that began in 1999 and peaked in 2007 was interrupted in 2008, with
slower growth rates also expected for at least two more years. The effects of this become visible, inter
alia, in labor market statistics. Although Chinese job figures are not very reliable, anecdotal evidence
confirms that unemployment went up significantly, with millions of migrant workers being laid off
particularly in the battered export sector (The Economist 2009b).15 The key factor behind this is the
downturn in exports that started in November 2008 and continued in 2009, with exports being down
by 19% (on a year-on-year basis) in the first quarter 2009 (World Bank 2009b: 3). Overall, China is
still heavily dependent on exports, particularly to the US. During the last decade, Chinese export
growth has exceeded GDP growth in every single year. In fact, Chinese exports expanded at an annual
average of 17.6% from 1999 to 2008, while GDP growth averaged only at 9.8% during the same
period. Meanwhile, private consumption grew at an average annual rate of 7.9%.16 So exports clearly
have been the main driver of Chinese economic growth during the last 10 years. The US remains by
far the single most important export market, absorbing almost a quarter of China’s total exports in
2008.17 This also explains China’s persistent reluctance to let its currency appreciate against the US
15 According to estimations, 41 million Chinese laborers lost their jobs due to the crisis, with 23 million of them still
out of work (Financial Times 2009b).
dollar.18 Still, it has suffered considerably from plummeting US import demand since the onset of the
subprime crisis and the recession it entailed in the US. During the first three quarters 2009 US imports
of Chinese goods dropped by 15% compared to the first three quarters 2008.19 At the same time, China
is tied to the US also via its enormous holdings of US treasury bills as part of its foreign exchange
reserves that make it fear a sharp depreciation of the dollar as this would imply a devaluation of its
assets (Financial Times 2009e).
The flipside of the importance of exports for the Chinese economy is that the domestic market’s
contribution to economic growth is underdeveloped, particularly that of private consumption. China
still lacks a broadly-based middle class with purchasing power.20 In fact, only 37% of aggregate
demand is household consumption21; exports make up the same share, namely 38%. During the last
decade, these two components of aggregate demand have experienced inverse developments: while the
share of private consumption has fallen by 9 percentage points (from 46% in 1999), exports have
almost doubled their share in aggregate demand from 20% in 1999 to 38% in 2008. In other words, the
domestic market is still too weak to be a sustainable “locomotive of growth” for China, let alone for
the world economy. This is also true for the current growth acceleration which is primarily due not to
private sector activity but to the authorities’ countercyclical policies consisting of a massive fiscal
stimulus package (amounting to almost 600 million US$ or 6.2% of GDP22), loose monetary policy
and a credit boom fueled by lending from state-controlled banks that were ordered by the government
to extend new loans (Financial Times 2009f, 2009g, 2009h, The Economist 2009b, UN 2009: 9). In
view of all this, China’s economy clearly still remains “coupled” to the industrialized world’s
economies.
18Yet, China’s exchange rate policy has also a secondary objective: With its policy of anxiously maintaining the
Renminbi’s peg to the dollar, China also tries to hold its ground against competition from other emerging markets (Financial Times 2009c).
19 Data from the US Bureau of Economic Analysis (BEA),International Economic Accounts Database.
20According to recent estimates, China’s middle class population, defined as those with annual income of at least
US$5,000, now numbers between 100 and 150 million people (The Economist 2009c, Chang 2008). This is about 10% of the total population.
21By comparison, in 2008 household consumption accounted for, respectively, 71% of US GDP, 61% of Brazil’s
GDP, 55% of India’s GDP, 66% of Mexico’s GDP, 54% of Korea’s GDP, and 49% of Russia’s GDP.
22 In terms of percent of GDP, this is more than any developed country government is spending, including the US with
There are some who argue that Asia, and China in particular, is not as dependent on exports to
advanced countries as is usually believed because regional trade has intensified a lot (The Economist
2009b). Yet, “Asian countries can trade parts and components amongst themselves all they like (…)
but they still need someone to buy their final products” (Eichengreen 2008) – and final demand for
Asian goods still comes mainly from the world’s major industrial countries. In fact, more than 60% of
Asian exports are ultimately headed for G-3 economies, i.e. the US, euro zone, and Japan (Park 2009).
With its ample current account surpluses, Asia’s contribution to global demand falls short of its actual
income. In contrast to the G-3 economies where consumption is only slightly below production, Asia
consumes a mere 70% of what it produces (Park 2009).
Considerable hope has also been set on India as potential shock absorber in the global economic
system, even though India is not as integrated into world economy as China. Still, as Ghosh and
Chandrasekhar (2009: 725) assert, “[t]he view that the Indian economy would be less adversely
affected by the global economic crisis because of limited integration and other inherent strengths has
proved to be wrong.” Rather, they argue, the economic boom that preceded the current downturn was
crucially nourished by three external factors: first, increasing reliance on exports (in particular of
services); second, rising dependence on inflows of foreign capital; and third, the role these inflows
played in promoting a domestic credit-fueled consumption and investment boom (ibid.). Indeed, the
importance of foreign trade for the Indian economy has soared in recent years. The trade-to-GDP ratio
has more than doubled between 1995 and 2006, reaching 23% in the latter year. Correspondingly,
India’s trade collapsed parallel to world trade during the crisis. Exports started to contract in October
2008 and dropped by about 20% until September 2009. This stands in stark contrast to the dynamism
they had exhibited before the crisis, growing robustly at an annual 28% from September 2003 to
August 2008 (Alex/Kumar 2009). What is more, India has become increasingly reliant on inflows of
foreign capital in recent years. On the one hand, the contribution of FDI to gross fixed capital
formation has risen from 1.9% (annual average in the period 1990-2000) to 9.6% in 2008 (UNCTAD
2009b). On the other hand, many capital inflows have been of speculative nature, encouraged by
2007-08, when its current account recorded a deficit of 1.5% of GDP, India received capital inflows
amounting to over 9% of GDP, thus exceeding by far its current account financing needs (Subbarao
2009: 387). Among the capital inflows was also foreign bank credit, which sparked a retail credit
boom that played an important role in financing recent private expenditure expansion. Essentially, the
principal stimulus for growth in the recent boom episode was credit-financed housing investment and
private consumption of the elite and burgeoning middle class, while sluggish employment generation
reduced kept mass consumption demand low. This is not a very sustainable but rather uneven and
vulnerable growth paradigm. Indeed, by mid-2008, this growth process reached its limits and adverse
external shocks caused a slowdown. Thus, “recent events have exposed the fallacy of ‘decoupling’ [for
India]” (Ghosh/Chandrasekhar 2009: 726).
Brazil has been hit hard by the crisis too. After two years with growth rates above 5%, it has now
gone through a crisis-induced recession and is projected to record negative growth in 2009 (see Fig.
10). During the first quarter 2009, manufacturing output decreased by 12.6%, exports by 19.4% and
gross fixed capital formation by 14% (UNCTAD 2009a: 20). The latter was partly due to the fact that
Brazil was severely affected by heavy fluctuations of foreign capital flows, among them FDI.23
However, after suffering from net outflows in late 2008 and early 2009, it experienced a veritable
flood of capital inflows in the course of 2009, among them a lot of hot money. By November, the real
had appreciated by 31% against the US dollar compared to its bottom value in end 2008, harming
Brazil’s exports (Financial Times 2009i). In fact, Brazil is one of the world’s biggest commodity
exporters. In this regard, Brazil has become increasingly dependent on China during the last years. It
has benefitted directly from thriving Chinese demand for its commodities but also from the
commodity price boom 2004-2008 which was decisively driven by Chinese purchases (UNCTAD
2009a: 11). Likewise, Brazil’s rebound in recent months has been facilitated by strong growth in
China (Financial Times 2009i). All this shows that, far from decoupling, Brazil has remained tightly
tied to the global economy. For Russia, “the weakest of the four” BRIC countries (Oakley 2009),
hopes of decoupling have been smashed by the intensity of the crisis impact, with the credit crunch
23 In fact, inward FDI flows accounted for 15.1% of Brazilian gross fixed capital formation in 2008, up from just
and sliding commodity prices triggering a growth collapse in 2009 after ten years of rapid expansion
(see Fig. 10). To be sure, Russia’s economy shrank 10.1 per cent in the first half of 2009 (Financial
Times 2009j). Other indicators do not raise hope either: the first quarter 2009 witnessed manufacturing
output declining by 19.6%, investment by 16.3%, and exports by 47.7% (all data on a year-to-year
basis, see UNCTAD 2009a: 20). The key problem is that Russia’s economy is very little diversified.
Russia is still an energy-based economy that heavily depends on oil and gas and their exportation,
particularly to the EU but increasingly also to China (Financial Times 2009k). With exports
amounting to 31% of GDP, foreign trade plays an important role for the Russian economy. So do
international financial markets, not only as a source of capital but also as a source of volatility. In a
sharp reversal of depreciation pressures caused by falling oil prices and ruble sell-offs a year ago, the
value of the ruble currently shows a strong tendency to go up, following the rise in oil prices
(Financial Times 2009l). In other words, Russia’s economy is still closely tied to the international
economy, particularly via the oil price.
4.4 Some initial discussion of “decoupling”: fact or fiction?
During the boom years prior to the crisis, a number of analysts fervently advocated the idea of
“decoupling” emergent market economies. When the crisis started to spread over the entire globe,
affecting also all emerging economies, however, the belief in decoupling faded quickly. But while the
proponents of decoupling were muted by the diffusion of the crisis, they reappeared when the recovery
of emerging markets preceded the recovery of the industrialized countries. Improving stock market
and real economy data were interpreted as proof of their increasing strength – and of decoupling (Palit
2009). Indeed, many emerging economies have already rebound (see above) and among the
best-performing stock markets in 2009 are almost only those in emerging economies (Financial Times
2009m). However, this interpretation overlooks the fact that the stabilization of the economy in
advanced countries and the return of “appetite for risk” among international investors (and the
improvement of market sentiments in general) were prerequisites for the recovery in emerging
In any case, discussion on decoupling has revived recently, with both proponents and opponents
declaring victory. The proponents of decoupling usually refer to an empirical study by Kose et al.
(2008) who make a cautious case for decoupling. According to their findings, the importance of global
factors for emerging markets’ economic activity has waned over time and their business cycles have
increasingly desynchronized from those of industrial countries. In contrast, Rose (2009), Levy-Yeyati
(2009) and Wälti (2009a) all conclude that there is little evidence for decoupling. Wälti (2009a) argues
that as emerging markets saw a tremendous take-off in economic growth during the last two decades,
their trend growth rates have diverged significantly from those of industrial countries (see Fig. 11). In
order to avoid misleading conclusions when assessing the “decoupling” hypothesis, he suggests that
instead of looking at real GDP growth figures one has to focus on the deviation of actual growth rates
from trend growth rates. He illustrates his point with the following hypothetical example: “Saying that
China has decoupled from the US because China grows at 5% while the US experience an output decline of 2% is wrong. If the trend growth rate is 9% in China and 2% in the US, both countries are 4 percentage points below trend and their business cycles are therefore perfectly in tune.” (Wälti 2009b)
Looking at the deviations of the actual from the trend growth rates for both advanced and emerging
economies, they seem to be very similar and move in tandem (see Fig. 11). On the basis of this
analysis, Wälti (2009b) concludes that “decoupling was always a myth”. This is in line with what we
have found above. Our empirical analysis has shown that there are still pronounced co-movements in
[image:24.595.74.521.595.719.2]key economic indicators.
Fig. 11: Real GDP growth & trend (% change) Real GDP growth–deviation from trend
4. Concluding remarks:
There is no doubt that in the recent past a number of emerging economies, above all the so-called
BRIC countries, have considerably strengthened their (macro)economic position and gained resilience
against external shocks. However, many of the circumstances on which this invigoration was based
were exceptional and they revealed rather than refuted the importance that external and global factors
still have for the developing world. It must not be forgotten that it was the combination of a global
economic boom, high liquidity in international financial markets and a historical commodity price
boom that enabled many developing and emerging economies to run current account surpluses which
allowed them to reduce external debts and build up foreign exchange reserves. Yet, global economic
prosperity is elusive and international capital flows are (in)famous for their volatility. Relying to much
on them creates economic vulnerability.
Even so, compared to most other historical periods, many emerging economies have indeed
become slightly less sensitive to economic developments in the industrialized world. However, to talk
about “decoupling” means to throw out the baby with the bath water. The current financial and
economic crisis has demonstrated that even the bigger and stronger emerging markets remain closely
tied to the fate of the developed world and thus vulnerable to external shocks. Despite the new
strengths described above, all developing and emerging economies experienced either a recession or a
considerable slowdown. Behind this lies the fact that – because of globalization – national economies
have become more integrated. On the real economy side, it is obvious that international trade has
gained importance for almost any country, thus making economic growth more reliant on export
demand. At the same time, global business networks and cross-border production chains have made
economies increasingly characterized by vertical specialization which has resulted in a major
expansion of intra-industry trade, thereby amplifying contagion during times of crisis. On the financial
markets side, emerging markets have successively opened up to international capital flows (mostly
originating from developed countries), exposing themselves to the sentiments of foreign investors. All
emerging and advanced economies in particular. Even the most potent of all emerging markets, China,
with its huge (potential) domestic market and its large FX reserves, remains heavily sensitive to
developments in the world economy and its exports markets. Now some argue that many commodity
exporters (like Brazil) and Asian economies are loosening their ties to rich countries and actually
coupling to China. Apart from the fact that this would not really be “decoupling” either, these
economies are, in essence, not decoupling from the developed world because this is where most of the
final demand comes from. So, after all, emerging economies remain tightly linked to the world
economy and its dominant players. Thus, decoupling – defined as decreasing sensitivity of economic
activity in emerging economies to external and global factors – has so far been rather a myth than part
of reality.
References:
Alex, D. and Kumar, R. (2009): The Great Recession and India’s trade collapse, Column on voxeu.org on 29 November 2009, http://www.voxeu.org/index.php?q=node/4302 (retrieved on 12/14/2009).
Bergsten, F. (2008): Trade has saved America from recession, Blog entry on 1 July 2008,
http://blogs.ft.com/economistsforum/2008/07/trade-has-saved-america-from-recession/ (retrieved on
10/31/2009).
Bhushan, A. (2009): Impact of the Global Economic Crisis on Low Income Countries, Report on the Second Workshop of the Policy Responses to Unfettered Finance project, North-South Institute, June 2009.
Chang, L. T. (2008): China’s Middle Class, In: National Geographic, May 2008.
Das, D. K. (2006): The Chinese and Indian Economies: Comparing the Comparables, Journal of Chinese Economic and Business Studies, Vol. 4, Issue 1, February 2006, pp. 77 – 89.
Eichengreen, B. (2008): Asia and Global Stagflation, Column on voxeu.org on 19 June 2008,
http://vox.cepr.org/index.php?q=node/1246 (retrieved on 11/23/2009).
EUROSTAT (2009): October 2009: Euro area external trade surplus 8.8 bn euro; 3.8 bn euro deficit for EU27, Euro indicators news release, http://europa.eu/rapid/pressReleasesAction.do?reference=
STAT/09/187&format=HTML&aged=0&language=EN&guiLanguage=en (retrieved on 12/23/2009).
Financial Times (2009a): Interview with Robert Zoellick, 2 December 2009.
Financial Times (2009b): Concerns temper positive jobs data, 31 October/1 November 2009.
Financial Times (2009c): China dismisses currency pressure, 28 December 2009.
Financial Times (2009e): China considers extra $200bn for CIC sovereign wealth fund, 21 December 2009.
Financial Times (2009f): China’s banks see rise in net profits, 30 October 2009.
Financial Times (2009g): China’s external surplus set to halve, 5 November 2009.
Financial Times (2009h): Chinese banks aim to boost capital, 22 December 2009.
Financial Times (2009i): Big shift benefits emerging markets, 24/25 October 2009.
Financial Times (2009j): Russian economy plummets 10.1%, 15 July 2009.
Financial Times (2009k): Kremlin looks for a way to come in from the cold, 18 December 2009.
Financial Times (2009l): Russia aims to cool passion for the rouble as oil prices rise, 11 November 2009.
Financial Times (2009m): Betting on emerging markets, 17 December 2009.
Ghosh, J. and Chandrasekhar, C. P. (2009): The costs of ‘coupling’: the global crisis and the Indian economy, In: Cambridge Journal of Economics, Vol. 33, No. 4, pp. 725-739.
Goldman Sachs (2007): Asia Economics Flash, 24 September 2007,
http://www2.goldmansachs.com/china/ideas/chinese-observations/research-docs/res-9.pdf (re-trieved
on 10/24/2009)
Griffith-Jones, S. and Ocampo, J. A. (2009): The financial crisis and its impact on developing countries, International Policy Centre for Inclusive Growth, Working Paper No. 53.
ILO (International Labor Organization) (2009a): Global Employment Trends, January 2009, Geneva.
ILO (International Labor Organization) (2009b): Global Trends, December 2009,
http://www.ilo.org/public/libdoc/jobcrisis/download/statistics/2009-12/0-global_trends_dec09 .pdf
(retrieved on 12/26/2009).
ILO (International Labor Organization) (2009c): World of Work Report 2009, Geneva.
IMF (International Monetary Fund) (2007): World Economic Outlook 2007, Washington DC.
IMF (International Monetary Fund) (2008): World Economic Outlook Update, 6 November 2008, Washington DC.
IMF (International Monetary Fund) (2009a): World Economic Outlook Update, 8 July 2009, Washington DC.
IMF (International Monetary Fund) (2009b): Global Financial Stability Report 2009, Washington DC.
Izquierdo, A., Romero, R. and Talvi, E. (2008): Booms and Busts in Latin America. The Role of External Factors, Inter-American Development Bank, Working Paper No. 631.
JP Morgan (2009): Pillars of a New Paradigm. Emerging Asia infrastructure,
www.jpmorgan.com/directdoc/pillars.pdf(retrieved on 12/09/2009).
Kohn, D. L. (2008): Global Economic Integration and Decoupling, Speech at the International
Research Forum on Monetary Policy, Frankfurt, Germany, 26 June 2008,
http://www.federalreserve.gov/newsevents/speech/kohn20080626a.htm (retrieved on 10/29/2009).
Kose, A., Otrok, C. and Prasad, E. (2008): Global Business Cycles: Convergence or Decoupling?, IMF Working Paper No. 08/143, June 2008.
Levy-Yeyati, E. (2009): On emerging markets decoupling and growth convergence, Column on voxeu.org on 7 November 2009, http://www.voxeu.org/index.php?q=node/4172 (retrieved on 12/09/2009).
Lewis, A. (1979): The Slowing Down of the Engine of Growth, Nobel Prize Lecture, 8 Dec-ember 1979, http://nobelprize.org/nobel_prizes/economics/laureates/1979/lewis-lecture.html (retrieved on 11/29/2009).
Oakley, D. (2009): Building Success, In: Financial Times, Supplement on the Future of Finance, Part four: the global economy, 9 November 2009.
Ocampo, J. A. (2009): Latin America and the global financial crisis, In: Cambridge Journal of Economics, Vol. 33, No. 4, pp. 703-724.
Ocampo, J. A., Rada, C. and Taylor, L. (2009): Growth and Policy in Developing Countries: A Structuralist Approach, New York: Columbia University Press.
Ocampo, J. A. and J. Ros (2008): Uneven Economic Development, London: Zed Books.
Palit, A. (2009): Are we decoupling yet again? Column on 22 September 2009 on
www.financialexpress.com/news/column-are-we-decoupling-yet-again/519779/2 (retrieved on
10/31/2009).
Palley, T. (2008): Decoupling vs. the Concertina Effect, Blog entry on 8 September 2008,
http://www.thomaspalley.com/?p=125 (retrieved on 12/28/2009).
Park, C.-Y. (2009): Asia: No Safe Haven in Financial Panic, Column on voxeu.org on 3 February 2009, www.voxeu.org/index.php?q=node/2980(retrieved on 12/09/2009).
Rose, A. (2009), Debunking ’decoupling’, Column on voxeu.org on 1 August 2009,
http://www.voxeu.org/index.php?q=node/3829 (retrieved on 12/09/2009).
Smith, D. (2006): A new locomotive for global growth, Blog entry on 26 November 2006,
http://www.economicsuk.com/blog/000409.html (retrieved on 10/31/2009).
Subbarao, D. (2009): Impact of the Global Financial Crisis on India: Collateral Damage and Response, In: Reserve Bank of India Bulletin, March 2009, pp. 385-391.
The Economist (2009a): Decoupling 2.0, 21 May 2009.
The Economist (2009b): Round and round it goes, 22 October 2009.
The Economist (2009c): Burgeoning bourgeoisie, 12 February 2009.
UN (United Nations) (2009): World Economic Situation and Prospects 2009. Update as of mid-2009, New York.
UNCTAD (2009b): World Investment Report 2009, Geneva.
UNCTAD (2009c): Assessing the impact of the current financial and economic crisis on global FDI flows, April 2009, Geneva.
UNCTAD (2009d): Impact of Global slowdown on India’s exports and employment, Draft report by the UNCTAD India Team, May 2009.
Wälti, S. (2009a), The myth of decoupling, manuscript, Swiss National Bank, Zurich.
Wälti, S. (2009b), The myth of decoupling, Column on voxeu.org on 27 July 2009,
http://www.voxeu.org/index.php?q=node/3814 (retrieved on 10/31/2009).
World Bank (2009a): Global Economic Prospects 2009: Commodities at the Crossroads, Washington DC.
World Bank (2009b): China Quarterly Update, March 2009, World Bank Office Beijing.
WTO (World Trade Organization) (2009): WTO sees 9% global trade decline in 2009 as recession
strikes, WTO press release 554/2009, 23 March 2009,