A Genetic Algorithm for Identifying Overlapping
Communities in Social Networks Using an Optimized
Search Space
Brian Dickinson, Benjamin Valyou, Wei Hu Department of Computer Science, Houghton College, Houghton, USA
Email: [email protected]
Received July 21, 2013; revised August 25, 2013; accepted October 14, 2013
Copyright © 2013 Brian Dickinson et al. This is an open access article distributed under the Creative Commons Attribution License, which permits unrestricted use, distribution, and reproduction in any medium, provided the original work is properly cited.
ABSTRACT
There are currently many approaches to identify the community structure of a network, but relatively few specific to detect overlapping community structures. Likewise, there are few networks with ground truth overlapping nodes. For this reason, we introduce a new network, Pilgrim, with known overlapping nodes, and a new genetic algorithm for de- tecting such nodes. Pilgrim is comprised of a variety of structures including two communities with dense overlap, which is common in real social structures. This study initially explores the potential of the community detection algorithm LabelRank for consistent overlap detection; however, the deterministic nature of this algorithm restricts it to very few candidate solutions. Therefore, we propose a genetic algorithm using a restricted edge-based clustering technique to detect overlapping communities by maximizing an efficient overlapping modularity function. The proposed restriction to the edge-based representation precludes the possibility of disjoint communities, thereby, dramatically reducing the search space and decreasing the number of generations required to produce an optimal solution. A tunable parameter r allows the strictness of the definition of overlap to be adjusted allowing for refinement in the number of identified overlapping nodes. Our method, tested on several real social networks, yields results comparable to the most effective overlapping community detection algorithms to date.
Keywords: Overlapping Community Detection; Genetic Algorithm; Social Networks
1. Introduction
Many complex systems, such as social networks, autono- mous systems, and html structures, can be usefully rep- resented as graphs of edges and nodes. Communities, defined as subsets of nodes with more internal edges than external edges, reveal interrelated subgroups within net- work structures. Information on these community struc- tures can provide useful information about systems them- selves. A variety of methods for detecting these commu- nities have been proposed. Unfortunately, most commu- nity detection algorithms treat communities as discrete sets of nodes, not allowing for overlap. However, this classification does not represent the actual structure of many complex systems; in social networks for example, many people belong to more than one social group.
Some community detection algorithms have been adapted to find overlapping community structures. Label Propagation Algorithm, or LPA, for example was modi- fied into the Speaker-Listener Label Propagation Algo-
rithm, or SLPA to increase accuracy and enable overlap detection. By assigning communities based on a belong- ing threshold, instead of by strongest belonging, nodes can be part of more than one community [1]. Other algo- rithms, such as Community Overlap Propagation Algo- rithm (COPRA) [2], Greedy Clique Expansion (GCE) [3], and Order Statistics Local Optimization Method (OSLOM) [4] use various methods to determine overlapping mem- berships.
COPRA uses LPA as a basis for its overlapping detec- tion. Instead of assigning each node a single label based on its neighbor’s labels, COPRA assigns each node a belonging coefficient for each community. Whenever a coefficient falls below a threshold it is removed and the remaining coefficients are normalized. If the node does not have any memberships greater than this threshold, it maintains only the coefficient with the highest belonging. The nodes that retain multiple labels at the termination of the algorithm are overlapping nodes.
community structure. A maximal clique is defined as a group of nodes that is entirely connected, and is not part of a larger set of entirely connected nodes. The algorithm begins with as many communities as there are maximal cliques that are larger than the parameter k and greedily expands each, absorbing nodes that maximize a local fitness function. All communities that are too similar to one another are discarded. Because each community ex- pands independently they can absorb the same nodes; these nodes are the overlap between two or more com- munities.
OSLOM works by finding the smallest significant communities in the network and building up a hierarchi- cal structure. In each iteration, the smallest significant communities are detected. In the following iteration each of these communities is treated as a node, with the con- nections between communities refactored into weighted edges. The process is repeated until the entire network is joined together. Again, like in GCE, overlapping nodes may be identified because each community is detected independently, and the optimal structures for two com- munities might both contain a single node.
These algorithms demonstrate the variety of methods employed to detect overlapping community structure. Unfortunately there are only a few networks with known overlapping structure on which these algorithms may be compared. As a substitute, social networks with unknown overlapping structure may be used along with overlap- ping fitness functions to make a rough comparison in the same way that networks with unknown ground truths can still be analyzed using modularity. Our study introduces a new community detection technique based on genetic algorithms, and evaluates it on networks with and with- out known overlapping structures, producing both high modularity scores and accurate detection of known over- lapping nodes.
2. Networks
This study makes use of a total of seven real-world social networks: karate [5], lesmis [6], dolphins [7], books, football [8], jazz [9], and Pilgrim. Karate is a well-known friendship network of a karate club in the 1970’s. Lesmis represents the co-appearance of characters in Victor Hugo’s Les Miserables. Dolphins are a collection of the associations of dolphins studied off the coast of New Zealand. Books represent the co-purchasing of political books on Amazon at the time of the 2004 US presidential election. Football is composed of the games played by Division IA college football teams in 2000. Jazz repre- sents the collaboration network of a selection of Jazz mu- sicians. Finally Pilgrim is a newly introduced network built on the social intertions of a high school class.
The Pilgrim high school network is composed of 34
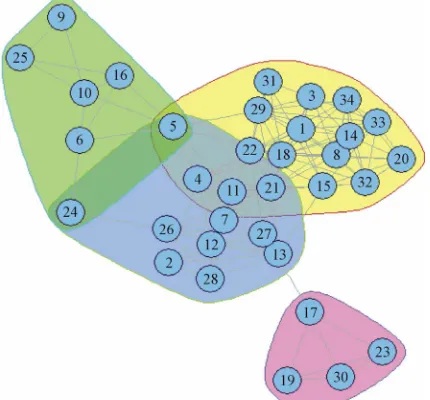
nodes and 128 edges based on the friendship structure of a single class. It was created by two members of the class, Dickinson and Lieb, from experience in different com- munities within the class. The density of the graph is not uniform, resulting in a variety of different community structures. Some portions of the graph are very sparsely connected, while others form cliques. There is also a heavy amount of overlap between two of the larger com- munities presenting an interesting problem for algorithms designed to produce overlapping partitions. The basic ground truth community structure of this network is known, as is the overlapping community structure. Be- cause it is a relatively small network, the overlap may be easily represented and studied as in Figure 1.
3. Modularity
Probably the most widely used measure for evaluating the goodness of a community structure without a ground truth is Newman’s modularity function [10]. Modularity is a metric of the difference in the internal density of the community structures before and after a random rear- rangement of the edges of the graph (1). The full defini- tion of the function has been omitted because of its common use. This function is only compatible with dis- joint communities in a graph. There are, however, two variations of modularity designed specifically for evalu- ating overlapping community structures.
,
, 1
2 2
i j i j ij i j V
k k
Q c c A
m m
(1) [image:2.595.317.532.506.706.2]In [11], Shen introduced EQ, an adaptation of New- man’s modularity function designed to support overlap- ping communities. The equation for EQ strongly resem-
bles the original modularity function (2) (1). In this equa- tion, m is defined as the number of edges in the graph. C is the set of communities, and Ov is the number of com-
munities to which the node v belongs. The presence of an edge between two nodes v and w is represented as the value in the corresponding position of the adjacency ma- trix Avw. This equation reduces to the same value as
modularity when each node is a member of only one community.
,
1 1
2
i j ij c Ci c j c i j
k k
EQ A
m O O
2m (2)Another metric proposed in [12] by Nicosia provides a more complex and potentially more accurate evaluation of the goodness of an overlapping community structure (3). This measure makes use of several additional func- tions defined in [12]. For its arbitrary function f = 2px −
p, the recommended p value of 30 has been adopted. As in EQ, C is the set of communities, and V is the set of nodes. In addition to this, rijc and sijc are weights based on
the proportion of belonging to a community. A full ex- planation of them is available in [12]. The time complex- ity of this fitness function is almost O(n3) making it un-
suitable for use inside of an algorithm.
,
1 iout inj ov ijc ij ijc
c Ci j V
k k
Q r A s
m m
(3)4. Algorithms
In this section, we present two different approaches to overlapping community detection. The first is LabelRank, a deterministic variation of SLPA based on the properties of matrix multiplication. The second is a variation of genetic algorithms designed to provide a large variety of potential solutions. The first approach is more efficient, while the second is more thorough.
4.1. LabelRank
LabelRank was proposed by Xie as a stabilization of SLPA [13]. Its results compare favorably with SLPA with the additional benefit of being deterministic. La- belRank works in four phases: propagation, inflation, cutoff, and conditional update. The first phase, propaga- tion, generates a new probability matrix, P', by multiply- ing the current probability matrix by the adjacency ma- trix of the graph. In the initialization of P, each node has an equal probability of belonging to each of its immedi- ate neighbors. The next stage, inflation, accelerates the process of gravitating nodes toward communities by in- creasing high probabilities while simultaneously de- creasing low ones. This function takes a value of 'and
ij P sets it equal to ij
i
P
P where in is the chosen inflation pa-
rameter, and Pi is a row in P. Once the values of P' have
been inflated, the cutoff phase sets all values smaller than some threshold r
0,1 equal to 0. This reduces the amount of memory necessary to maintain the matrix without having an effect on the results of the algorithm. The final phase is the conditional update in which only nodes meeting certain conditions have their rows of the probability matrix altered. This function requires that the set of most probable labels for node i be a subset of the most probable label sets of a certain threshold q of its neighbors. A conditional update is used to prevent the quality of the partition from decreasing after it reaches its peak. The algorithm terminates when the number of nodes changing their labels stabilizes.Because LabelRank produced similar, and often better, performance when compared to SLPA, it showed pro- mise for being adapted to detect overlapping communi- ties. In fact, the only necessary modification was the in- troduction of a proportion of membership threshold α. After termination instead of assigning each node its ma- ximum probability label, each node is assigned every label for which it has a probability greater than α. If no probabilities are greater than α, then the maximal prob-ability label is allotted. This simple modification was designed to enable LabelRank to detect overlap in the same way that SLPA does.
4.2. Overlap-Detection Genetic Algorithm
LabelRank has the distinct property of being determinis- tic. Because our initial testing showed that in many cases this could be a disadvantage, a new algorithm for detect- ing overlapping communities was developed based on previous genetic algorithms. The genetic algorithm for overlap detection, abbreviated OGA, unlike LabelRank provides a variety of potential solutions. It requires sev- eral parameters defined as follows: a specified number of iterations iter, a proportion of the population to maintain as the fittest f, a crossover rate q, a mutation rate mut, and a membership threshold r. This algorithm uses an edge- based representation for clustering in order to detect overlapping communities of nodes [14]. In order to re- duce the search space to likely partitions, a similar rep- resentation to that of [15] is used. The gene is the same length as the edge set of the graph. Each index represents an edge, and the corresponding value also represents an edge. The pairing of two edges in the gene indicates that they share a community. The pseudo code for OGA is presented in Algorithm 1.
Algorithm 1: OGA
Input: graph, popSize, iter, f, q, mut, r # n is the number of nodes in the graph # A is the adjacency matrix of the graph
population matrix(n, popSize)
for each row in population: row = generate_individual() end for
for i in 1 to iter:
fittest evaluate(population, f) population crossover(fittest, q) population mutate(population, mut) end for
generate_individual() for i in 1 to n:
individual[i] random(neighbors(graph, i)) end for
return individual
evaluate(population, f)
population sort(population, fitness) fittest list()
for i in 1 to popSize ×f: fittest.add(population[i]) end for
return fittest
crossover(fittest, q)
for each individual in population: father random(fittest) mother random(fittest) for i in 1 to n:
if random(0 to 1) > q: individual[i] father[i] else
individual[i] mother[i] end for
end for
return population
mutate(population, mut)
for each individual in population: for i in 1 to n:
if random(0 to 1) < mut:
individual[i] random(neighbors (graph, i))
end for end for
return population
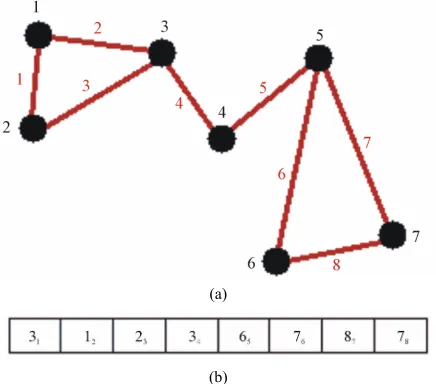
The first step of OGA is to generate a random, safe population. In this context, safe means that an edge pair- ing can only take place between adjacent edges in the network. In generating the random safe population the value at each position of the gene is selected randomly from the edge sets of the two nodes connected to that edge. In doing so, the total search space for the algorithm is greatly reduced without removing possibly-maximal
solutions. An example of this structure in relation to a graph is given in Figure 2.
The next several operations of the algorithm are re- peated for the predefined number of iterations, iter. First the fittest members of the population are selected out of the population. This requires a fitness function through which to compare genes, and a percentage threshold to determine the size of the fittest. The chosen fitness func- tion is the faster of the two overlapping modularity func- tions, EQ. Results should be improved by maximizing one of the measures of the goodness of overlapping par- titions.
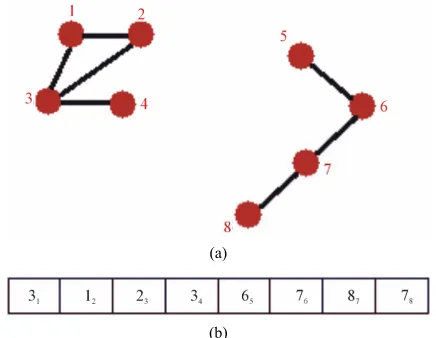
In order for this function to be useable, however, the membership must be converted to a node-based format. The transformation is done using a recursive tracing function. Because each edge in the representation is as- sociated only with one other edge, these connections must be traced outward from a starting edge to discover the entire community. If the edges were treated as nodes, and their associations taken from the gene as edges, the edge communities would be the disjoint sub graphs of the network as seen in Figure 3. This provides a non-over- lapping community partition of the edges. In order to determine the required node membership, a simple per- centage is calculated. The membership to each commu- nity is the number of labels matching that community in the edge set of the node divided by the degree of that node. If this value is higher than some threshold r then the node belongs to that community. Nodes without any memberships greater than r are assigned to the commu- nity to which they have the highest membership. For example, in the sample graph node four would belong to
(a)
(b)
Figure 2. (a) Example graph; (b) A safe gene for the net- work in (a) for example 31 implies a pairing of edges 3 and 1
[image:4.595.314.532.475.667.2](a)
(b)
Figure 3. (a) Representation of an edge-based gene where edges are represented by nodes. Edges in the graph link edges paired in the gene; (b) Gene from which the network (a) was created. Note that gene1 = 3 so there is an edge be-
tween 1 and 3.
both communities because half of its edges are in each community Figure 2.
The next step of OGA is to generate a new population from the fittest by selecting two parents and crossing them over. The crossover is performed using a crossover rate q. For each position in the gene, the child has a q probability of receiving the value from the first parent, and a 1 − q probability of receiving it from the second. Because both parents were initialized with safe genes, the child is necessarily safe. If the value exists at a position in the parent, then the two edges must share a node.
Crossover is followed by a repaired mutation [15]. A normal mutation, in which random values are assigned to randomly selected positions in genes, would explore unlikely solutions and make genes unsafe. Instead, the value at any edge randomly selected according to the mutation rate is set to the index of an adjacent edge. In doing this, the population remains safe, and the search space does not expand unnecessarily. Following this step, the process is repeated for the specified number of itera- tions, after which the fittest gene of the entire process is returned.
The approximate time complexity of the initialization, crossover, and mutation functions is . Because the search space is greatly reduced by the safe representation used, the number of iterations required scales linearly as well, keeping the time complexity be- low . The only remaining bottleneck on the run- time is the fitness function itself, which in this case has a time complexity of . Therefore the overall run- time of OGA is .
Size
O m pop
2 O n
2 O n
2 O n5. Results
In this section, we first experiment with our adaptation of
LabelRank as an overlapping community detection algo- rithm before concluding that the efficiency gains due to its deterministic nature were less important than the maximal accuracy which was lost. In response to this, we present the results of our proposed overlapping commu- nity detection algorithm alongside SLPA across several real world social networks using EQ and Qov modularity
scores as our evaluation criteria. To further demonstrate the performance of our algorithm, and the flexibility pro- vided by its r parameter, we compare our identified over- lapping communities to those of the ground truth on the Pilgrim network.
5.1. LabelRank on Overlapping Communities
The modified LabelRank algorithm was tested on our selected networks against SLPA. SLPA was chosen as a baseline for comparison because of its affinity with La- belRank, and its excellent performance in comparison with other algorithms for detecting overlapping commu- nity structures [16]. Both algorithms were tuned on a full range of parameters. LabelRank used the following pa- rameter ranges: in{1,1.5, 2}, q{0.5,0.6}, r{0.1},
and {0.1,0.15,0.2,0.25,0.3}. SLPA was run with
varying numbers of iterations , and various thresholds
{25,50,75,
it
.15,0.2,0.25,0.3 100} } {0.1,0
. During
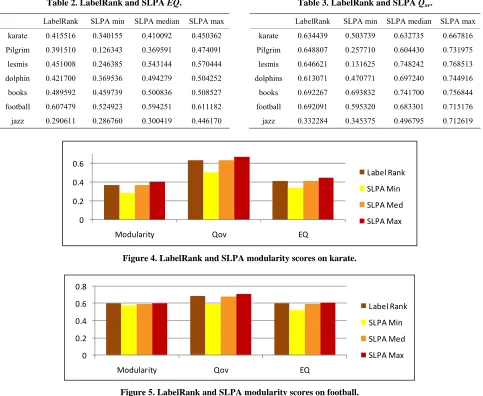
the tuning phase, SLPA was run ten times with each pos- sible combination of its parameters on every graph. The parameter set that resulted in the highest overlapping modularity values for each graph was then used to pro- duce a final result. Using these parameters, SLPA was run nine more times recording the minimum, median, and maximum modularity scores for each modularity function. LabelRank too was run using its optimal pa- rameters to produce the modularity scores recorded in Tables 1-3.
[image:5.595.63.281.85.254.2]From these results, it appears that LabelRank generally performs close to the median modularity of SLPA. These results are illustrated in Figures 4 and 5. When Label- Rank is optimized to perform its function with as little unnecessary overhead as possible, its runtime is linear [13]. This is approximately the same runtime as SLPA [1]. Since both algorithms have approximately the same
Table 1. LabelRank and SLPA modularity.
LabelRank SLPA min SLPA median SLPA max
karate 0.371466 0.28709 0.37147 0.40204
Pilgrim 0.437805 0.08859 0.36905 0.43732
lesmis 0.444812 0.23090 0.526668 0.540796
dolphin 0.491515 0.33794 0.47076 0.49017
books 0.492297 0.44860 0.49359 0.50878
football 0.603070 0.58062 0.59874 0.60307
[image:5.595.309.539.621.736.2]Table 2. LabelRank and SLPA EQ. Table 3. LabelRank and SLPA Qov.
LabelRank SLPA min SLPA median SLPA max
karate 0.415516 0.340155 0.410092 0.450362
Pilgrim 0.391510 0.126343 0.369591 0.474091
lesmis 0.451008 0.246385 0.543144 0.570444
dolphin 0.421700 0.369536 0.494279 0.504252
books 0.489592 0.459739 0.500836 0.508527
football 0.607479 0.524923 0.594251 0.611182
jazz 0.290611 0.286760 0.300419 0.446170
LabelRank SLPA min SLPA median SLPA max
karate
0.634439 0.503739 0.632735 0.667816
Pilgrim 0.2577100.648807 0.604430 0.731975
lesmis
0.646621 0.131625 0.748242 0.768513
dolphins 0.4707710.613071 0.697240 0.744916
books
0.692267 0.693832 0.741700 0.756844
football 0.5953200.692091 0.683301 0.715176
jazz
0.332284 0.345375 0.496795 0.712619
0 0.2 0.4 0.6
Modularity Qov EQ
Label Rank
SLPA Min
SLPA Med
SLPA Max
Figure 4. LabelRank and SLPA modularity scores on karate.
0 0.2 0.4 0.6 0.8
Modularity Qov EQ
Label Rank
SLPA Min
SLPA Med
SLPA Max
Figure 5. LabelRank and SLPA modularity scores on football.
runtime LabelRank is better suited for detecting overlap-ping partitions on large networks. This is because the result of LabelRank is deterministically approximately that of the median SLPA score. It would likely take seve- ral runs of SLPA to produce a higher score, and doing so would take several times as much processing time and power.
This does not change the fact that SLPA can produce higher modularity scores given more opportunities to run. Since LabelRank simulates the spread of labels strictly according to probabilities it is unsurprising that it results in scores near the median SLPA scores. Because SLPA allows these probabilities to act on the spread of labels randomly it produces some variation from that median point. Many of these variations will influence the quality of the partition negatively, but some will have a positive influence on the result allowing SLPA to produce higher maximal scores. SLPA is able to perform better over multiple runs because it has an enlarged search space which generates a pool of candidates from which to
choose the preferred solution.
5.2. OGA in Overlapping Community Detection
the highest results of SLPA after 9 runs as can be seen in Table 4 and Figures 6 and 7.
The overlapping modularity scores of OGA are very close to those of SLPA on every network. This implies a particularly good partitioning considering [16] deter- mined that SLPA is one of the most consistently accurate algorithms for detecting overlapping community struc- ture. Of the fourteen algorithms tested in [16] SLPA was among the top performers on each network.
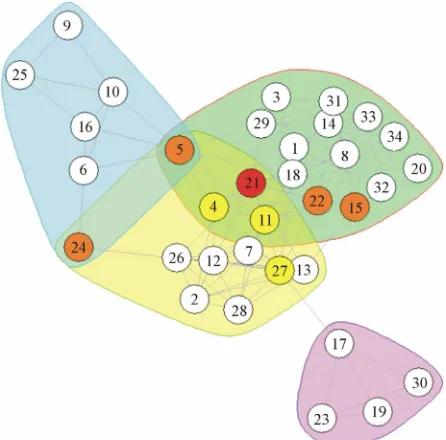
Analyzing the identified overlap in the Pilgrim net- work yields interesting results. The only detected over- lapping node in the optimal modularity solution for Pil- grim was 21. In the next run, with a slightly lowered r value OGA produced a slightly lower modularity result, but a much more accurate list of overlapping nodes. This second list included the following nodes: 5, 15, 24, 21, and 22. Of these 5 nodes, 3 are overlapping in the ground truth, while the other 2 are very close to the community borders. When the r parameter was reduced slightly fur- ther, it produced a larger list of overlapping nodes, now including 4, 11, and 27, and removing 22. This list in- cludes all 5 ground truth overlapping nodes, including only 2 additional nodes that are not quite overlapping. All of these results are displayed in Figure 8. The colors, red, orange, and yellow, correspond to the lowest r value 0.2, 0.1, and 0.08, under which a given nodes was cate-
gorized. Outline colors show the ground truth of the net- work.
Further analysis of these results was done using the F-score to evaluate the detection of overlapping nodes. A correctly identified overlapping node is a true positive, or TP. Similarly a node incorrectly identified as overlapping is a false positive or FP. Inversely nodes not identified as overlapping which in fact are constitute false negatives, FNs, and nodes correctly identified a s not overlapping are true negatives, TNs. These counts are used to calcu-
late precision and recall which are TP
TP FP and TP
TP FN , respectively. Precision then represents the percentage of nodes classified as overlapping which are in fact overlapping, and recall is the percentage of ground truth overlapping nodes identified. These two metrics may be combined into an F-score,
precision recall 2
precision recall
producing scores between 0 and 1 where 1 is the optimal result. This metric balances the optimization between two goals, discovering all overlapping nodes and only discovering truly overlapping nodes. The relationship
Table 4. OGA and SLPA overlapping modularities on several real social networks.
Modularity Algorithm karate Pilgrim lesmis dolphins football
OGA 0.445225 0.472687 0.578773 0.540742 0.603323
EQ
SLPA 0.450362 0.474091 0.570444 0.504252 0.611182
OGA 0.637640 0.735629 0.746658 0.752494 0.712163
Qov
SLPA 0.667816 0.731975 0.768513 0.744916 0.715176
0 0.2 0.4 0.6 0.8
karate pilgrim lesmis dolphins football
EQ OGA
SLPA
Figure 6. OGA and SLPA EQ on several real social networks.
0 0.2 0.4 0.6 0.8
karate pilgrim lesmis dolphins football
Qov OGA
[image:7.595.51.538.421.739.2]SLPA
Figure 8. Pilgrim network with nodes detected by OGA and ground truth overlapping nodes. The nodes identified by OGA are colored in yellow, orange, and red. Colored out- lines represent the ground truth overlapping communities in which overlapping nodes are encompassed by multiple colored outlines.
0.3 0.4 0.5 0.6 0.7 0.8 0.9
0.2 0.1 0.08
Me
tr
ic
S
c
o
r
e
rThreshold
EQ
Qov
[image:8.595.61.287.388.512.2]F-score
Figure 9. F-score comparison between overlapping nodes identified by OGA and the ground truth overlapping nodes on the Pilgrim network. The accompanying EQ and Qov scores correspond to the F-score at a given r value.
between modularity and F-score is pictured in Figure 9. As may clearly be seen there is an inverse relationship between the F-score and the two overlapping modularity values, EQ and Qov. This indicates that the ground truth
structure of the network is not the same as the optimal modularity solution. This is quite similar to the disparity between the optimal Newman’s modularity clustering of karate which includes four communities, and the ground truth of only two communities. Our genetic algorithm, by varying the threshold r, is able to detect these other struc- tures. In addition to this, should another more accurate metric be developed, all portions of OGA, excluding the current fitness function, would be useful for maximizing any global fitness function.
6. Conclusion
This paper has presented a genetic algorithm for overlap- ping community detection, OGA, comparable to SLPA, one of the best existing algorithms, in performance. Us- ing a restricted representation to limit the number of pos- sible partitions, the time complexity is reduced toO n
2 .In addition to this the genetic structure of OGA provides flexibility to introduce new fitness functions. The EQ and Qov scores of this algorithm are on par with SLPA, one of
the premier algorithms for detecting overlapping com- munity structure in social networks. Comparing this dis- covered overlap with the ground truth overlapping struc- ture of Pilgrim reveals some disparity between optimal modularity and ground truth community structures. This demonstrates the usefulness of networks with ground truth overlapping structure for the evaluation of commu- nity detection algorithms.
7. Acknowledgements
We would like to thank the Houghton College Summer Research Institute for the funding and opportunity to perform this research. Also, thanks to Dr. Jierui Xie at Samsung for providing the C++ source for LabelRank. Finally we would like to thank Keith Lieb for contribut- ing to the construction of the Pilgrim high school net- work.
REFERENCES
[1] J. Xie, B. K. Szymanski and X. Liu, “SLPA: Uncovering Overlapping Communities in Social Networks via A Speaker-listener Interaction Dynamic Process” Proceed- ings of Data Mining Technologies for Computational Collective Intelligence Workshop at ICDM, Vancouver, 2011, pp. 344-349.
[2] S. Gregory, “Finding Overlapping Communities in Net- works by Label Propagation,” New Journal of Physics, Vol. 12, 2010, Article ID: 103018.
http://dx.doi.org/10.1088/1367-2630/12/10/103018 [3] C. Lee, F. Reid, A. McDaid and N. Hurley, “Detecting
Highly Overlapping Community Structure by Greedy Clique Expansion,” eprint arXiv, 2010.
[4] A. Lancichinetti, F. Radicchi and J. Ramasco, “Finding Statistically Significant Communities in Networks”, PLoS One, Vol. 6, No. 4, 2011, p. e18961.
http://dx.doi.org/10.1371/journal.pone.0018961
[5] W. W. Zachary, “An Information Flow Model for Con- flict and Fission in Small Groups,” Journal of Anthropo- logical Research, Vol. 33, No. 4, 1977, pp. 452-473. [6] D. E. Knuth, “The Stanford Graph Base: A Platform for
Combinatorial Computing,” Addison-Wesley Reading, Boston, 1993.
tion of Long-Lasting Associations,” Behavioral Ecology and Sociobiology, Vol. 54, No. 4, 2003, pp. 396-405. http://dx.doi.org/10.1007/s00265-003-0651-y
[8] M. Girvan and M. E. J. Newman, “Community Structure in Social and Biological Networks,” Proceedings of the National Academy of Sciences of USA, Vol. 99, No. 12, 2002, pp. 7821-7826.
[9] P. Gleiser and L. Danon, “Community Structure in Jazz,”
Advanced Complex Systems, Vol. 6, No. 4, 2003, p. 565. http://dx.doi.org/10.1142/S0219525903001067
[10] M. E. J. Newman, “Finding and Evaluating Community Structure in Networks,” Physical Review E, Vol. 69, No. 2, 2004, p. 026113.
[11] H. Shen, X. Cheng, K. Cai and M. B. Hu, “Detect Over- lapping and Hierarchical Community Structure in Net- works,” Physica A, Vol. 388, No. 8, 2009, pp. 1706-1712. http://dx.doi.org/10.1016/j.physa.2008.12.021
[12] V. Nicosia, G. Mangioni, V. Carchiolo and M. Malgeri, “Extending the definition of modularity to directed graphs with overlapping communities,” Journal of Statistical Mechanics, Vol. 2009, 2009, Article ID: P03024.
http://dx.doi.org/10.1088/1742-5468/2009/03/P03024 [13] J. Xie and B. K. Szymanski, “LabelRank: A Stabalized
Label Propagation Algorithm for Community Detection in Networks”, Proceedings of IEEE Network Science Workshop, West Point, 2013, pp. 138-143.
[14] Y. Cai, C. Shi, Y. Dong, Q. Ke and B. Wu, “A Novel Genetic Algorithm for Overlapping Community Detec- tion”, 7th International Conference Advanced Data Min- ing and Applications, Vol. 7120, December 2011, pp. 97-108. http://dx.doi.org/10.1007/978-3-642-25853-4_8 [15] C. Pizzuit, “A Multi-objective Genetic Algorithm for
Community Detection in Networks,” 21st International Conference on Tools with Artificial Intelligence, Newark, 2-4 November 2009, pp. 379-386.
http://dx.doi.org/10.1109/ICTAI.2009.58
[16] J. Xie, S. Kelley and B. Szymanski, “Overlapping Com- munity Detection in Networks: The State of the Art and Comparative Study,” ACM Computing Surveys, Vol. 45, No. 4, 2013, pp. 1-35.