Operating Analysis and Data Mining System for Power
Grid Dispatching
Haiming Zhou1, Dunnan Liu2, Dan Li1, Guanghui Shao3, Qun Li3
1
China Electric Power Research Institute, Beijing, China
2
School of Economics and Management, North China Electric Power University
3
Northeast China Grid Company, Shenyang, China
Email: haimingzhou@ 163.com, [email protected], [email protected]
Received January, 2013
ABSTRACT
The dispatching center of power-grid companies is also the data center of the power grid where gathers great amount of operating information. The valuable information contained in these data means a lot for power grid operating manage-ment, but at present there is no special method for the management of operating data resource. This paper introduces the operating analysis and data mining system for power grid dispatching. The technique of data warehousing online ana-lytical processing has been used to manage and analysis the great capacity of data. This analysis system is based on the real-time data of the power grid to dig out the potential rule of the power grid operating. This system also provides a research platform for the dispatchers, help to improve the JIT (Just in Time) management of power system.
Keywords: Power Grid Dispatch; Index System; Data Mining
1. Introduction
Network control center is the center of the grid operating data, a large amount of data that produced from SCADA, EMS, CPS and other systems contains a grid in the op-eration and safety of all of the information. However, the current dispatch center information system is mainly for data collection, storage and simple summary of query of daily operations, and not specifically for a lot of histori-cal information for effective category management and correlation analysis, cannot effectively use the data from the valuable resource the data extract useful knowledge paired scheduling management.
Data mining techniques [1] is a large database from extracting previously unknown information about the operability of the knowledge discovery process, includ-ing data warehouse [2], online analytical processinclud-ing OLAP [3], and data visualization of the new information science technology. Data mining is widely used in avia-tion, finance, telecommunications and other areas, which have greatly improved data management and deci-sion-making; in the power industry, data mining system has been in power market analysis, supply market analy-sis and other fields to be effectively applied. Therefore, it is technologically advanced and practical feasibly for data mining techniques applied to power scheduling analysis.
The measures of establishing dispatching operation analysis and data mining systems, effectively
manage-ment and scientific analysis for power grid data, do good use for the summed experience of power grid, the explo-ration of the power grid law in order to provide the anal-ysis platform for the dispatchers and improve the level of dispatching and scientific decision-making.
This paper first describes the content of the dispatch-ing operation analysis and the system of the index evalu-ation, and then describes the data warehouse platform and the analysis techniques of multidimensional data of data analysis, finally describes examples of data mining with the actual needs of dispatching operation.
2. Dispatching Content
It is supposed to monitor and compute the status of all aspects of dispatching operation, in order to facilitate the refinement of grid operation management, accumulate data and experience under the conditions of the electric-ity market, continuously improve network securelectric-ity, qual-ity, economic operation, and ensure grid security and stability.
Dispatching indicator system is to quantitatively re-flect the operations of all aspects of the grid, and make comprehensive and clear understanding on the main fea-tures of network parameters for the scheduling staff through the calculation and analysis of a series of core indicators.
need to analyze and evaluate the power grid control class, scheduling classes, statistical analysis class, with the purpose of forming the closed-loop feedback mechanism of the accuracy of network control and the rationally scientific operation mode, and to achieve meticulous management of the power grid.
2.1. Run Control Class Indicators
Categories grid operation control targets should real-time record automatically generated indicators report and power grid index quantification statistics according to the EMS and other automated systems for the inspection of the relevant analysis.
Scheduling on duty should be able to real-time view the running control class indicators and the basic content, in order to adopt appropriate control measures to con-tinuously improve the level of the grid control. These include the following indicators:
1) Frequency indicators:
Include the highest power, lowest frequency, out of 50 ± 0.2 Hz of the frequency of the more limited running time, 50 ± 0.1 Hz of frequency pass rate.
2) Tie-line indicator:
Including the tie-line A1/A2 or CPS1/CPS2 more lim-ited number.
3) Important trends of bound cross-section:
Include the cumulative time and the percentage of total calendar time of an important trend over stable section running limits, the important trend of cross-section limit of 90% to 100% of the total time and percentage of total calendar time.
4) Standby indicator:
Include: real-time spinning reserve capacity and day 96 load ratio of the percentage of the maximum and minimum values, the ratio of the percentage of an FM unit Number of units and operating units Number of units, the total available capacity of investment in an FM unit, minimum spinning reserve capacity during peak hours, spinning down maximum output capacity during low hours.
5) Voltage indicators:
Include the voltage passing rate of the plant site under the jurisdiction, the proportion of the total number of stations under the jurisdiction of plants of the lower limit of the peak voltage, the proportion of the number of ju-risdiction of plants under the total number of stations in the low hours of maximum voltage.
2.2. Scheduling Class Indicators
1) Load characteristics of indicators:
Include: maximum / minimum load, maximum load at the same time rate, which is the whole network maxi-mum load and net provincial, city (region or control area)
ratio of the sum of the maximum load; net provincial, city (region or control area), maximum rate of change on rise and decrease of 96 points load in the more than 220 kV substation, the deviates of 96 points on the load fore-cast and the actual load value more than ±2% of the points and so on in net provinces (or control area).
2) Power balance indicators
Include: the completion of day, month power supply; the completion of selected power plant project.
3) Standby indicator:
Include: spinning reserve to meet the rules of order, 10 minutes to bring up the emergency and alternative situa-tion, 30 minutes to control the load standby conditions.
4) Maintenance plan targets:
Include: the completion of scheduled maintenance and the rationality of repairing plan.
5) Indicators of low-frequency load shedding:
Include: real cut capacity of low-frequency load shed-ding partition, the real fault cut capacity to meet the var-ious regions of the maximum possible N-1 components.
6) System automatic safety device index:
Include: the adaptability of installation strategies, the rationality of device configuration.
7) Voltage indicators:
Include: the rationality of the central point reactive power arrangement, the average in the plant station under the jurisdiction of the peak voltage, low hours.
8) Important indicators of the transmission section: Include: the number and total time of the running trend over stable limit, the number and total time of the run-ning trend in the 80% to 100%.
2.3. Use of KPI
Once we’ve identified the Key Performance Indices for the business, it is ready to filter these down to the ana-lyzers. The KPI usually have these three functions:
1) Reflect the Targets
Where possible offer incentives linked to targets, and encourage analyzers to involve staff in the setting of their targets. For example, a sales analyzer may set the sales team targets of a certain number of new contacts per week or visits per month. A production manager might set targets for output, reject rate or work breaks.
2) Find the Cause
Set review dates and compare against previous figures, your business plan, budget or other agreed standard. If you spot an anomaly or problem, the KPI will help to backtrack and pinpoint the cause.
3) Report regularly
2.4. Statistical Analysis of Categories of Indicators
Statistical analysis indicator refers to the statistical anal-ysis of the previous two categories of indicators during a period of time.
1) Total statistics:
The purpose is that to stat the cumulative quantity of some indicators over a period of time. Such as: failure time (seconds) of frequency, the unqualified cumulative number of days and failure time, the maintenance ticket number and the operating ticket number performed monthly, power grid network losses, unplanned generator outage times, and the frequency of fault trip of power lines, bus, together (main).
2) Mean / extreme value statistics:
The purpose is that to stat the maximum, the minimum or the average indicators over a period of time.
Such as: the largest number of operating ticket in sin-gle-day, the 96-points load characteristic curve, together (main) maximum load change rate, water consumption rate of direct transfer hydropower plants, thermal power plant coal consumption rate of direct transfer, high- vol-tage transmission network net loss, 220 kV and more rapid protection line fault removal rate, times of power cuts and the average daily capacity and so on.
3) Percentage statistics:
The purpose is that to stat the ratio between the two types of indicators of the total in a period of time. Such as: the correct rate of the moves of security control de-vice, the tie-line bias and frequency control passing rate, voltage passing rate, load forecasting accuracy, the pass-ing rate of the low-frequency load sheddpass-ing control ca-pacity, the operation rate of unit PSS, the operation rate of unit AGC, the qualified rate of the operating vote.
3. Scheduling Operaion Analysis Data
Warehouse Platform
3.1. Scheduling Integrated Data Warehouse Platform
All the available data relative to the supplier’s bidding can be divided into three classes:
Data Hub is an online system that is designed for Stats analysis and decision support applications. It could meet the decision support and online analytical applications require all. This data is called data warehouse platform.
The establishment of dispatching and comprehensive analysis platform for data mining is responsible for col-lecting all kinds of the required scheduling run data indi-cators in regular time.
1) The basic information of network parameters, pow-er plants and units.
2) Power generation, by the power, the load plan and actual data.
3) Power line trend data, the node voltage data. 4) Local power plants planned and actual data. 5) AGC unit and various indicators of data assessment. 6) Market transactions and load forecast data.
7) Reporting of transactions, transaction data. 8) All kinds of information in regional power market. 9) Regional power grid parameters and inter-provin- cial trade data.
Data warehouse is a new application of a database technology, and so far, the data warehouse is a relational database management system to manage the data.
4. Olap Multidimensional Data Analysis and
Reporting System
Data warehouse contains a lot of data extracted from a number of databases, but these data could play its proper value only by using the right tools and being used effec-tively.
The methods of data mining for the data in the data warehouse to be analyzed include online analytical proc-essing (OLAP), association rule mining, decision tree analysis, cluster analysis and other. Shanghai power sys-tem mainly uses online analytical processing (OLAP) technology.
4.1. Dispatching Multi-dimensional Analysis and Processing
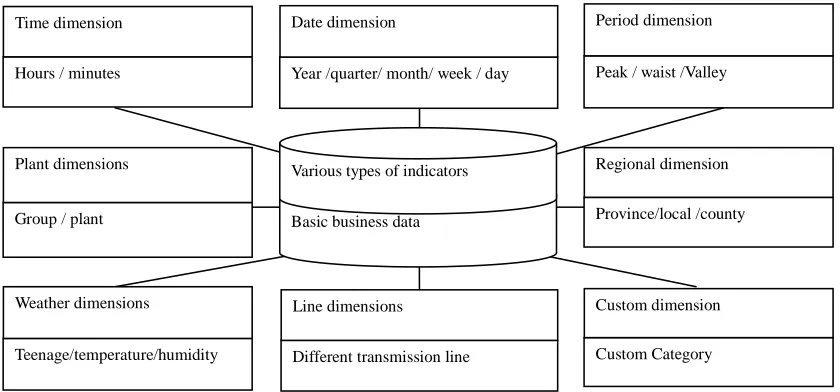
Multi-dimensional data extraction and OLAP data analy-sis could be done by the use of all kinds of data in the dispatching data warehouse. As shown in Figure 1:
1) Time dimension: Data classification according to year, quarter, month, week, day, hour and minute.
2) Period dimension: Data classification according to the three period-peak, trough, and waist load.
3) Regional dimension: Data classification according to different regions.
4) Plant dimensions: Data classification according to power plant, the type (bid/peaking/FM/self) and Power Generation Group.
5) Unit dimensions: Data classification depending on the capacity of the unit.
6) Line dimensions: data analysis depending on the line, the line type.
7) Substation dimensions: Data classification accord-ing to the type of substation and substation.
8) Weather dimensions: Data classification according to the temperature, humidity, the sunny weather or the cloudy weather and other standard.
Year /quarter/ month/ week / day Date dimension
Peak / waist /Valley Period dimension
Custom Category Custom dimension
Different transmission line Line dimensions Basic business data Various types of indicators Hours / minutes
Time dimension
Teenage/temperature/humidity Weather dimensions
Province/local /county Regional dimension
[image:4.595.88.508.85.281.2]Group / plant Plant dimensions
Figure 1. Multi-dimension analysis for power grid data.
4.2. OLAP-based Reporting System 3) Annual analysis: The aim is to make suggestions and comments for company planning and technical in-novation mainly through the analysis of statistical analy-sis indicators combined with annual operational mode. Then it provides support for the operational mode in the next year.
The previous power system analysis is based on a variety of control model calculations in advance of the simula-tion analysis, the schedule data warehouse platform es-tablished by the project, aims to statistically analyze and data excavate a large number of historical data, and find the potential operational law from the long-term accu-mulation. These all cannot be achieved in any previous analysis methods and models.
The operator is supposed to strengthen communication and coordination with the company development of in-frastructure, production, safety supervision, marketing, trading and other relevant departments, and implement corrective measures according to the important issues reflected in the power grid power system analysis. Power grid analysis is divided into day, monthly and
yearly analysis, in accordance with the Requirements of refinement of grid operation. Scheduling classes, statis-tical analysis of categories of indicators should be months, years for analysis. The reporting system should be based on real-time automation systems such as EMS automatic generation of indicators recorded statements and quantify the power grid index statistics for the in-spection of the relevant power system analysis. Dis-patchers on duty should be able to view real-time basic and operational control content class indicators, in order to adopt appropriate control measures to continuously improve the level of the grid control.
The purpose is to get the patterns and trends related to grid operation through the power grid power system analysis statistics and analysis, as the power grid sum-mary information and to make decision thought on the future operation mode of preparation and decision.
5. Dispatching Data Mining Analysis System
5.1. Dispatching Data Mining Analysis Methods
Data Mining (Data Mining) is to extract the implicit in the work, people do not know in advance, but is poten-tially useful information and knowledge from a large number of, incomplete, noisy, fuzzy, random data. 1) Day analysis: The aim is to find grid operation
con-trol problems and deviations of yesterday, and find out the reasons, and to remedy the problems in the next day's operation, to continuously improve the level of opera-tional control.
The methods and procedures of data mining for the data of grid dispatching are as follows:
1) Statistical analysis of indicators 2) Monthly analysis: Mainly through the analysis of
the type of operation plan, statistical analysis class indi-cators to verify the adaptability of operating mode on the month, in-depth study of the problems and deviations, and improve it in the second month operation mode ar-rangements, at the same time, to make recommendations and comments for other departments and continuously improve the scheduling refinement level.
It can create various indicators to analyze according to the needs of data analysis, including:
a) Indicators statistics: Aggregate value, maximum / minimum / average, expectations, variance, standard de-viation.
determine early warning threshold on the basis of statis-tical indicators.
2) Multivariate correlation analysis
For any amount of view two or more groups, you can associate the following methods analyzed in order to study the association and mutual influence:
a) Qualitative analysis: You can observe the changes of the curve and relevance by the use of data visualiza-tion technology, the multiple dimensions of data accord-ing to different categories, in 2D or 3D graphics on dis-play, rotation, and perspective.
b) Quantitative analysis: Relevant statistics, analysis and factors affecting the amount of view between the correlation coefficient, covariance.
3) Other analytical methods
Data mining itself reflects a thinking that with the ap-propriate mathematical methods to explore the law from the data. Data mining does not require one or a few me-thods to analyze data. In contrast, data mining method broadly define to include all kinds of statistics, signal processing, information science, computer graphics, arti-ficial intelligence and other areas of different methods, depending on the data content, you can use different me-thods.
Commonly used methods include: cluster analysis, classification, prediction, regression, power system sis the evolution, correlation analysis, correlation analy-sis and other methods.
5.2. The Practical Application of Dispatching Data Mining
Power dispatching data mining can be applied to the following practical issues.
1) The analysis of the reasonableness of the electric power grid power system.
Analysis methods: analysis of local power generation planning and load correlation, analyze tie-line planning and load correlation.
2) Analysis of electricity contract in real-time
Analytical purposes: to ensure the fairness of the pow-er plant contract implementation and scheduling.
Analysis methods: monitoring all electricity plants contract in real-time completion, monitoring all power plants project plan and the actual deviation; by Dispatch-ers three shifts and each team for the electricity
comple-tion of sequencing analysis.
3) Analysis of various factors in CPS
Purpose of analysis: analyze various factors on the impact of CPS indicators, to improve scheduling policy.
Analysis methods: To list CPS-related factors, to stat the correlation between the factors and CPS indicators by the time dimension, to sort the factors relation, and to give scheduling control recommendations to improve CPS.
6. Conclusions
Dispatching operational analysis and data mining system described in this paper is the implementation and en-forcement to the schedule of dispatching operational analysis. The calculation and analysis of the dispatching indicators gives the power grid dispatchers a more com-prehensive, clear, quantitative understanding. The data mining of the historic data can facilitate the understand-ing of some complex related issues in the dispatchunderstand-ing operation. The author hopes that this research practice could make contributions to the work of dispatching op-erational analysis.
REFERENCES
[1] J. Q. Zhao, S. Yan, X. Xiao and Y. Z. Zhou, “Design and Implementation of Double-core Redundant Power Grid Dispatch Automation System,” Automation of Electric Power Systems, Vol. 33, No. 21, 2009, pp. 101-103.
[2] S. M. Wang, S. N. Wu, D. L. Zhou and W. C. Wu, “Re-search on Dispatch Training Base Construction Scheme for Jiangxi Power Grid,” Electric Power, Vol. 42, No. 4, 2009, pp. 70-74.
[3] “ISO Market Monitoring & Information Protocol,” Cali-fornia Independent System Operator Corporation FERC Electric Tariff First Replacement, Vol. 2, No. 497.
[4] H. L. Jin and H. Liu, “Research on visualization tech-niques in data mining,” Proceedings of the 2009 Interna-tional Conference on ComputaInterna-tional Intelligence and Software Engineering, 2009, p. 3.
[5] A. Koretsune, S. Aoki, T. Konzo, H. Tsuji, S. Shimano and E. Mimura, “DEA-based data mining for energy consumption,” 10th IEEE International Conference on Emerging Technologies and Factory Automation, Vol. 1, 2005, p. 4.