This paper is based on the poster presentation at the German-Thai Symposium on Nanoscience and Nanotechnology 2011—Green Nanotechnology of the
Article
Highly Efficient Visible-Light-Induced Photocatalytic
Activity of Fe-doped TiO
2Nanoparticles
Paruchai Pongwan
1, Burapat Inceesungvorn
2, Khatcharin Wetchakun
3,
Sukon Phanichphant
4, and Natda Wetchakun
1,*
1 Department of Physics and Materials Science, Faculty of Science, Chiang Mai University, Chiang Mai 50200, Thailand
2 Department of Chemistry, Faculty of Science, Chiang Mai University, Chiang Mai 50200, Thailand 3 Nanoscience and Nanotechnology Program, Graduate School, Chiang Mai University, Chiang Mai 50200, Thailand
4 Materials Science Research Center, Faculty of Science, Chiang Mai University, Chiang Mai 50200, Thailand
E-mail: [email protected]*
Abstract.
Bare TiO2 and nominal 5.0 at% Fe-doped TiO2 nanoparticles were synthesizedby the modified sol-gel method. The samples were physically characterized in order to obtain the correlation between structure and photocatalytic properties by X-ray diffraction (XRD), scanning electron microscopy (SEM), transmission electron microscopy (TEM), Brunauer, Emmett and Teller (BET), and UV-vis diffuse reflectance spectrophotometry (UV-vis DRS). XRD results indicated that phase structures of bare TiO2 and Fe-doped
TiO2 nanoparticles were the mixture of anatase and rutile phases. The content of rutile
phase in 5.0 at% Fe-doped TiO2 nanoparticles decreased. TEM images revealed that the
shape of bare and 5.0 at% Fe-doped TiO2 was almost spherical and the average particle
size was in the range of 10–30 nm. Specific surface areas of the samples were found as 75 and 134 m2/g for bare TiO2 and nominal 5.0 at% Fe-doped TiO2, respectively. The results
from UV-vis reflectance spectra clearly indicated the shift of absorption band edge towards visible region upon doping TiO2 with iron. Photocatalytic activity of bare TiO2
and 5.0 at% Fe-doped TiO2 nanoparticles was examined by studying the mineralization of
oxalic acid under visible light irradiation and the results clearly showed that Fe-doped TiO2
sample exhibited higher activity than bare TiO2.
Keywords: Nanoparticles, Fe-doped TiO2, photocatalytic activity,modified sol-gel, visible
light.
ENGINEERING JOURNAL Volume 16 Issue 3 Received 19 November 2011
Accepted 15 February 2012 Published 1 July 2012
1.
Introduction
Recently, the rapid growth of industries leads to the expansion of environmental problems. One of the main environmental problems is water pollution from industries, agricultures, houses, and so on, which have contaminants such as organic and inorganic compounds. Recently, the new approach for wastewater treatment is an application of photocatalyst through advanced oxidation process. Titanium dioxide (TiO2) is
one of the most efficient photocatalyst due to its high stability, chemical inertness, non-toxicity, and low cost [1–2]. Generally, TiO2 has band gap energy of 3.2 eV for the anatase phase and 3.0 eV for the rutile
phase of which the absorption thresholds correspond to 380 and 410 nm, respectively [3]. The photocatalytic process requires the energy of light equal or greater than the band gap energy of TiO2 for
production of electron and hole. The generated electron and hole can then react with water molecules and hydroxyl ions, which subsequently produce hydroxyl radical known as a strong oxidant for organic pollutant degradation in water. Apart from the oxidation process, the hole and electron can recombine easily, thus resulting in very low photocatalytic efficiency [4]. Therefore, many attempts have been made to retard this electron-hole recombination such as modification of TiO2 surface by doping with various
cationic and anionic elements [5–7]. Surface modification using appropriate element dopant could reduce the recombination rate of electron-hole pairs and increase the photocatalytic efficiency of TiO2. Recently,
many TiO2 modification procedures have successfully shifted the photocatalytic activity of TiO2 from the
UV region to visible light region; therefore enhanced photocatalytic activity could be obtained as a consequence of more complete utilization of solar energy [8]. Narrowing of TiO2 band gap can be acquired
by substitutionally or interstially doped with various transition metal ions [9]. Doping of the transition metal ions such as Fe, Cu, and V, and so on was reported to induce a red shift of TiO2 absorption spectrum and
the enhancement of photocatalytic activity was also observed. Instead of using an expensive noble metal dopant, visible light photoactivity of TiO2 has also been found in the TiO2 doped with cheaper transition
metal ions such as Fe and Cu. Although, doping of transition metal ion could increase photocatalytic efficiency of TiO2 and the activity of this material also depends on various parameters related to the
preparation method and the physical properties of the obtained catalyst. Several synthesis methods of TiO2
have been proposed in literatures including sol-gel [9], flame spray pyrolysis [10], precipitation [11],and hydrothermal method [12]. A well-known method for preparing metal ion doping of TiO2 is based on the
sol-gel method via hydrolysis mechanism. This method offers several advantages, including high homogeneity and high chemical purity. Hence, the sol–gel method is widely used to prepare nano-sized TiO2 photocatalysts [13–15]. Furthermore, the sol-gel method has successfully been employed for
preparation of transition metal-doped TiO2 photocatalyst and the enhanced photocatalytic activity under
visible light irradiation was previously been observed [16–18].
In this research, the modified sol-gel method was employed for synthesis of Fe-doped TiO2
nanoparticles. Photocatalytic degradation activities of the synthesized particles were studied using oxalic acid as the model organic compound under visible light irradiation.
2.
Experimental
2.1. Sample Preparation
Bare and Fe-doped TiO2 were synthesized by using titanium tetraisopropoxide (TTIP) as the Ti-precursor.
Iron (III) nitrate (Fe(NO3)3·9H2O) was used as the metal precursor. 20 ml titanium tetraisopropoxide was
2.2. Sample Characterization
Crystal structure and crystallite size of the samples were determined by X-ray diffraction spectroscopy (XRD, Philips X’ Pert MPD) with CuKα radiation and calculated by using Scherrer equation. Rietveld
refinement was carried out to determine the phase composition of the prepared samples. Morphology and particle size were investigated by transmission electron microscopy (TEM, JEOL JEM-2010) and scanning electron microscopy (SEM, JEOL JEM-6335F). Elemental composition of the obtained catalyst was analyzed by energy dispersive X-ray spectroscopy with SEM instrument (SEM-EDS). The Brunauer Emmett and Teller (BET) adsorption-desorption of nitrogen gas for specific surface area determination at the temperature of liquid nitrogen was performed on autosorb-1MP-Quantachrome. UV-vis absorption spectra and band gap energy were studied by UV-vis diffuse reflectance spectrophotometry (Lambda 650S).
2.3. Photocatalytic Activity Studies
The suspension of bare TiO2 and Fe-doped TiO2 nanoparticles (1 g/L) were prepared in deionized water
and the pH was adjusted to 3.0 using 0.2 M of perchloric acid. An impurity carbon burn-off step was firstly carried out by illuminating the photocatalyst suspension with a UVA lamp (Sylvania blacklight blue, 18W) at ambient condition until no further CO2 generation was obtained. The suspension was then
air-equilibrated before an injection of oxalic acid (500 μg of carbon). Prior to the illumination, the catalyst suspension containing oxalic acid equivalent to 500 microgram carbon was circulated through the photoreactor under the dark for 30 min to establish adsorption/desorption equilibrium. Photocatalytic reaction was then initiated by illuminating the suspension with a fluorescent lamp (Sylvania fluorescent lamp, 18 W) filtered with a Rosco® E-colour UV filter. The amount of carbon dioxide generated by the
mineralization of oxalic acid was determined via conductivity measurement. The photocatalytic performance of the synthesized samples was analyzed through the rate of oxalic acid photominerization.
3.
Results and discussion
3.1. UV-vis Diffuse Reflectance Spectra and Band Gap Energy
The absorption spectra were obtained by analyzing the reflectance measurement with Kubelka-Munk emission function, given by the equation below:
F(R∞) = [1-( R∞)]2/2R∞
(1)
where F(R)is proportional to the absorption constant of the material, an indicative of the absorbance of
the sample at particular wavelength. Band gap of the sample was obtained from a plot between:
Eg = 1241/λonset and [F(R∞)hυ]1/2
(2)
where Eg is the band gap energy in eV, h is Planck’s constant, and υ is the frequency.
Figure 1 shows the UV-vis spectra of commercial TiO2 (Degussa P25), bare TiO2 and 5.0 at%
Fe-doped TiO2.The results clearly showed a shift of absorption band edge towards visible region upon doping
TiO2 with iron. This suggested that the excitation energy of nano-sized Fe-doped TiO2 decreases upon iron
doping as seen from the inset of Fig. 1. The absorption band edges of Degussa P25, bare TiO2 and nominal
5.0 at% Fe-doped TiO2 were found in the range of 380–450 nm, corresponding to the band gap energy of
Fig. 1.
Kubelka-Munk absorbance spectra of Degussa P25, bare TiO2 and nominal 5.0 at% Fe-dopedTiO2. The inset shows band gap energies of all samples.
3.2. XRD and BET Analysis
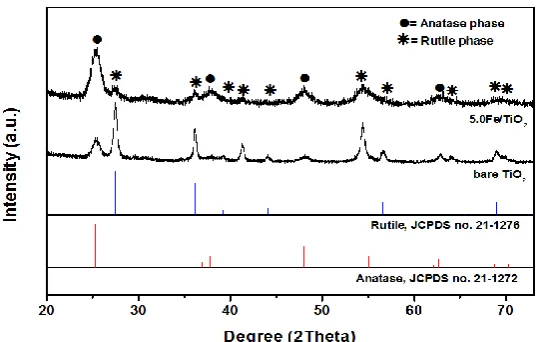
XRD patterns of bare TiO2 and nominal 5.0 at% Fe-doped TiO2 nanoparticles are shown in Fig. 2. Both
samples presented in the mixed crystalline phases between anatase and rutile. The existence of both anatase and rutile phases in bare TiO2 and Fe-doped TiO2 nanoparticles can be identified by JCPDS file no. 21–
1272 and no. 21–1276, respectively. An increase of anatase phase content was observed in Fe-doped TiO2
sample. It was previously reported that excessive Fe doping disturbs the arrangement of TiO2 octahedral
units in rutile structure and hence distorts the overall crystallite structure [19]. The XRD peak of Fe dopant was not detected possibly because iron was doped in the range of very low concentration [20].
Fig. 2
.
X-ray diffraction patterns of bare TiO2 and nominal 5.0 at% Fe-doped TiO2 nanoparticles.Phase composition, crystallite size, and BET specific surface area of bare TiO2 and nominal 5.0 at%
Fe-doped TiO2 are presented in Table 1. It was found that the percentage of rutile phase in Fe-doped TiO2
decreases upon iron doping. An average crystallite size of the samples has been calculated by Scherrer equation as illustrated below:
0.9
cos
( , )
D
anatase rutile
(3)
[image:4.595.162.431.449.620.2]bare TiO2 and Fe-doped TiO2 samples was in the range of 8–9 nm for anatase phase and 17–20 nm for
rutile phase. No iron-containing phase could be resolved in these patterns, which suggested insignificant iron segregation in Fe-doped TiO2 nanoparticles. Peak position of (101) plane of anatase phase was shifted
upon doping TiO2 with iron, indicating the distortion of TiO2 crystal lattice by iron dopant. TiO2 lattice
distortion was previously ascribed to the substitution of titanium ion with iron ion because the ionic radius of Fe3+ (0.64 Å) was slightly smaller than that of Ti4+ (0.68 Å) [21]. The substitution of Fe3+ for Ti4+ site in
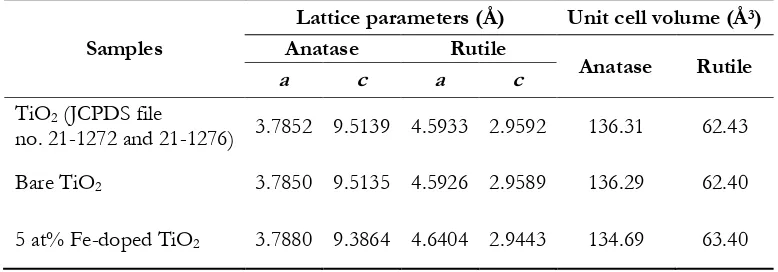
TiO2 lattice is evidenced by the change in unit cell volume as reported in Table 2. According to Table 2,
lattice parameters calculated from the (101) and (200) for anatase and (110) and (101) for rutile match very well with those of TiO2 in JCPDS file no. 21–1272 and 21–1276 for anatase and rutile, respectively. A
change in the unit cell volume of 5 at% Fe-doped TiO2 compared with that of bare TiO2 indicates that Fe3+
replaces Ti4+ in the TiO2 lattice, and forms solid solution [22, 23]. BET specific surface area of bare TiO2
and nominal 5.0 at% Fe-doped TiO2 was 75 and 134 m2/g, respectively. The BET results showed that
doping of TiO2 with Fe results in an increase of specific surface area. Therefore, it is possible that the
changes in particle size and specific surface area of Fe-doped TiO2 nanoparticles are due to Fe3+
[image:5.595.76.523.328.431.2]substituted for Ti4+ in TiO2 lattice.
Table 1. Crystallite size, phase composition, and specific surface area of bare TiO2 and nominal 5.0 at%
Fe-doped TiO2 nanoparticles.
Samples
Crystallite size (nm) composition Phase
(wt%) surface area Specific (m2/g)
Anatase
in (101) plane in (110) plane Rutile Anatase Rutile
Bare TiO2 9.0 17.9 33.40 66.60 75
5.0 at.% Fe-doped TiO2 8.1 20.1 89.99 10.01 134
Table 2. Unit cell parameters and unit cell volumes of bare TiO2 and nominal 5.0 at% Fe-doped TiO2
nanoparticles in comparison with the JCPDS file standard data of TiO2.
Samples
Lattice parameters (Å) Unit cell volume (Å3)
Anatase Rutile
Anatase Rutile
a c a c
TiO2 (JCPDS file
no. 21-1272 and 21-1276) 3.7852 9.5139 4.5933 2.9592 136.31 62.43
Bare TiO2 3.7850 9.5135 4.5926 2.9589 136.29 62.40
5 at% Fe-doped TiO2 3.7880 9.3864 4.6404 2.9443 134.69 63.40
3.3. Morphology Characterization
The SEM images showed the particle size and morphology in a rough scale measurement. The morphology of bare TiO2 and was found in an almost spherical particles with diameters ranging from 10‒30 nm as
[image:5.595.103.492.494.630.2]Fig. 3. SEM images of (a) bare TiO2, (b) 5.0 at% Fe-doped TiO2 and (c) EDS spectra of 5.0 at%
Fe-doped TiO2.
Fig. 4. TEM and SAED images of (a) pure TiO2, (b) 5.0 at% Fe-doped TiO2, and (c) lattice fringe image
of 5.0 at% Fe-doped TiO2.
Although SEM images gave a rough estimation of particle sizes, TEM images can reveal internal structure and a more accurate measurement of particle size and morphology. The TEM images and selected area electron diffraction (SAED) pattern of bare TiO2 and 5.0 at% Fe-doped TiO2 are shown in Fig. 4(a)
and (b), respectively. The TEM images of both bare TiO2 and Fe-doped TiO2 revealed an almost spherical
shape with average particle size in the range of 10‒30 nm. SAED pattern confirmed the mixed-phase structure according to the set of concentric rings which have been indexed as various planes of anatase and rutile structures. Fig. 4(c) shows lattice fringes of 5.0 at% Fe-doped TiO2 sample. The distance between
each lattice fringes were measured and identified as the crystal structure of TiO2 because the d-spacing of
TiO2 lattice plane from JCPDS file matches very well with the width of lattice fringe from TEM images.
Consequently, the fringe widths of 0.24 nm and 0.19 nm can be used to confirm the dominance of (103) and (200) planes of anatase structure. On the contrary, the fringe width of 0.25 nm confirmed the dominance of (101) plane of rutile structure.
(b)
(c)
(a)
(b)
(c)
[image:6.595.69.527.415.528.2]3.4. Photocatalytic Activity of Oxalic Acid Mineralization
Photoactivity of the prepared samples was evaluated by the photocatalytic oxidation reaction of oxalic acid under visible light irradiation as shown in Fig. 5.
As a comparison, the photolysis of oxalic acid was
also carried out at the same condition but without any catalyst.. It was found that only
ca.
5.62%
oxalic acid is degraded under the same irradiation time.
It is clearly seen that Fe-doped TiO2 displayedmuch higher photoactivity than bare TiO2 under visible light illumination. The photocatalytic
mineralization efficiency was increased to 77 % with the use of 5.0 at% Fe-doped TiO2. This is possibly
due to the visible-light absorption ability of Fe-doped TiO2 as evidenced by UV-vis diffuse reflectance
spectra. An increased photocatalytic activity obtained in the case of Fe-doped sample has also been ascribed to Fe particles acting as an electron trap, retarding the electron-hole recombination process, and thereby, promoting the photocatalytic activity [24].
Fig. 5. Mineralization of oxalic acid under visible light illumination with an irradiation time of 180 min over P25, bare TiO2 and 5.0 at% Fe-doped TiO2 compared with oxalic acid photolysis.
It has been clearly established that the photocatalyzed mineralization of organic compound in solution is initiated by photo-excitation of the metal oxide semiconductor, followed by the generation of an electron–hole pair on the surface of catalyst (Eq. (4)). Direct oxidation of oxalic acid (Eq. (5)) can also occur due to high oxidative potential of the generated hole (h+VB) in the catalyst. Very reactive hydroxyl radicals can also be formed either by the decomposition of water (Eq. (6)) or by the reaction of hole with OH− (Eq. (7)). The hydroxyl radical known as an extremely strong, non-selective oxidant can lead to the
partial or complete mineralization of several organic chemicals.
TiO2 + hν → TiO2 (e−CB + h+VB) (4)
h+VB + organic → organic•+ → oxidation of the organic (5)
h+VB + H2O → H+ + OH• (6)
h+VB + OHˉ → OH• (7)
Electron in the conduction band (e−CB) on the catalyst surface can reduce molecular oxygen to superoxide anion (Eq. (8)). This radical, in the presence of organic scavenger, may form organic peroxide (Eq. (9)) or hydrogen peroxide (Eq. (10)).
e−CB + O2 → O2˙•− (8)
O2•− + organic → organic − OO• (9)
[image:7.595.183.414.245.428.2]Electrons in the conduction band are also responsible for the production of hydroxyl radicals, species which have been indicated as the primary cause of organic compound degradation (Eq. (11)).
OH• + organic compound→ degradation of organic compound (11)
4.
Conclusions
Nominal 5.0 at% Fe-doped TiO2 nanoparticles have been successfully synthesized by the modified sol-gel
method. The XRD patterns showed the presence of mixed anatase and rutile phases of TiO2 structure. The
particle size and morphology investigated by TEM images revealed an almost spherical shape with particle size in the range of 10‒30 nm. Photocatalytic activities of bare TiO2 and Fe-doped TiO2 samples were
investigated by visible light-induced mineralization of oxalic acid in aqueous solution. The results clearly showed that doping of Fe could greatly enhance the photocatalytic activity of TiO2 nanoparticles for oxalic
acid mineralization. This enhanced photocatalytic activity is possibly due to the visible-light absorption ability of Fe-doped TiO2 as observed from UV-vis spectra. In addition, an increase of specific surface area,
a shift of absorption band edge toward visible region, and a decrease of TiO2 band gap energy observed in
our BET and UV-vis study could be the possible reasons explaining for an increased photocatalytic efficiency of the as-synthesized Fe-doped TiO2 sample.
Acknowledgements
The authors would like to acknowledge the financial support from the Research, Development and Engineering (RD&E) fund through The National Nanotechnology Center (NANOTEC), The National Science and Technology Development Agency (NSTDA), Thailand (P-11-00202) to Chiang Mai University, the National Nanotechnology Center (NANOTEC), Ministry of Science and Technology through its program of Center of Excellence Network, Chiang Mai University, Thailand, the National Research University Project under Thailand's Office of the Higher Education Commission, Materials Science Research Center, Department of Chemistry and Department of Physics and Materials Science, Faculty of Science, the Graduate School, Chiang Mai University.
References
[1] C. Kim, M. Choi, and J. Jang, “Nitrogen-doped SiO2/TiO2 core/shell nanoparticles as highly efficient
visible light photocatalyst,” Catal. Commun., vol. 11, pp. 378‒382, Jan. 2010.
[2] D. G. Huang, S. J. Liao, J. M. Liu, Z. Dang, and L. Petrik, “Preparation of visible-light responsive N-F-codoped TiO2 photocatalyst by a sol-gel-solvothermal method,” J. Photochem. Photobiol. A: Chem., vol.
184, pp. 282‒288, Dec. 2006.
[3] T. J. Whang, H. Y. Huang, M. T. Hsieh, and J. J. Chen, “Laser-induced silver nanoparticles on titanium oxide for photocatalytic degradation of methylene blue,” Int. J. Mol. Sci., vol. 10, pp. 4707‒4718. Oct. 2009.
[4] H. Li, X. Duan, G. Liu, and X. Liu, “Photochemical synthesis and characterization of Ag/TiO2
nanotube composites,” J. Mater. Sci., vol. 43, pp. 1669‒1676, Jan. 2008.
[5] S. Lei and W. Duan, “Highly active mixed-phase TiO2 photocatalysts fabricated at low temperature
and the correlation between phase composition and photocatalytic activity,” J. Environ. Sci. China, vol. 20, pp. 1263‒1267, Jan. 2008.
[6] Y. Zhanga, H. Ganb, and G. Zhang, “A novel mixed-phase TiO2/kaolinite composites and their
photocatalytic activity for degradation of organic contaminants,” Biochem. Eng. J., vol. 72, pp. 936‒943, July 2011.
[7] X. Yang, F. Ma, K. Li, Y. Guo, J. Hu, W. Li, M. Huo, and Y. Guo, “Mixed phase titania nanocomposite codoped with metallic silver and vanadium oxide: new efficient photocatalyst for dye degrada,” J. Hazard. Mater., vol. 175, pp. 429‒438, Oct. 2009.
[8] F. Chen, W. Zou, W. Qu, and J. Zhang, “Photocatalytic performance of a visible light TiO2
[9] D. Wang, L. Xiao, Q. Luo, X. Li, J. An, and Y. Duan, “Highly efficient visible light TiO2 photocatalyst
prepared by sol-gel method at temperatures lower than 300°C,” J. Hazard. Mater., vol. 192, pp.
150‒159, May 2011.
[10] G. L. Chiarello, E. Selli, and L. Forni, “Photocatalytic hydrogen production over flame spray pyrolysis-synthesised TiO2 and Au/TiO2,” Appl. Catal. B. Environ., vol. 84, pp. 332‒339, Apr. 2008.
[11] L. Li, H. Zhuanga, and D. Bua. “Characterization and activity of visible-light-driven TiO2
photocatalyst codoped with lanthanum and iodine,” Appl. Surf. Sci., vol. 257, pp. 9221‒9225, June 2011.
[12] Z. Li, W. Shen W. Hea, and X. Zu. “Effect of Fe-doped TiO2 nanoparticle derived from modified
hydrothermal process on the photocatalytic degradation performance on methylene blue,” J. Hazard. Mater., vol. 155 , pp. 590‒594, Jan. 2008.
[13] H. Yang, K. Zhang, R. Shi, X. Li, X. Dong, and Y. Yu, “Sol-gel synthesis of TiO2 nanoparticles and
photocatalytic degradation of methyl orange in aqueous TiO2 suspensions,” J. Alloy. Compd., vol. 413,
pp. 302‒306, Aug. 2005.
[14] L. C. K. Liau, H. Chang, T. C. K. Yang, and C. L. Huang, “Effect of poly (ethylene glycol) additives on the photocatalytic activity of TiO2 films prepared by sol-gel processing and low temperature
treatments,” J. Chin. Inst. Chem. Eng., vol. 39, pp. 237‒242, Dec. 2007.
[15] Y. Xu, B. Lei, L. Guo, W. Zhou, and Y. Liu, “Preparation, characterization and photocatalytic activity of manganese doped TiO2 immobilized on silica gel,” J. Hazard. Mater., vol. 160, pp. 78‒82, Mar. 2008.
[16] T. Kamegawa, J. Sonoda, K. Sugimura, K. Mori, and H. Yamashita, “Degradation of isobutanol diluted in water over visible light sensitive vanadium doped TiO2 photocatalyst,” J. Alloy. Compd., vol.
486, pp. 685‒688, July 2009.
[17] S. Tieng, A. Kanaev, and K. Chhor, “New homogeneously doped Fe(III)-TiO2 photocatalyst for
gaseous pollutant degradation” Appl. Catal. A. Gen., vol. 399, pp. 191‒197, Apr. 2011.
[18] G. Colón, M. Maicu, M. C. Hidalgo, and J. A. Navío, “Cu-doped TiO2 systems with improved
photocatalytic activity,” Appl. Catal. B. Environ., vol. 67, pp. 41‒51, May 2006.
[19] W. Y. Teoh, R. Amal, L. Mädler, and S. E. Pratsinis, “Flame sprayed visible light-active Fe-TiO2 for
photomineralisation of oxalic acid”, Catal. Today, vol.120, pp. 203‒213, Feb. 2007.
[20] K. Naeem and F. Ouyang, “Preparation of Fe3+-doped TiO2 nanoparticles and its photocatalytic
activity under UV light,” Physica B., vol. 405, pp. 221‒226, Jan., 2010.
[21] J. Zhu, F. Chen, J. Zhang, H. Chen, and M. Anpo, “Fe3+-TiO2 photocatalysts prepared by combining
sol-gel method with hydrothermal treatment and their characterization”, J. Photochem. Photobiol. A., vol. 180,pp. 196‒204, May 2006.
[22] L. Yue and X.-M. Zhang, “Structural characterization and photocatalytic behaviors of doped CeO2
nanoparticles,” J. Alloy. Compd., vol. 475, pp. 702–705, Sept. 2009.
[23] K. T. Ranjit and B. Viswanathan, “Synthesis, characterization and photocatalytic properties of iron-doped TiO2 catalysts”, J. Photochem. Photobiol. A: Chem., vol. 108, pp. 79–84, 1997.
[24] J. C. Colmenares, M. A. Aramendia, A. Marinas, J. M. Marinas, and F. J. Urbano, “Synthesis, characterization and photocatalytic activity of different metal-doped titania systems”, Appl. Catal. A.,