Resource Demand Prediction and Carbon Emission
Estimation for Data Centers
San Hlaing Myint
*, Thandar Thein
University of Computer Studies, Yangon *Corresponding Author: [email protected]
Copyright © 2014 Horizon Research Publishing All rights reserved.
Abstract
The energy consumption of data centers has become a key issue in today’s ICT sector and a significant factor of green environment. A substantial reduction in energy consumption can be made by powering down servers when they are not in use. In cloud data center, it is very hard to manage and allocate their resource to incoming dynamic workload demands. Predicting the required resource demand, it can save the data center’s resource wasting and achieve max-profit and min-risk. Without proper prediction, data center can have overprovision and underprovision, which can cause resource waste and significant financial penalties. So an efficient resource management scheme is needed to reduce energy consumption and carbon dioxide (CO2 )emission. The aim of the present study is to develop model for predicting the future resource demand and estimation of CO2 emission by comparatively assessing the suitability of
several machine learning techniques. In order to reduce processing overheads, feature selection is conducted in prediction model. To estimate the CO2 emission, Power
model and Carbon model are also developed. Experiment is conducted on real world workload traces and results show that prediction model can predict future resource demand with acceptable accuracy.
Keywords
CO2 Emission, Data Centers, EnergyConsumption, Machine Leaning, Resource Demand Prediction
1. Introduction
Due to the increasing demands of energy from ICT sector, data center carbon footprints expand and energy consumption rises. The Smart 2020 analysis forecast that the global carbon footprint of the main components of cloud-based computing data centres and the telecommunications network would see their emissions grow, on average, 7%and 5%respectively each year between 2002-2020. Underlying this analysis is the number of data centre servers growing on average 9% each year during this period [6].
Data centers are critical issue in today’s ICT sector because they have experienced an unprecedented growth in their size and population, recently. The Internet giants like Google, IBM and Microsoft house large data centers for cloud computing and application hosting. Many studies, on energy consumption of data centers, point out to the need to evolve strategies for energy efficiency [5]. Due to large-scale CO2 emissions, in the process of electricity production, the
ICT facilities are indirectly responsible for considerable. This concern brings new approach to measure and management CO2 emission of data centers.
The most important aspect in the need to go for “green energy” is to minimize the emission of green house gases (GHG) by ICT sector.GHG are the major contributors to the global warming. Dynamic workload changes and their resource demand in a data center creates the challenge of on-demand resource provisioning and allocation to time varying workloads. Normally, data center resources are statically allocated to applications, based on peak load characteristics, in order to maintain isolation and provide performance guarantees. Until now, performance guarantee has been the main concern in data center deployments and this demand has been fulfilled with paying much attention to energy consumption and CO2 emission.
Resources management is an effective approach to maximize resource utilization while minimizing power consumption in cloud data center environment. According to the variability of workload, energy efficient techniques can lead to SLA violation. Therefore, intelligent workload prediction strategy is needed to ensure that SLA violation is maintain at a certain level while reducing energy consumption of data center. In order to calculate the power consumption for given workload, power model is developed. According to power consumption of given workload, carbon model is developed for estimating CO2 emission.
powerful machine learning techniques is evaluated on three workload traces. According to predicted CPU resource usage, the power consumption and CO2 emission of future
workload demands are estimated.
2. Related Work
In order to obtain an energy-efficient data center, J. L. Berral et al. [4] proposed an intelligent consolidation methodology using different techniques such as turning on/off machines, power-aware consolidation algorithms, and machine learning techniques to deal with uncertain information while maximizing performance. To predict power consumption levels, CPU loads, and SLA timings, machine learning approach is applied and scheduling decisions are also provided. Because it considers from watt consumption to workload features, and cross-disciplinary, as it uses a wide variety of techniques. In [2], authors introduced a novel framework combining load demand prediction and stochastic state transition models for optimal cloud resource allocation by minimizing energy consumed while maintaining required performance levels. The ability of neural network and auto-regressive linear prediction algorithms are used to forecast loads in cloud data center applications. In [7], A Green Scheduler is designed, implemented and evaluated for reducing power consumption of data centers in Cloud computing environments by shutting down unused servers.
In [1, 3], a reinforcement learning approach is applied to provide online management of both performance and power consumption, and machine learning is used to reduce power consumption in clusters. These approaches provide appropriate policies to a given system. Such policies save more than 10% on server power while keeping performance close to a desired target.
The most previous work focuses on reducing energy consumption in data centers and assumed that energy is increasing with CPU consumption. In this paper, we develop CO2 model based on this assumption. Intelligent resource
demand prediction is built by using machine learning techniques. And then we estimate the power consumption and CO2 emission according to resource prediction result.
3. Critical Issues behind the Data Center
3.1. Data Center Energy Consumption
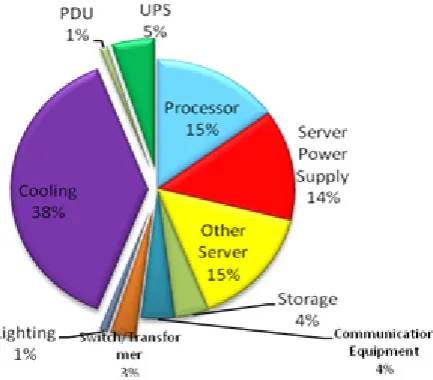
The growing amount of energy consumed by a data center for powering equipment along with heating and cooling has led to higher operating costs and dwindling energy supplies. According to Emerson Network Power Model [9] as shown in Figure 1, data center energy consumption area is divided into two sites such as supply site and demand site. Supply site constitute of the Uninterruptible Power Supply (UPS), Power Distribution Unit (PDU), cooling systems, lighting,
[image:2.595.329.546.194.384.2]and building switchgear. Supply site provide the demand site. Demand site consist of processors, server power supply, storage equipment, communication equipment, and other server components. Demand site directly provided to the users. 52% of total energy consumption is accounted for demand-side systems and 48 percent of energy consumption is accounted for supply site. In this system, we focus on demand site components and especially CPU power consumption which consume 15 % of total energy.
Figure 1. Energy Consumption of Data Center
3.2. Data Center Carbon Dioxide Emission
The fortunate truth is that the same efforts to reduce energy consumption and CO2 will result in lower cost of
operations. Organization can benefit immensely by lowering their energy use and greenhouse gas emissions through strategic investment in data center energy efficiency, renewable energy, and carbon offsets. According to Greenpeace International Report 2011 [8], IT firm’s CO2
emission and energy footprint is shown in Figure 2.
Figure 2. CO2 Emission of Data Center
[image:2.595.349.511.543.716.2]scope. IT sector’s carbon footprint estimation was conducted as part of the 2008 SMART 2020 study [7], which established that the sector is responsible for 2% of global GHG emissions. Even more importantly, IT is increasingly being used to address the remaining 98% of the carbon emissions of the world economy. According to Figure 2, data center carbon footprint is very significant in IT sector.
4. Resource Demand Prediction and CO
2Emission Estimation
In this paper, we propose CO2 emission estimation
framework which is based on CPU usage prediction. Proposed framework is shown in Figure 3. We explored the effectiveness of machine learning techniques on energy consumption and CO2 emission. In this system, firstly we
perform CPU usage demand prediction of workload traces. After predicting CPU usage demand of given workload, power model is developed. Finally, CO2 model is developed
for CO2 estimation.
Machine Learning
Resource Prediction Model
Power Model
Carbon Model CPU
usage
Estimated power usage
Estimated Carbon Emission
Prediction Power & Carbon Estimation
[image:3.595.324.538.93.273.2]Workload Traces
Figure 3. CO2 Emission Estimation Framework
4.1. Resource Demand Prediction
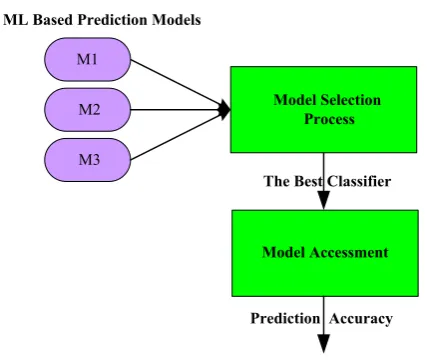
In this section, CPU resource usage prediction is conducted by using machine learning techniques. Machine Learning is the only way to solve the problem of understanding the complexity of the information. The processing steps are as follow; data standardization, feature selection, model generation and model evaluation process. Data standardization process consists in subtracting the value from its average value and divides the result by its standard deviation. Feature selection is a preprocessing step in machine learning and is effective in reducing dimensionality, removing irrelevant data, increasing learning accuracy, and improving result comprehensibility. It is prepared to develop a set of models and choose the best one according to different parameters selecting the more accurate result as well as having a prediction board where every model follows
[image:3.595.63.289.338.522.2]different strategies, as shown in Figure 4.
Figure 4. ML Based Prediction Model Evaluation Process
The two main goals of performing these processes are Model selection and Model Assessment.
Model Selection: Comparing different Machine Learning algorithms in order to choose the (approximately) best one.
Model Assessment: Having chosen a final algorithm, estimate its generalization error on new data.
Model validation process is performed to meet these two goals. The best algorithm found during this process is going to be used to predict the CPU utilization of future workloads that reflect on the area of capacity planning.
4.2. Carbon Dioxide Emission Estimation
A mathematical model is needed for energy efficiency based on various contributing factors such as energy cost, CO2 emission rate, HPC workload, and CPU power
efficiency. The first step we conducted to gain a solid understanding of data center energy consumption and resource demand of workloads. Energy consumption and CO2 emissions calculation mostly depend on CPU resource
consumption and CO2 emission is directly related to energy
consumption. This will result in lower cost of operations and great benefits in data center environment.
To model such data center power consumption and CO2
emission, we estimate first CPU consumption of given workload that can estimate the power consume as a function of workload resource utilization. CO2 emission of a server
is calculated base on estimated power consumption. To facilitate energy efficient computing, the information about the CO2 emission rate is needed to provide. The CO2
emission rate is directly proportional with power consumption.
4.2.1. Power Model
The main part of power consumption of data center is demand site (computation site) and the power consumption of a physical machine can be estimated by a linear
The Best Classifier ML Based Prediction Models
M1 M2 M3
Model Selection Process
Model Accessment
relationship between power consumption and CPU utilization [11]. In this paper, we model server power consumption across different workload CPU resources utilization and reveal the relationship of power consumption and CPU utilization. This relationship is essential to design efficient strategies for energy saving. Therefore, power consumption of u % CPU utilization of given workload is calculated by using the following formula.
𝑃𝑃𝑈𝑈 = 𝑃𝑃𝑈𝑈𝑈𝑈+ (𝑃𝑃𝑈𝑈𝑈𝑈 − 𝑃𝑃𝑈𝑈𝑈𝑈) ∗100𝑈𝑈 (1) Where 𝑃𝑃𝑈𝑈is the power consumption of u% CPU utilization of given workload, 𝑃𝑃𝑈𝑈𝑈𝑈and 𝑃𝑃𝑈𝑈𝑈𝑈are power consumption of maximum CPU utilization and idle, respectively. We can calculate power consumption of a server at u% CPU utilization at period T;
𝑷𝑷𝒔𝒔𝒔𝒔𝒔𝒔= ∑𝑻𝑻𝒕𝒕=𝟏𝟏𝑃𝑃𝑈𝑈𝑈𝑈+ (𝑃𝑃𝑈𝑈𝑈𝑈− 𝑃𝑃𝑈𝑈𝑈𝑈) ∗100𝑈𝑈 (2) Where 𝑃𝑃𝑠𝑠𝑠𝑠𝑠𝑠 is the power consumption of a server at u% CPU utilization of given workload.
4.2.2. Carbon Model
The relationship between power consumption and CO2
emission is an important factor to account in consideration of sustainability in real data center. CO2 emission of u% CPU
utilization is calculated as follow;
𝐶𝐶𝐶𝐶2𝑃𝑃𝑈𝑈 = 𝛾𝛾𝐶𝐶𝐶𝐶2∗ 𝑃𝑃𝑈𝑈 (3) Where 𝛾𝛾𝐶𝐶𝐶𝐶2is CO2 emissionrate. CO2 emission of a server u% CPU utilization is formulated as follow:
𝐶𝐶𝐶𝐶2𝑃𝑃𝑠𝑠𝑠𝑠𝑠𝑠 = 𝛾𝛾𝐶𝐶𝐶𝐶2∗ 𝑃𝑃𝑠𝑠𝑠𝑠𝑠𝑠 (4) Where 𝐶𝐶𝐶𝐶2𝑃𝑃𝑠𝑠𝑠𝑠𝑠𝑠 is the CO2 emission of a server at u% CPU
utilization of given workload.
5. Experiment on Resource Demand
Prediction and CO
2Emission
5.1. Experiment Study
We conduct our experiment on three workload traces: Google, SHARCNET and OSC: two are obtained from Parallel Workload Archive and one from Google Cluster Workload. These workload traces are divided into 10 fold each fold include 10000 records. We used 10-fold cross validation, and averaged the results over 10 runs of each algorithm on these three datasets. Different classifiers are RandomTree, J48 and SimpleCart. After experiments are carried with three workload datasets, it can be concluded that RandomTree can handle the unexpected spikes of the pattern and get the highest score for three datasets. Therefore, we mention that RandomTree model provided accurate prediction result energy efficient techniques more intelligent. In this experiment, three real world workload traces are tested on Intel (R) Core (TM) i3 CPU @ 2.27 GHz, 2 GBRAM, HP machine. WEAK 3.6 toolkit is used to build prediction model and analysis the prediction accuracy.
Predictive models are implemented as Java program on Eclipse.
5.2. Experimental Results of Feature Selection
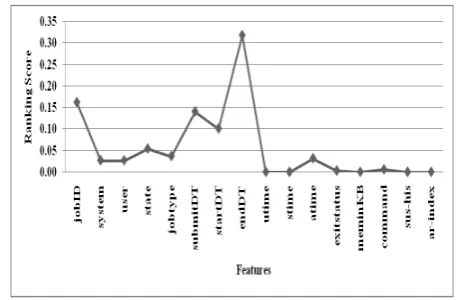
[image:4.595.315.550.200.352.2]In the experimental workload traces, some features are not influence on future CPU demand. So we calculate feature score by using Relief Attribute Evaluator to reduce unnecessary features. We presented the feature cores of different workload traces in the following figures.
Figure 5. Selected Features and Their Ranking Scores of Google Traces
Figure 6. Selected Features and Their Ranking Scores of SHARCNET Traces
In Figure 5, Time feature is the highest ranking score among features in Google dataset. Although NTMem scores have nearly Zero, we counted it due to small number of features in Google trace. We can conclude that Google is time dependent workload trace. In Figure 6, job ID, job type, Submitted time, start time and end time are the most significant features and influence on CPU usage of the SHARCNET trace.
[image:4.595.316.545.380.530.2]Figure 7. Selected Features and Their Ranking Scores of OSC Traces
Table 1. Selected Important Features of Two Workload Traces
Google SHARCENT OSC
Time Job ID JobNumber
ParentID Job type SubmitTime
TaskID Starttiem WaitTime
JobType Endedtime RunTime
NrmlTaskCores Ncpus AvgCPUTimeUsed
NrmlTaskMem Nnodes No of Processor
5.3. Experimental Results of Resource Demand Prediction Model
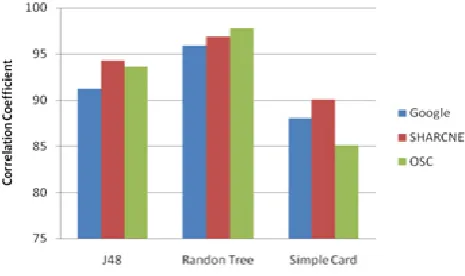
The main goal is to develop model for predicting the future resource demand and estimation of C02 emission by
comparatively assessing the suitability of several machine learning techniques. As shown in Figure 8 and Figure 9, RandomTree algorithm has least MAE error compared with other two algorithms over different workload traces. We found that RandomTree provides highest prediction accuracy compared with other algorithms over different workload traces. Prediction accuracy of RandomTree is 95% and above, and MAE is nearly zero over all workload traces. The actual and predicted CPU usages of RandomTree are shown in Figures 10, 11 and 12. According to the results, the actual and predicted values are nearly the same.
[image:5.595.316.552.244.372.2]Figure 8. Correlation Coefficient over Three Workload Traces
[image:5.595.58.298.258.383.2]Figure 9. Mean Absolute Error (MAE) over Three Workload Traces
Figure 10 . Predicted Vs Actual CPU Usage for 100 instances (Google)
Figure 11 . Predicted Vs Actual CPU Usage for 100 instances (SHARCNET)
[image:5.595.317.548.404.552.2] [image:5.595.319.547.587.733.2] [image:5.595.60.293.597.735.2]5.3. Experimental Results of Power Estimation
[image:6.595.317.549.71.571.2]The estimated power consumption of three workload traces are shown in the following Figures 13, 14 and 15. We found that power consumption is varying with CPU consumption.
Figure 13 . CPU Utilization and Power Consumption (Google)
Figure 14. CPU utilization and Power Consumption (OSC)
Figure 15. CPU Utilization and Power Consumption (SHARCNET)
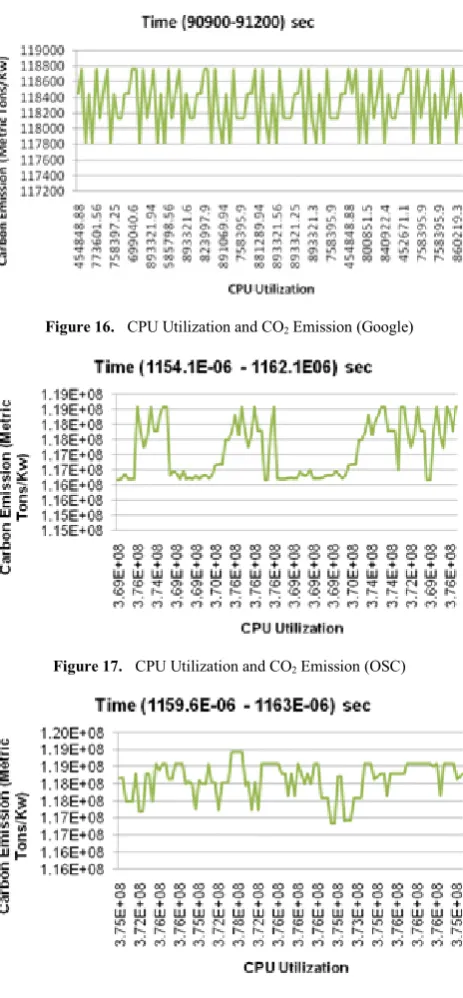
5.5. Experimental Results of CO2 Emission Estimation The estimated CO2 emission of three workload traces is
[image:6.595.312.553.81.215.2]shown in the following Figures 16, 17 and 18. We found that CO2 emission is varying with CPU consumption.
[image:6.595.61.289.164.303.2]Figure 16. CPU Utilization and CO2 Emission (Google)
Figure 17. CPU Utilization and CO2 Emission (OSC)
Figure 18. CPU Utilization and CO2 Emission (SHARCNET)
6. Conclusion
The emission of CO2 has become a major concern since
[image:6.595.62.295.336.494.2] [image:6.595.315.550.418.560.2] [image:6.595.61.292.526.668.2]The objective of the present study is to develop an efficient model for predicting the energy consumption and carbon dioxide emissions. We have practically evaluated performance of various classifiers on real workload traces and presented the prediction accuracy by MAE and correlation coefficient. According to the experimental results, the selected classifier, RandomTree, provides higher accuracy than other classifier. We presented the relationship between predicted CPU utilization and, power consumption and carbon dioxide emission. Predicted CPU usage is directly proportional to power consumption and carbon dioxide emission rate. As this research is ongoing research, we will implement proposed energy efficient resource allocation mechanism in sustainable data center architecture. We will present the effectiveness of selected classifier and estimated energy consumption and CO2 emission on
resource allocation process in near future.
REFERENCES
[1] G. Tesauro, R. Das, H. Chan, J. Kephart, D. Levine,F. Rawson, and C. Lefurgy, Managing power consumption and performance of computing systems using reinforcement learning, Advances in Neural Information Processing Systems, 20, 2007
[2] J. J. Prevost, K.Nagothu, B. Kelley, M. Jamshidi , Prediction of Cloud Data Center Networks Loads Using Stochastic and Neural Models, System of Systems Engineering (SoSE) 2011 6th International Conference, 276 – 281, 2011.
[3] J. Kephart, H. Chan, R. Das, D. Levine, G. Tesauro,F. Rawson, and C. Lefurgy, Coordinating multiple autonomic managers to achieve specied power-performance tradeoff in
Autonomic Computing, 2007.
[4] J. Ll. Berral, Í. G.R.Nou, F. Julià, J.Guitart, R. Gavaldà, J.Torres, Towards energy-aware scheduling in data centers using machine learning, e-Energy '10 Proceedings of the 1st International Conference on Energy-Efficient Computing and Networking, 215-224, ACM New York, NY, USA ©2010. [5] J.Shuja , S. A. Madani ,K. Bilal ,K. Hayat ,S, U. Khan,
S.Sarwar, Energy-efficient data centers,Springer,2012. [6] T.V. T. DUY, Nonmember, Y. SATO, Y. INOGUCHI , A
Prediction-Based Green Scheduler for Datacenters in Clouds, IEICE TRANS. 2010.ICAC'07, 24, 2007.
[7] The Climate Group, SMART 2020: A report by The Climate Group on behalf of the Global eSustainability Initiative (GeSI) ,Enabling the low carbon economy in the information age,2008
[8] Greenpeace International ,How dirty is your data?, Report, Aprial 2011.
[9] P. Costello and R. Rath , Data Center Energy Efficiency, Renewable Energy and Carbon Offset Investment Best Practices,Report, A guide to Green your Organizatiion’s Energy Consumption, January 2012.
[10] Navigant Expands Energy Research & Market Intelligence Offerings with Addition of Pike Research (Press Release), available from http://www.navigant.com
[11] P. Castelo, R. Rathi,Datacenter Energy Efficiency, Renewable Energy and Carbon Offset Investment Best Practices, 2012, available from
http://www.RealEnergyWriters.com
[12] Google Cluster Data, 2011, available from http://www.pdl.cmu.edu/PDL-FTP/CloudComputing/googlet race-socc2012.pdf