Users Satisfaction Regarding the Service Provided in
Community Pharmacies
Ana R. Pinto
1, Andreia Machado
1, Elisabete Gonçalves
1, Luís Salsas
1, Tiago Vicente
1,
Maria I. B. Ribeiro
2,Isabel C. J. F. Pinto
3,*1Health School, Polytechnic Institute of Bragança, Bragança, 5300-121, Portugal
2Researcher CETRAD, Collaborator of UDI, Polytechnic Institute of Bragança, Bragança, 5300-121, Portugal
3Coordinator of the Department of Diagnostic and Therapeutic Technologies, Polytechnic Institute of Bragança, Bragança,
5300-121, Portugal
*Corresponding Author: [email protected]
Copyright © 2014 Horizon Research Publishing All rights reserved.
Abstract
During the last century, the pharmacy professionals have significantly being professionalized, the user is a high priority and not just limited to the sale of pharmaceuticals. As such, it is necessary to know the users, their needs and expectations, their opinions and preferences. This transversal study, observational, correlational, aimed to: determine the degree of satisfaction with the attendance in community pharmacies, if there is a relationship between factors of a personal nature (age and gender) and satisfaction, trying to identify which aspects improve in order to increase satisfaction levels. The sample consisted of 525 respondents. Data collection was conducted in the period from October 2012 to January 2013 in four locations in northern Portugal. It was used a questionnaire consisting of three parts: the first contained items of personal characterization, the second consisted of the scale "Pharmacy Services Questionnaire" (FSQ) validated for the Portuguese language, developed by Larson et al. (2002) and the last had questions about the respondents' opinion. The results showed that the degree of satisfaction with the services of community pharmacies was in majority an average to 39 % and good for 46,1% . Having in mind the factor by gender, females showed a higher degree of satisfaction. Regarding the age group, older users had the highest degree of satisfaction. It was concluded that, generally, community pharmacies bring a higher degree of satisfaction in the older and the female users. "How the pharmacy professionals explain possible side effects" and "how the pharmacy professional answers your questions.", are the two aspects that must be improved to achieve a higher degree of satisfaction.Keywords
Satisfaction, Users, Customer Service, Pharmacotherapy Monitoring, Community Pharmacies1. Introduction
In last decades, the pharmacy professionals (PP) have made considerable efforts to shift its focus from dispensing medications to the attending service. They are becoming more interested in expanding their role beyond the distribution functions and preparation of medicines, services, assistance and pharmaceutical information. [1]
The PP, due to his contribution in clarifying the use of prescribed therapy and also in monitoring pharmacotherapy, becomes co-responsible for the quality of life of the user. User and professional must be viewed as a whole, concepts of person, responsibility, justice, among others, should be internalized to shape professional conduct. The humanization of pharmacy service goes through all these aspects and also covers issues regarding the environment of the attending service. [2] The attending based on attention,
affection and responsibility for the health of the user is always the first and foremost loyalty factor. The PP should use a simple and understandable language, responding to the needs and problems of users quickly, offering the solutions. They should encourage the user to read the information available about the medicine and also provide all the information he needs. They should also be prepared to advise users about practical ways to implement information received.[3] However, many people who work
full-time in a pharmacy, due to the agitation created by the day-to-day, end up forgetting that the vast majority of people moving there, need help and are not feeling well, being the role of PP to provide that help. [4] This
relationship with the user is essential to promote health, prevent disease and to ensure that medicine therapy is safe and effective. [5] The PP with a better attending performance
contributes significantly to the outcome of medicine therapy and improves life quality of the user. [6] Other factors, such
a well organized comfortable space will only complement the attendance. [7]
According to Kotler[11], it makes no sense that Pharmacy
commercial relationship of the Pharmacy is supported on a model of personalized service, and one that makes customers continue, day after day, to seek their services.
According to the literature [9, 10] there are several factors
that have an important role on the quality of a service, such as:
1. Tangibility - includes all physical evidence that the service is inserted;
2. Reliability - the service is delivered as agreed; 3. Responsibility - readiness to correctly solve the
problems of users;
4. Courtesy - the professional is nice/polite/pleasant to meet the user's needs;
5. Availability – the ease and readiness of contact with the customer service personnel;
6. Communication – the professional is clear when giving information to the user;
7. Flexibility - promoting changes and desired adaptations by the user;
8. Accessibility - ease of access / contact with service providers;
9. Competence - the ability of professionals throughout the services;
10. Quality - durability, reliability and performance of the purchased product;
11. Image - reputation, credibility, seriousness;
12. Solidarity - help when the user has some kind of difficulty.
From the standpoint of users there are five crucial factors to achieve the quality needed [11]:
1. Trust in the service, that is, the performance of the professional providing the service is exactly as promised;
2. Be able to give a quick answer when customers need help;
3. Knowledge and courtesy of the pharmacy staff and their ability to convey trust and confidence;
4. Individualized attention given to users;
5. Appearance of physical facilities, equipment, staff pharmacy and communication material.
Thus, it is considered that the opinion of the user is essential, for monitoring the quality of health services, the identification of problems to fix or new expectations regarding care and, ultimately, the reorganization of health services. [12] For all these reasons it is necessary to listen to
people, to know what they feel, what they think and why, what they prefer and why. It is, however, equally important to make good use of what you will learn from the points of view, perceptions and choices of citizens. [13]
According to Felippe[14], by listening to the users the PP
can sense their needs and can tailor the service to each one. Research on user satisfaction with pharmacy services began less than three decades ago, and since then a significant amount of literature has been designed. [15, 16, 17] In the
design of Laroche et al. [18] the satisfaction or dissatisfaction
of the users is associated to the care of their needs and expectations, since the satisfaction and perceived quality of
the resulting expectations are related to attitudes or preferences. Laran et al. [19] support the idea that when a
user is exposed to a consumption situation, it is accompanied by certain expectations or desires, or both. If the perceived service matches or exceeds expectations, the user will be satisfied (Parasuraman et al., 1985). [15]
Donabedian[16] describes the evaluation of the care of
clients in two dimensions: technical performance for the balance achieved between the expected benefits and risks, and the professional - user relationship, corresponding to the reach of the expectations of the user (at this point inserted satisfaction) and social and professional norms.
Note that the expectations of users today are increasingly high, shaped by a level of demand supported on a greater knowledge and awareness of price and product features. So it is increasingly hard to please and meet their needs and desires. [16] The user satisfaction can be defined as "a
personal evaluation of the patient on the health care services and providers."[17]
According to the study Pharmaceutical Care: relevance and impact in the current context of Health, performed by Maria João NevesGuerreiroDurão Mauritius in 2009, applied to Portuguese pharmacies [20], concluded that
females and older age users, have higher levels of satisfaction with pharmacy services, in another hand, users that go to the pharmacy regularly have higher levels of satisfaction.
The observed level of satisfaction becomes a useful tool because corrective measures aimed at constant improvement of the service user can be taken. [21] The
questionnaires are usually the instruments used to assess user satisfaction and also constitute an important component of program evaluation and improvement of quality of care. These should be done regularly, because satisfaction is constantly changing and can be influenced by the personality of the user. In short, a high level of satisfaction, motivation and training of staff translates into better quality care, increasing satisfaction in the users. [22]
This study has the purpose to determine satisfaction levels with the care provided in community pharmacies, if there is a relationship between factors of a personal nature (age and gender) and satisfaction, evaluating if the proper care is related to continued treatment, analyzing the differences between care provided and expectations showing key aspects to improve in order to increase satisfaction.
2. Materials and Methods
2.1. Participants
This transversal, observational and correlational study, was based on a non-probability accidental sample, consisting of 525 respondents.
respondents did not answer the question (Graphic 1).
Graphic 1. Gender of respondents
Aged 18 to 83 years, with an average of 41,81 years (SD ± 16,26) (Graphic 2).
Graphic 2. Age of respondents
Having in mind the age of respondents by age group, it was found 32,6% of respondents were in the age group of 18-31, 26,1% of respondents were between 32-45, 25,7% of respondents were between 46-59, and finally, 15,2% of respondents were over 59 (Graphic 3).
Graphic 3. Age groups of respondents
Regarding education of the respondents, 2,9% had no studies, 16,8% were between the 1st and 4th class, 9,5%
were located in the 6th year, 12,4% had completed the 9th
grade, 31, 6% had the 12th grade, 23,2% had higher
[image:3.595.316.551.289.463.2]education and 3,6% did not answer this question (Table 1).
Table 1. Education of respondents
Scholarity
Frequency Percentage
No studies 15 2,9
1st to 4thclass 88 16,8
6thyear 50 9,5
9th grade 65 12,4
12th grade 166 31,6
HigherEducation 122 23,2
No answer 19 3,6
Total 525 100
56,9% of the respondents said they are used to going to the same pharmacy, while 43,1% reported the opposite (Graphic 4).
Graphic 4. Ratio of the usual frequency of the same pharmaceutical facility
[image:3.595.63.293.506.656.2]Regarding the respondents who answered "Yes" to the previous question (289 out of 525), it was found that 5,2% went more than once a week to the same pharmacy, 14,2% went once a week, 15,9% went three times per month, 23,5% went twice per month, 21,8% went once a month and 17,3% went less than once per month (Table 2).
Table 2. Frequency of going to the same pharmacy (n = 289) How often will the same pharmacy
Frequency
(n=289) Percentage
More than once a week 15 5,2
Once a week 41 14,2
Three times per month 46 15,9
Twice per month 68 23,5
Once a month 63 21,8
Less than once per month 50 17,3
No answer 6 2,1
2.2. Data Collection Instrument (DCI)
In order to collect the necessary data for this work we used a questionnaire on “Satisfaction of the Service Users in Community Pharmacies".
The questionnaire consisted of three parts, the first referred to characterization issues such as gender, age, education and frequency of going to the same pharmacy. The second part consisted of the scale, "Pharmacy Services Questionnaire" developed by Larson et al [23]. The authors
of the scale were asked an authorization for its use in the preparation of this research. The scale contains twenty descriptive items about customer satisfaction. For each item there are several possible answers, using the respondent to effect a Likert scale, ranging from 1 (weak) to 5 (Great). The third part contains three questions on the opinion of respondents about their expectations regarding the attending, treatment and choice of pharmacy.
2.3. Procedures
The questionnaires were distributed in four locations selected for convenience (and in each location the number of questionnaires corresponded to at least 1% of the resident population), from October 2012 to January 2013.The questionnaires were distributed, delivered in paper directly to users in community pharmacies regarding internship sites and public places. Before distributing the questionnaires, researchers reported orally to each user what the questionnaire was about, referring also to the confidentiality, anonymity, voluntary participation and thanking them their collaboration. During filling respondents answered the questionnaires by themselves, accompanied by one of the investigators to clarify possible doubts. Nevertheless the investigators had to read the questions and answer options and writing answers of respondents with difficulties in reading and/or writing. To complete the questionnaire, respondents were required to be over 18 years old and were attending pharmacy services regularly. Users under 18 were excluded.
2.4. Statistical Analysis
After data collection we proceeded to the treatment and analysis of the results. For data analysis we used SPSS version 20.0. Data were subjected to descriptive statistics (mean, mode, median, standard deviation and frequencies). To identify satisfaction with the attending service provided to users by community pharmacies, we used exploratory factor analysis. For the extraction of the factors we used the method of principal components with Varimax rotation; it was made a reliability analysis to analyze internal consistency of factors (Cronbach's alpha), we used the parametric Student's t-test, One Way ANOVA to identify significant differences between independent groups and Pearson-R to determine the contribution of each factor on overall satisfaction and correlate the dimensions of each
other. The significance level was 5%.
3. Results
To sort the user's overall satisfaction and satisfaction with the "Service" and "Monitoring Pharmacotherapy" was considered the midpoint of the Likert scale, so the range 1 to 2,49 rated their satisfaction with the factor as "Reduced"; the range 2,5 to 3,49 factor classified as "Moderate", the 3,5 to 4,49 range factor classified as "Good" and the parameter > 4,5 factor classified as "Very Good".
[image:4.595.312.552.289.745.2]According to Table 3, it was found that the respondents, in general, are satisfied with the service in community pharmacies, as in each item the average is higher than 3 which is considered good.
Table 3. Mean and SD of the scale items
Mean Deviation Standard 1. The professional appearance of the
pharmacy. 3,70 0,772
2. The availability of the pharmacist to
answer your questions. 3,66 0,779
3. The pharmacist’s professional relationship
with you. 3,66 0,844
4. The pharmacist’s ability to advise you about problems that you might have with
your medications. 3,55 0,840
5. The promptness of prescription drug
service. 3,71 0,886
6. The professionalism of the pharmacy staff. 3,78 0,864 7. How well the pharmacist explains what
your medications do. 3,56 0,858
8. The pharmacist’s interest in your health. 3,34 0,919 9. How well the pharmacist helps you to
manage your medications. 3,53 0,818
10. The pharmacist’s efforts to solve problems that you have with your
medications. 3,45 0,829
11. The responsibility that the pharmacist
assumes for your drug therapy. 3,35 0,908
12. How well the pharmacist instructs you
about how to take your medications. 3,65 0,854
13. Your pharmacy services overall. 3,72 0,831
14. How well the pharmacist answers your
questions. 3,57 0,825
15. The pharmacist’s efforts to help you
improve your health or stay healthy. 3,45 0,878
16. The courtesy and respect shown you by
the pharmacy staff. 3,82 0,860
17. The privacy of your conversations with
the pharmacist. 3,64 0,944
18. The pharmacist’s efforts to assure that your medications do what they are supposed
to. 3,41 0,898
19. How well the pharmacist explains
possible side effects. 3,21 1,011
20. The amount of time the pharmacist offers
Table 4. Factorial matrix (loadings), explained variance and Cronbach’s Alpha coefficients
1 2
7. How well the pharmacist explains what
your medications do. 0,560
8. The pharmacist’s interest in your health. 0,705 9. How well the pharmacist helps you to
manage your medications. 0,687
10. The pharmacist’s efforts to solve problems that you have with your
medications. 0,674
11. The responsibility that the pharmacist
assumes for your drug therapy. 0,707
12. How well the pharmacist instructs you
about how to take your medications. 0,549
15. The pharmacist’s efforts to help you
improve your health or stay healthy. 0,662
17. The privacy of your conversations with
the pharmacist. 0,622
18. The pharmacist’s efforts to assure that your medications do what they are supposed
to. 0,778
19. How well the pharmacist explains
possible side effects. 0,837
20. The amount of time the pharmacist offers
to spend with you. 0,687
1. The professional appearance of the
pharmacy. 0,724
2. The availability of the pharmacist to
answer your questions. 0,776
3. The pharmacist’s professional relationship
with you. 0,752
4. The pharmacist’s ability to advise you about problems that you might have with
your medications. 0,682
5. The promptness of prescription drug
service. 0,721
6. The professionalism of the pharmacy staff. 0,762
13. Your pharmacy services overall. 0,641
14. How well the pharmacist answers your
questions. 0,612
16. The courtesy and respect shown you by
the pharmacy staff. 0,628
Analysis of variance (64,230%) 32,365% 31,865%
Cronbach Alpha 0,941 0,929
Cronbach Alpha total 0,962
The indicators of the validity of the factor analysis revealed a KMO = 0,972, considered very good[24, 25]. The
factor analysis revealed two factors (each item was assigned to the factor which had a correlation coefficient greater than 0,5 and when they were both above 0,5 were assigned to the factor which had a correlation coefficient greater) that explained 64,230 % of the total variance, they are only two factors with higher values greater than one. The first designated factor "Monitoring Pharmacotherapy " explained 32,365 % of the variance and included items : "How well the pharmacist explains what your medications do", "The pharmacist’s interest in your health", "How well the pharmacist helps you to manage your medications", "The pharmacist’s efforts to solve problems that you have with
your medications", "The responsibility that the pharmacist assumes for your medicine therapy", "How well the pharmacist instructs you about how to take your medications", "The pharmacist’s efforts to help you improve your health or stay healthy", " The privacy of your conversations with the pharmacist", "The pharmacist’s efforts to assure that your medications do what they are supposed to", "How well the pharmacist explains possible side effects" and "The amount of time the pharmacist offers to spend with you". The second factor called "Service" explained 31,865 % of the variance and consisted of the following items: "The professional appearance of the pharmacy", "The availability of the pharmacist to answer your questions", "The pharmacist’s professional relationship with you", "The pharmacist’s ability to advise you about problems that you might have with your medications", "The promptness of prescription drug service", "The professionalism of the pharmacy staff", "Your pharmacy services overall", "How well the pharmacist answers your questions" and "The courtesy and respect shown you by the pharmacy staff ".
The overall Cronbach’s alpha was 0,962, which indicates the reliability of very good internal consistency. The Cronbach’s alpha for the factor "Monitoring Pharmacotherapy" was 0,941 and the factor "Service" was 0,929 and so was concluded that the instrument used to measure user satisfaction with the care provided by community pharmacies is highly reliable.
Graphic 5. Distribution of respondents by satisfaction levels for Factor Monitoring Pharmacotherapy
Graphic 7. Distribution of respondents by levels of overall satisfaction The response rate for the overall satisfaction and each of the factors of satisfaction are presented in Graphic 5, 6 and 7. The two factors had a greater number of respondents to classify the service as Moderate (43,2% for "Monitoring Pharmacotherapy" and 33,9% for the factor "Attending") and Good (41,1% for the factor "Monitoring pharmacotherapy" and 50,9% for the factor "Attending"). The overall satisfaction had a greater number of respondents rating the service to Moderate (39%) and Good (46,1%).
The factor "Attending" showed the greater contribution to the total satisfaction (r=0,864, p<0,001) compared to the factor "Monitoring Pharmacotherapy" (r=0,848, p<0,001).
The factor "Pharmacotherapy Monitoring" presented an Average Satisfaction (Mean=3,45; SD±0,71) and the factor "Attending" showed a good level of satisfaction (Mean=3,69; SD±0,67) (table 5).
According to the test results R-Pearson correlation, it was found that all items are statistically significant (p=0,000 <0,05) are positively correlated from moderate to strong
with the level of overall satisfaction.
The contribution of the items on first factor varies from r=0,671 and r=0,782. Regarding the second factor, the contribution ranges from r=0,689 and r=0,766. That is, the items of the two factors have a high contribution to customer satisfaction.(Tables 13 and 14 – last pages of the article)
3.1. Gender
By using Student's t-test, it was found that the level of significance for the factor "Monitoring Pharmacotherapy" was 0,798 (greater than 0,05), concluding that there was no difference in satisfaction levels between people of different gender. Nevertheless, the factor "Attending" (p=0,030<0,05), there were statistically significant differences between the levels of satisfaction by gender. According to Table 6, it was found that women are the ones who experience higher levels of satisfaction compared to men.
3.2. Age
[image:6.595.64.291.87.219.2]By using one-way ANOVA, it was found that the level of significance for the factor "Monitoring Pharmacotherapy" was 0,008 (less than 0,05), then it was concluded that there were differences between age groups in relation to the levels of satisfaction . In what regards the "Attending", there were no statistically significant differences (p=0,109<0,05). Through analysis of table 7, it was concluded that older are the ones showing higher levels of satisfaction.
Table 5. Rate of correlations, Mean and SD of the factors
Factors satisfaction Total Management therapeutics Service Mean Standard deviation
Total satisfaction 1 - -
Monitoring
pharmacotherapy 0,848 1 - 3,45 0,71
Service 0,864 0,712 1 3,69 0,67
** p <0.001
Table 6. Correlation between gender and the two factors - Pharmacotherapy Monitoring and Service
Mean Ranking P-value
Monitoring pharmacotherapy Feminine 2,46 0,798
Masculine 2,45
Service Feminine 2,77 0,030
[image:6.595.134.478.515.602.2]Table 7. Correlation of Age of respondents with two factors - Pharmacotherapy Monitoring and Service
Mean Ranking P-value
Monitoringpharma cotherapy
18-31 years 2,33
0,008
32-45 years 2,48
46-59 years 2,49
>59 years 2,68
Service
18-31 years 2,63
0,109
32-45 years 2,74
46-59 years 2,70
>59 years 2,86
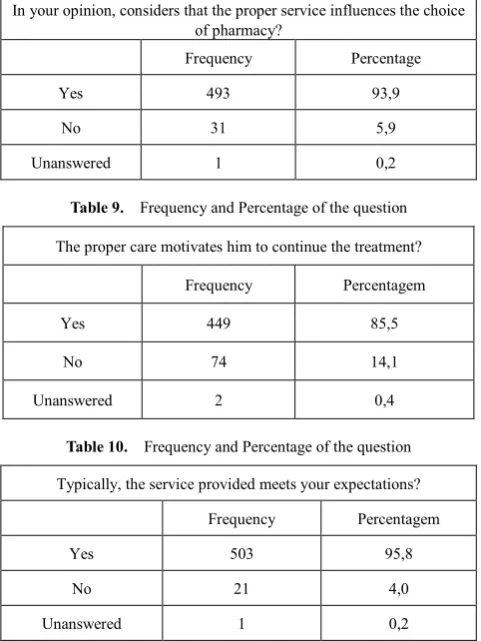
Finally, through the analysis of Tables 8, 9 and 10, it was concluded that 93,9% of respondents believe that the attending service influences the choice of pharmacy; approximately 85,5% consider that it influences the continuation of treatment and 95,8% of respondents believes that this service meets their expectations.
Table 8. Frequency and Percentage of the question In your opinion, considers that the proper service influences the choice
of pharmacy?
Frequency Percentage
Yes 493 93,9
No 31 5,9
[image:7.595.58.299.368.689.2]Unanswered 1 0,2
Table 9. Frequency and Percentage of the question
The proper care motivates him to continue the treatment?
Frequency Percentagem
Yes 449 85,5
No 74 14,1
Unanswered 2 0,4
Table 10. Frequency and Percentage of the question
Typically, the service provided meets your expectations?
Frequency Percentagem
Yes 503 95,8
No 21 4,0
Unanswered 1 0,2
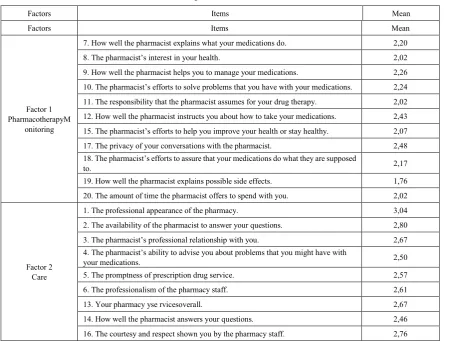
In order to identify which items increase the level of users satisfaction of was decided to calculate the average of each of the items belonging to each factor. So it was concluded that the factor "Monitoring Pharmacotherapy"
items which recorded the lowest levels of satisfaction were: "How well the pharmacist explains possible side effects" (Mean = 1,76), "The pharmacist’s interest in your health" (Mean = 2,02), " The responsibility that the pharmacist assumes for your medicine therapy" (Mean = 2,02) and "The amount of time the pharmacist offers to spend with you" (Mean = 2,02). The Attending factor, the items that showed lower levels of satisfaction were: "How well the pharmacist answers your questions" (Mean = 2,46) and "The pharmacist’s ability to advise you about problems that you might have with your medications" (Mean = 2,50).(Table 15 – last pages)
4. Discussion
Of all the participants, most of them were women aged between 18-31 years. Regarding education, it was found that most of the population had the 12th grade.
In the investigation of Iglesias et al. [26], the dimension
"Monitoring Pharmacotherapy"/" Therapy Management" scale included 12 items and "Nice Enlightenment"/"Service" owned 8 items. While the study by Larson et al. [23], the factor "Monitoring
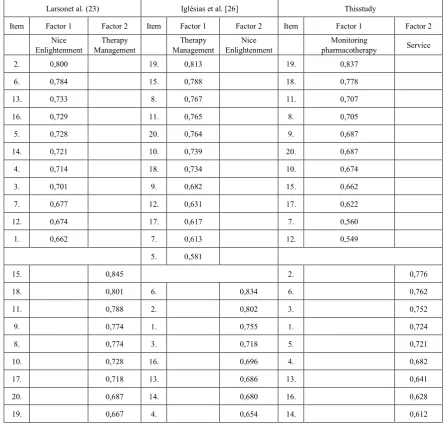
Pharmacotherapy"/"Therapy Management" presented nine items and the factor of "Nice Enlightenment"/"Attending" includes 11 items. In this study, the factor "Monitoring Pharmacotherapy" possessed 11 items and factor "Attending" included 9 items. This different distribution depends on the different distinction that users perform of the items associated with these two dimensions. In other words, what they understand by "Monitoring Pharmacotherapy" something related to the pharmaceutical care, and what they mean by "Attending" - something related to aspects of communication associated with information that is provided by the professional and to the communication. Table 11 shows the difference in the distribution of items in three studies. This table lists the items in decreasing order according to the importance of the factors. It is noted that the difference in the distribution of the items, compared to the study of Iglesias et al. [26] refers
to the item 5, since factor is in "Monitoring Pharmacotherapy"/"Therapy Management", while this item belongs to this study factor "Attending". Concerning the study of Larson et al. [23], it was found that there was a
Table 11. Comparison of the factors with the items in order of decreasing weight factor between Larson et al. [23] study of Iglesias et al. [26] and the present investigation
Larsonet al. (23) Iglésias et al. [26] Thisstudy
Item Factor 1 Factor 2 Item Factor 1 Factor 2 Item Factor 1 Factor 2
Nice
Enlightenment Management Therapy Management Therapy Enlightenment Nice pharmacotherapy Monitoring Service
2. 0,800 19. 0,813 19. 0,837
6. 0,784 15. 0,788 18. 0,778
13. 0,733 8. 0,767 11. 0,707
16. 0,729 11. 0,765 8. 0,705
5. 0,728 20. 0,764 9. 0,687
14. 0,721 10. 0,739 20. 0,687
4. 0,714 18. 0,734 10. 0,674
3. 0,701 9. 0,682 15. 0,662
7. 0,677 12. 0,631 17. 0,622
12. 0,674 17. 0,617 7. 0,560
1. 0,662 7. 0,613 12. 0,549
5. 0,581
15. 0,845 2. 0,776
18. 0,801 6. 0,834 6. 0,762
11. 0,788 2. 0,802 3. 0,752
9. 0,774 1. 0,755 1. 0,724
8. 0,774 3. 0,718 5. 0,721
10. 0,728 16. 0,696 4. 0,682
17. 0,718 13. 0,686 13. 0,641
20. 0,687 14. 0,680 16. 0,628
19. 0,667 4. 0,654 14. 0,612
The value of reliability in this study (KMO = 0.972) was similar to Larson et al. [23] (KMO = 0,97) and higher than the
value found by Iglesias et al [26] (KMO = 0,96) (Table 12).
With regard to analysis of variance, it was found that, in this study, the factor "Monitoring Pharmacotherapy" possessed a variance of 32,36% and the factor "Attending" showed a variance of 31,85%. In the version of Iglesias et al. [26], the factor
"Therapy Management" presented a variance of 66,9% and the factor of "Nice Enlightenment" registered a value of 5,1%. In the study by Larson [23], the factor of "Nice Enlightenment" possessed a variance of 67,7% and the factor "Therapy
Management" was 5,1%. (Table 15)
The reliability of the scale and each factor was high (in three studies), which demonstrated that the instrument is highly reliable. In the version of Iglesias et al. [26], the Cronbach’s alpha for the factor "Therapeutic Management" was 0,960 and
the factor of "Nice Enlightenment" was 0,939. In the study by Larson et al. [23], the Cronbach’s alpha for the factor
"Therapeutic Management" was 0,962 and the factor of "Nice Enlightenment" was 0,957. In the present study, the overall Cronbach’s alpha was 0,962, the Cronbach’s alpha factor "Monitoring Pharmacotherapy" was 0,941 and the factor "Attending" was 0,929. (Table 12)
Table 12. Comparison between the results of Larson et al. [23] study of Iglesias et al. [26] and the present investigation
Statistical analysis Larsonet al.[23] Iglésias et al.[26] Thisstudy
Test Kaiser-Meyer-Olkin retiraram-se os valores 0,97 (n=371, missing)
0,96 (n=178, retiraram-se os
valores missing) 0,972 (n=525, retiraram-se os valores missing)
Factor analysis - extraction of principal components
with varimax rotation
Factor 1 – 67,7% of the variance. Factor 2 – 5,1% of the
variance. Extraction of 2 factors.
Factor 1 – 66,9% of the variance. Factor 2 – 5,1% of the variance.
Extraction of 2 factors.
Factor 1 – 32,365% of the variance. Factor 2 – 31,865% of the variance.
Extraction of 2 factors.
Cronbachalpha (external consistency)
Friendly explanation – 0,957 Management Therapeutics – 0,962
Friendly explanation – 0,939 Management Therapeutics –
0,960
Monitoring pharmacotherapy – 0,941 Service– 0,929
Mean ± standard deviation score for each dimension
Friendly explanation – 4,31±0,66 Management Therapeutics –
3,94±0,85
Friendly explanation – 4,17±0,68 Management Therapeutics –
3,96±0,72
Monitoring pharmacotherapy – 3,45±0,71 Service– 3,69±0,67
t-pares, to compare the scores of the respondents in
the three scales
p<0,01, no statistically significant differences
between the two dimensions
p<0,01, no statistically significant differences between the two
dimensions
p<0,01, no statistically significant differences between the two
[image:9.595.79.536.92.710.2]dimensions
Table 13. Correlations Monitoring Pharmacotherapy (factor 1)
Factor 1 – Monitoring Pharmacotherapy
7. How well the pharmacist explains what your medications do. Correlation Coefficient 0,714
Significance Level 0,000
8. The pharmacist’s interest in your health.
Correlation
Coefficient 0,718
Significance Level 0,000
9. How well the pharmacist helps you to manage your medications. Correlation Coefficient 0,771
Significance Level 0,000
10. The pharmacist’s efforts to solve problems that you have with your medications.
Correlation Coefficient 0,783
Significance Level 0,000
11. The responsibility that the pharmacist assumes for your drug therapy. Correlation Coefficient 0,763
Significance Level 0,000
12. How well the pharmacist instructs you about how to take your medications. Correlation Coefficient 0,711
Significance Level 0,000
15. The pharmacist’s efforts to help you improve your health or stay healthy. Correlation Coefficient 0,721
Significance Level 0,000
17. The privacy of your conversations with the pharmacist. Correlation Coefficient 0,673
Significance Level 0,000
18. The pharmacist’s efforts to assure that your medications do what they are supposed to.
Correlation Coefficient 0,786
Significance Level 0,000
19. How well the pharmacist explains possible side effects. Correlation Coefficient 0,741
Significance Level 0,000
20. The amount of time the pharmacist offers to spend with you. Correlation Coefficient 0,715
[image:9.595.85.529.108.702.2]Table 14. Correlations Service (factor 2) Factor 2 –Service
1. The professional appearance of the pharmacy. Correlation Coefficient 0,689
Significance Level 0,000
2. The availability of the pharmacist to answer your questions. Correlation Coefficient 0,750
Significance Level 0,000
3. The pharmacist’s professional relationship with you. Correlation Coefficient 0,753
Significance Level 0,000
4. The pharmacist’s ability to advise you about problems that you might have with your medications.
Correlation Coefficient 0,716
Significance Level 0,000
5. The promptness of prescription drug service. Correlation Coefficient 0,734
Significance Level 0,000
6. The professionalism of the pharmacy staff. Correlation Coefficient 0,748
Significance Level 0,000
13. Your pharmacy services overall. Correlation Coefficient 0,718
Significance Level 0,000
14. How well the pharmacist answers your questions. Correlation Coefficient 0,766
Significance Level 0,000
16. The courtesy and respect shown you by the pharmacy staff. Correlation Coefficient 0,741
[image:10.595.84.536.377.718.2]Significance Level 0,000
Table 15. Average each of the items of each factor
Factors Items Mean
Factors Items Mean
Factor 1 PharmacotherapyM
onitoring
7. How well the pharmacist explains what your medications do. 2,20
8. The pharmacist’s interest in your health. 2,02
9. How well the pharmacist helps you to manage your medications. 2,26
10. The pharmacist’s efforts to solve problems that you have with your medications. 2,24 11. The responsibility that the pharmacist assumes for your drug therapy. 2,02 12. How well the pharmacist instructs you about how to take your medications. 2,43 15. The pharmacist’s efforts to help you improve your health or stay healthy. 2,07
17. The privacy of your conversations with the pharmacist. 2,48
18. The pharmacist’s efforts to assure that your medications do what they are supposed
to. 2,17
19. How well the pharmacist explains possible side effects. 1,76
20. The amount of time the pharmacist offers to spend with you. 2,02
Factor 2 Care
1. The professional appearance of the pharmacy. 3,04
2. The availability of the pharmacist to answer your questions. 2,80
3. The pharmacist’s professional relationship with you. 2,67
4. The pharmacist’s ability to advise you about problems that you might have with
your medications. 2,50
5. The promptness of prescription drug service. 2,57
6. The professionalism of the pharmacy staff. 2,61
13. Your pharmacy yse rvicesoverall. 2,67
14. How well the pharmacist answers your questions. 2,46
The two factors had a greater number of respondents to classify the service as the Moderate "Monitoring Pharmacotherapy" (43,2%) and "Attending" (33,9%), and the Good "Monitoring Pharmacotherapy" (41,1%) and "Attending" (50,9%). The overall satisfaction had a greater number of respondents rating the service to Moderate (39%) and Good (46,1%).
The factor "Attending" showed the greater contribution to the total satisfaction (r=0.864, p<0,001) compared to the factor "Monitoring Pharmacotherapy" (r=0,848, p<0,001). Moreover, all items of the two factors had a high contribution to the satisfaction of the users.
Regarding the gender of respondents, it was only found that only the factor "Attending" had differences, since it is the female are the most satisfied. Regarding the factor age, it was concluded that there were differences in the factor "Monitoring Pharmacotherapy", and users with older children are those with higher levels of satisfaction. These results are consistent with findings in other studies previously performed, as is the case study Pharmaceutical Care: relevance and impact in the current context of Health, performed by Maria João NevesGuerreiroDurão Mauritius in 2009 [20], applied to Portuguese pharmacies. A possible
explanation of this fact is that these two groups that are most often visit the pharmacy and maybe even questioned more pharmacy professionals than men and younger people.
The results also showed that the vast majority (93,9 %) of respondents believe that the attendance influences the choice of pharmacy; approximately 85,5 % consider that this service influences continued treatment and 95,8 % of respondents believes that it meets their expectations.
Finally, it was found that the "Follow up Pharmacotherapy" was item to be improved, it registered the lowest satisfaction levels which are: "How the professional chemist will explain the possible side effects", "The interest pharmacy professional in your health", "The responsibility of the pharmacy profession takes for their treatment with medicines" and "the time that the pharmacy profession available to be with you". In the factor "Attending", we must improve aspects: "The way the pharmacy professional answers to your questions" and "The capacity of the pharmacy professional to advise you on the problems you may have with your medications".
5. Conclusion
By analyzing the results, we have withdrawn the following conclusions: through factor analysis extracted two factors, namely, the "Monitoring Pharmacotherapy" with 11 items and the "Attending" with 9 items, the internal consistency reliabilities of the scale, the factor "Monitoring Pharmacotherapy" and "Attending" were high, with alpha values of 0,962, 0,941 and 0,929, respectively. In general, users feel satisfied with the service in community pharmacies, the factor "Attending" is the one which contributes most to the overall satisfaction; females and
older users are those with greater satisfaction, and, finally, there are still some aspects to improve, so that users can have a greater satisfaction level.
In general, all the objectives were achieved, as well as analysis of the object of study "Satisfaction of users with the care provided in community pharmacies" presented with good results. Despite some limitations that have arisen, including: difficulty in obtaining 525 surveys, information overload on the subject and reduced time for data analysis. With this study, the objective is that health professionals never forget that a good relationship with the patient is key to treating it and highlight which aspects need to be improved in this area, so that the user always feel satisfied.
REFERENCES
[1] Wiedenmayer, K.; Summers, R.B.; Mackie, C.A.; Gous, G.A.; Everard, M. (2006). Developing pharmacy practice: a focus on patient care. Switzerland: World Health Organization.
[2] Faria, C.M.F. (2009). The quality pharmaceutical service: Instrument development Pharmperf; Master Thesis in Business Management, Faculty of Economics, University of Porto.
[3] Panvelkar, P.N.; Saini, B; Armour, C. (2009). Measurement of patient satisfaction with community pharmacy services: a review. Pharm World Sci, 31, 525-537.
[4] Heemann, A. (2002). Concerning Marketing of Pharmacy. Academic Vision, 3 (2):119-122.
[5] American Pharmaceutical Association (2010). Principles of practice of pharmaceutical care. Rio de Janeiro, Authentic Publisher.
[6] Hepler, C.D.; Strand, L.M. (1990). Opportunities and responsibilities in pharmaceutical care. Am J HospPharm, 47: 533-543.
[7] Blessa , R. (2008). Merchandisingfarma: The Pharmacy in the Future. São Paulo, Cengage Learning.
[8] Aguiar (2009). The Pharmacy Management - Overcoming New Challenges. Lisbon Hollyfar.
[9] Anderson, C.R.; Paine, F.T. (1975). Managerial Perception and Strategic Behavior. Academy of Management Journal, 18 (4): 813-823.
[10] Zeithaml, V.A.; Parasuraman, A., Berry, L.L. (1990). Delivering quality service - balancing customer perceptions and expectations. New York: The Free Press.
[11] Kotler, P. (2000). Marketing Management. São Paulo, Prentice Hall.
Coordination Committee of the North Region.
[13] Sakellarides, C. (2003) " Foreword " in Portuguese Satisfaction with Health Care Private, Lisbon: Editing Consumer Institute.
[14] Felippe, M.I.(2007) Customer Focus and Innovation - Quality Magazine Banas, 182: 47-49.
[15] Parasuraman, A.; Zeithaml, V.; Berry, L. (1985) A conceptual model of service quality and its implication for future research. Journal of Marketing 49 (4): 41-50.
[16] Donabedian A. (1979). The quality of medical care: a concept in search of a definition. J FamPract; 9:277-84. [17] Oparah, B.C.; Kikanme, L. C. (2006). Consumer satisfaction
with community pharmacies in Warri, Nigeria. Research in social &administrativephatmacy: RSAP, 2 (4): 499-511. [18] Laroche, M.; Kalama, M.; Cheikhrouhou, S.; Cezard, A.
(2004), An Assessment of the Dimensionality of Service Should Expectations and Will, Canadian Journal of Administrative Sciences, 21 (4): 361-375.
[19] Laran, J. A., Almeida, S.O.; Hofman, J.A (2004). Desires of consumers: one loar on determinants of satisfaction. Administration Review, 39 (1): 42-52.
[20] Maurice, M. J. N. G. D. (2009) Pharmaceutical Care:
Relevance and impact in the current context of the Health. Master's Thesis in Management of Health Services, ISCTE Business School, Lisbon.
[21] Thaddaeus, U.A.; Daiani, M.B.; Michelli, O.M.; Natyara, S.B.; Renata, A.D.S.; Francielli, T.B.; Nazareth, S.B. (2009) Evaluation of the level of satisfaction of patients attending a pharmaceutical care program in community pharmacy private in Victoria; Brazilian Journal of Pharmaceutical Sciences, 45 (2): 350-355.
[22] Massi, V. (2006). Systems Marketing and Sales. Pharmacy Guide, pp. 96-99.
[23] Larson L.N.; Rovers, J.P.; MacKeigan, L.D. (2002). Patient satisfaction with Pharmaceutical Care: update of a validated instrument. Jam PharmAssoc, 42 (1): 44-50.
[24] Pestana, M.; Gageiro, J. (2005). Data analysis for the social sciences: the complementarity of the SPSS, 4th revised and extended edition. Lisbon: Issues Syllabus.
[25] Nunnally, J.C. (1978). Psychometric theory. New York: McGraw Hill.


![Table 12. Comparison between the results of Larson et al. [23] study of Iglesias et al](https://thumb-us.123doks.com/thumbv2/123dok_us/8792417.909921/9.595.79.536.92.710/table-comparison-results-larson-et-al-study-iglesias.webp)