Quantification of Protein Expression on an
Immunofluorescence Section by Using the
MetaMorph Image Analysis System
Esther Durán, Riánsares Arriazu
*Histology Laboratory, Institute of Applied Molecular Medicine, Department of Basic Medical Sciences, School of Medicine, CEU-San Pablo University, Ctra a Boadilla del Monte Km 5.300, 28668 Montepríncipe – Madrid, Spain.
*Corresponding Author: [email protected]
Copyright © 2013 Horizon Research Publishing All rights reserved
Abstract
In recent years, cancer treatment response and disease progression increasingly rely on immunofluorescence to monitor the changes in targeted antigens. Estimation of abundances of antigens has so far relied primarily on visual scoring and to a lesser extent on computer-assisted image processing techniques. The quantification of immunostaining by means of digital image analysis by using Leica MetaMorph AF 1.4 allows the characterization of protein expression revealed by immunohistochemistry on normal or pathological tissue slices. Our study focuses on the practical aspects of image acquisition, segmentation of staining and counterstaining areas, and extraction of quantitative features. We illustrate our findings by using a Red-Green-Blue (RGB) system to quantify different immunofluorescence markers targeting proteins with different expression patterns (cytoplasmic and membranous) in human breast cancer. Our investigations led us to identify several steps that we consider essential for standardizing computer-assisted immunostaining quantification experiments. In addition, we propose a data normalization process based on reference materials to compare measurements between different samples. In conclusion, we recommend certain critical prerequisites that commercial or in-house systems should satisfy to permit valid immunostaining quantification. In conclusion, image analysis-based quantitative immunofluorescence has the potential to accurately improve biomarker evaluation in research, clinical, and therapeutic applications for the study of cancer and other diseases.Keywords
Immunofluorescence, Quantification, Metamorph1. Introduction
Immunohistochemistry for the evaluation of antigen
expression as well as high-resolution methodologies for cytogenetic analysis are standard procedures for the diagnosis and prognosis of cancer and other diseases (1). In recent years, cancer treatment response and disease progression increasingly rely on immunofluorescence to monitor changes in the targeted antigens. Estimation of abundances of antigens has so far relied primarily on visual scoring and to a lesser extent on computer-assisted image processing techniques (2).
The quantification of immunostaining by means of digital image analysis allows the characterization of protein expression revealed by immunofluorescence on normal or pathological tissue slices. In contrast to other methods of evaluation of protein expression, this approach enables morphological controls, and detailed tissue and cell localization to be carried out avoiding the problems caused by cell and tissue heterogeneity. This constitutes a promising approach for the identification of biomarkers that are useful for diagnostic, prognostic, and/or therapeutic purposes (3).
Image analysis is based on processing images from a microscope (directly, or through photographs, as in the work presented) wherein the recorded image becomes an array of points, which are identified according to their coordinates (position, brightness, and color) through a computerized format. In this way, multiple measurements can be made of lengths, areas, measurement of color, density, etc (4).
precisely indicate the protein’s position. However, only in the past decade has this concept been revolutionized with the advent of fluorescent proteins. Most computer-based techniques for immuno-image analysis techniques have so far had limited applicability owing to several drawbacks including a need for specific software systems, and often need considerable user input (8–11). Alternatively, spectral imaging, a recent application, offers an optimal method to capture and analyze images at multiple wavelengths (12). Although certain commercial systems include tools for quantitatively evaluating standard immunofluorescence staining images, the prerequisites to ensure reproducible and correct quantification of results are yet to be established (12). In this study, we use the Red-Green-Blue (RGB) space because microscopic images are most frequently displayed in these three colour spaces (13). Diagnostic surgical pathology deals with the measurement of image quality in tissue-based diagnosis (13). Therefore, RGB defines a primary color to quantify the optical density of the protein immunoexpression based on immunofluorescent staining.
Therefore, our study focuses on applications of MetaMorph Image Analysis System with immunofluorescence samples and emphasizes on the practical aspects of (i) standardization of image acquisition, (ii) standardization of staining and counterstaining areas, and (iii) extraction of valid quantitative features. Our efforts led us to the identification of many different steps for standardizing computer-assisted immunostaining quantification.
2. Materials and Methods
2.1. Tissue Samples
Twenty-eight breast cancer biopsies were obtained from the Department of Pathological Anatomy of the Hospital Universitario Montepríncipe, Boadilla del Monte, Madrid, Spain from 2007 to 2010. This study was approved by the Research Committe of the University San Pablo-CEU (Reference 012/11). The research was done with archival samples, so that informed consent was waived.
2.2. Immunofluorescence
As described previously, standard immunofluorescence was applied to single 5-µm-thick sections (one per antibody) that were incubated overnight at 4° C. To display the expression of antibodies by using specific monoclonal and polyclonal antibodies provided by NOVUS BIOLOGICALS (Litttleton, USA anti-human Nm23-H1 and anti-human EDG2 (LPA1); both with dilutions of 1:100) or Cell Signaling Technology (Boston, USA anti-human ezrin and phospho ezrin/ERM). In brief, the immunohistochemical expression was visualized by means of anti-rabbit Alexa® Fluor 488 (FITC alternative, green fluorescent dye) or anti-mouse Alexa® Fluor 647 (red dye) at 1:2000 dilution in
serum for 1 h. Every tissue sample was stained with DAPI highlighting the cell nuclei as a counterstain. Negative controls consisted of replacing the primary antibodies with a non-immune serum. The DAPI concentration was diluted by 1:1000 in all cases. A final validation stage was conducted for a visual evaluation of the immunostained slides. This stage aims to confirm the diagnostic, specific tissue zones that are initially targeted, and immunostaining compliance.
2.3. Standardized Computer-assisted Immunostaining Quantification
Leica Application Suite (LAS) V 3.6 was used for image acquisition with a 20-x objective for all the antibodies that were used and quantified. We developed the procedure to ensure valid staining quantification. The first stage consists of standardizing and optimizing the acquisition chain integrated into the appropriate imaging system. This is done to control the sources of variation owing to illumination and gain. The second stage focuses on identifying the positive immunoreactive versus the negative (background) tissue areas. To provide a valid quantitative evaluation of staining, the third stage focuses on normalizing the threshold area by considering the RGB system and the viewing channel. This procedure can be applied to any acquisition and quantification system that supplies the required tools.
2.4. Image Acquisition
Photographs of the histological sections were acquired with a Leica DFC345 camera FX fluorescence (Leica, Mannheim, Germany) coupled to a Leica CTR 6000 (Leica, Mannheim, Germany) and connected to a HP 1260 computer. Three images corresponded to a photographic image of each of the samples.
The image acquisition process must begin with a preheating step to enable the properties of the fluorescence lamp and stabilize the conditions of microscopy. It is important to reproduce the same sequence every time and thereby guaranteeing standardized acquisition. Acquisition tools include measuring of light intensity of the microscope and ways to control and adjust parameters, such as the gain or the relationship between the pixels and brightness (gamma).The goal should be to furnish the user with ways to reproduce similar acquisition conditions. Adapting the camera properties to the tissue and staining characteristics encountered in a particular study might help making positive staining, which is more obviously distinguishable from counterstaining.
to locate the tissue cores and support standardized image acquisition. Three photographs of the representative areas of each sample were taken.
2.5. Staining Detection
The staining analysis is performed by identifying the immunoreactive part depending on the antibody used. Image segmentation is carried out by means of the manual thresholding process.
Multi-component color thresholding was used to identify the tissue immunoreactive zones (shown in green or red depending on the secondary antibody used). In view of the spectral characteristics of the fluorochromes, we used the red/green/ blue (RGB) in which the green and red areas are more readily identifiable.
For individual analysis, a group of eight bits assigned one of the 255 possible integers from 0 to 255 to each pixel.
The region of interest (ROI) unequivocally serves in observing the expression through the set color threshold. These maximum range chromaticity images were obtained with 10 sections of positive immunoreactivity for each of the used channels (green and red) to minimize the error and for homogenizing conditions.
MetaMorph Leica AF 1.4 shows rank selection of the RGB values for the red fluorophore, wherein the threshold value range was obtained by including all the pixels that present the image. The positive threshold range for each of the secondary antibodies used was obtained by calculating the mean and standard deviation of the three replicate results of the 10 samples. This fact unequivocally defined the red or green range for our samples.
To verify whether the standardization is carried out, a
series of images were taken at optimal (but realistic) conditions for the observer and quantified in the same way as that of the other samples.
2.6. Quantification
We used the Leica MetaMorph software 1.4 to quantify the intensity value for each of the antibodies. Zones with specific immunoexpression were selected by random sampling of each of the images. The half-intensity values of immunoexpression for each of the areas marked were obtained from the reference values obtained through the RGB system described above. These values were obtained by subtracting the mean intensity values that mark the backgrounds from the average intensity values of the three random areas for each of the photographs and antibodies.
2.7. Statistics
Statistical analyses were performed by using SPSS (IBM SPSS Statistics for Windows, Version 20.0., Armonk, NY: IBM Corp.; Released 2011). Comparisons of groups were performed by Student’s t-test for parametric data and Mann Whitney U test for non parametric data. The correlation study was performed using the Pearson correlation test. Statistical significance was defined as p<0.05 or p<0.01. Graphs were plotted using the same software.
[image:3.595.145.465.479.732.2]Averages were obtained and comparison of intensities was made between the two fluorophores of a given antibody. We summarize all the steps involved in standardizing all the conditions given in Figure 1.
3. Results
In the first stage, we focused our analysis on breast cancer slides. The corresponding staining is cytoplasmic for Nm23 and LPA1 (Figure 2) and the staining is membrane immunoexpression for Ezrin and P-ezrin (Figure 3). The results obtained helped us to propose an appropriate approach for normalizing the data between the studies.
3.1. Influence of the Acquisition Parameters
Normalization Valuesfor Shooting
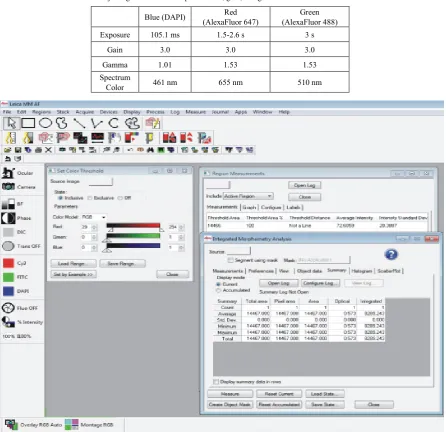
[image:4.595.182.436.289.481.2]For each of the antibodies to maintain realistic conditions, sample sets were obtained by adjusting the values for the exposure time, gain, and gamma, respectively (Table 1).
Figure 4 shows the Leica MetaMorph AF 1.4 window display during the selection of the RGB- value range for the
[image:4.595.169.437.519.720.2]sample image of breast cancer. The inclusive threshold-value range for the red color was increased until all the pixels present in the image were included. The others two colors (green and blue) of this secondary antibody did not include any possible threshold values. The thresholded image in Figure 4 displays each pixel transmitting light with RGB properties within the selected threshold range. For this particular secondary antibody, the selected inclusive threshold range of 29–254 is for red. Nevertheless, the percentage of the thresholded area to the whole area of the image was calculated to confirm the accuracy of the selected inclusive threshold range. The exact RGB threshold range for the image was defined when the percentage of the thresholded area was 100%, that is, all the color information associated with the section were included (Figure 4). The same procedure was performed for the complementary antibody as well.
Figure 2. Cytoplasmic protein expression using Alexa Fluor 647 (red) as secondary antibody (magnification, x200). Sections were immunolabeled with
antibodies directed against Nm23 (upper line) or LPA1 (line bellow) and stained with DAPI (blue) to identify the nucleus.
Table 1. Adjusting values for the exposure time, gain, and gamma for normalization conditions.
Blue (DAPI) (AlexaFluor 647) Red (AlexaFluor 488) Green
Exposure 105.1 ms 1.5-2.6 s 3 s
Gain 3.0 3.0 3.0
Gamma 1.01 1.53 1.53
Spectrum
Color 461 nm 655 nm 510 nm
Figure 4. The MetaMorph Leica AF 4.1 window display during the selection of the threshold red-green-blue (RGB) values for a sample image as described in the text. We confirmed the accuracy of the inclusive RGB threshold ranges selected for this sample image by calculating the percentage of the thresholded area of the image.
We consequently chose the threshold values to efficiently segment the positive tissue regions (Table 2). We obtained different intensities for each secondary antibody (Table 2).
Table 2. The Set Color Threshold dialog box shows the selected threshold intensity values for red (29–254) and green (112–255). The thresholded image displays each pixel transmitting light of the selected RGB properties by applying an overlay of investigator-selected red or green color.
Red (AlexaFluor 647) Green (AlexaFluor 488)
Red 29-254 0-1
Green 0-1 112-255
Blue 0-1 0-1
3.2. Influence of the Acquisition Parameters on Quantitative Features
Scatter plots shown in Figure 5 compare the data distribution pairs for each secondary antibody feature that was obtained by using either of the common set of parameter values. We observed the linear correlation coefficients (r) that characterize the distribution pairs. All the pairs exhibit good linear correlations. The relations between the pairs of value distributions could thus be reasonably modeled by linear relations.
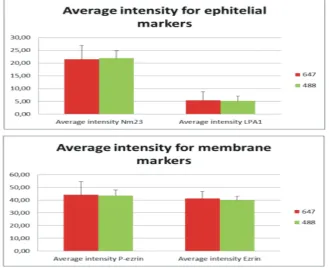
3.3. Computerized Morphometric Analysis of Immunostaining of Antibodies
Results show no statistically significant differences between the different secondary antibodies used (Figure 6), in all the study groups for cytoplasmic expression and membrane expression with standard conditions.
Figure 7 shows the distribution of the citoplasmatic antibody and membrane antibody in two samples of breast cancer, using the two study secondary antibodies (red and
green, respectively). Note that the signal intensities shows no significant differences.
The difference in the average intensity of a sample taken with other (but realistic) parameters is shown in Figure 8, which displays a change in the mean intensities of the results when the conditions for shooting (taking pictures) are not normalized.
Figure 5. Scatter plots comparing the distributions of values obtained for the different primary antibodies.
[image:6.595.141.471.462.730.2]Figure 7. Cytoplasmatic and membrane protein expression using Alexa Fluor 647 (red) as well as Alexa Fluor 488 (green) as secondary antibody. Sections were immunolabeled with antibodies directed against Nm23 (upper line) or P-ezrin (line bellow) and stained with DAPI (blue) to identify the nucleus. (Magnification x200).
4. Discussion
Since its early development, digital microscopic image analysis has offered the potential for improving the objectivity of microscopic observations and the results of immunofluorescence. Substantial efforts have already been made to convert the evaluations of experienced pathologists into quantitative values in cancer research (14–17). A number of studies have illustrated the value of the technology for protein expression profiling in cells tissue (18, 19) and its clinical validity in evaluating the importance of prognostic markers (20).
Figure 8. This figure shows the loss of these differences when employing random (but realistic) conditions versus the observed values.
This study describes a novel method for quantitative computer-assisted image analysis of an immunofluorescence-stained image. Our goal was to develop objective quantitative criteria that reliably identify
breast cancer and other diseases. Further, we plan to apply the method to other tissues. To develop an objective method, we first standardized the immunofluorescence procedure to reduce the variability and inconsistency in the evaluation of the tissue specimens.
As reported in the literature, we chose cytoplasmic and membrane markers to standardize the quantification through image analysis by using candidate markers in all types of cancers by both in vitro (21) and in vivo models (22).
We found that the MetaMorph software provided objective criteria that are useful to detect and quantify immunopositive staining. This finding is consistent with previous reports (23, 24). Our study demonstrated that the thresholding of immunostaining based on the RGB-color model is able to correctly discriminate the sections that are positive with breast cancer.
Suitably designed and automated imaging methods avoid the effects of human subjectivity to characterize the antigen expression on the samples and thus, they have the potential to improve immunofluorescence evaluation, at least in terms of precision and quantitative reproducibility. However, standard cut-off values are difficult to apply across laboratories owing to the variations in laboratory conditions during immunofluorescence manufacturing and staining (25).
[image:7.595.62.296.534.672.2]acquisition variability, such as the illumination source and camera response (26) or on the quality of the resulting digitized images (27).
Consequently, in addition to standardization and quality controls that are required for samples materials and the immunofluorescence process (28), standardization processes are also essential for image acquisition and segmentation. The latter requirements imply that commercial and in-house-developed immunofluorescence quantification systems have to provide tools to control the complete acquisition chain, including that of microscope light and sensor properties to control the cut-off values used for image segmentation and to enter predetermined acquisition and segmentation parameters into the system to reproduce identical conditions. Our study also implies that standard staining features (such as count, surface, and intensity measurements) are affected by variability in image acquisition conditions. This sensibility is owing to the fact that these variations may affect the positive status of certain image pixels in a binary way (by switching their on/off status) with a commensurate impact on the percentage of positive objects, the labeling index, and the staining intensity (3).
Our study illustrates that the use of common tissue materials is appropriate for matching different data sets.
5. Conclusion
In conclusion, MetaMorph Image Analysis System is a potent tool for protein expression quantification in immunofluorescence stained sections. The image analysis-based quantitative immunofluorescence has the potential to accurately improve biomarker evaluation in research, and clinical and therapeutic applications for the study of cancer and other diseases.
REFERENCES
[1] Anderson JE, Hansen LL, Mooren FC, Post M, Hug H, Zuse A, et al. (2006) Methods and biomarkers for the diagnosis and prognosis of cancer and other diseases: towards personalized medicine Drug Resist Updat. 9:198-210. [2] Walker RA. (2006) Quantification of immunohistochemistry
-issues concerning methods, utility and semiquantitative assessment I. Histopathology, 49(4):406-410.
[3] Decaestecker C, Lopez XM, D'Haene N, Roland I, Guendouz S, Duponchelle C, Berton A, Debeir O, Salmon I. (2009) Requirements for the valid quantification of immunostains on tissue microarray materials using image analysis. Proteomics. 9(19):4478-94.
[4] Swatland HJ (1995) Video image analysis. in: on-line evaluation of meat. technomic publising company, inc. usa. pp. 271-290.
[5] Pham NA, Morrison A, Schwock J, Aviel-Ronen S, Iakovlev V, Tsao MS, Ho J, Hedley DW. (2007) Quantitative image
analysis of immunohistochemical stains using a CMYK color model. Diagn Pathol., 2:8.
[6] White JG, Amos WB, Fordham M. (1987) An evaluation of confocal versus conventional imaging of biological structures by fluorescence light microscopy. J Cell Biol, 105: 41–48.
[7] Vonesch C, Aguet F, Vonesch JL, Unser M. (2006) An introduction to fluorescence microscopy. The Colored Revolution of Bioimaging. IEEE signal processing magazine 20-31.
[8] Brey EM, Lalani Z, Johnston C, Wong M, McIntire LV, Duke PJ, Patrick CW Jr (2003) Automated selection of DAB-labeled tissue for immunohistochemical quantification. J Histochem Cytochem, 51(5):575-584.
[9] Goedkoop AY, de Rie MA, Teunissen MB, Picavet DI, van der Hall PO, Bos JD, Tak PP, Kraan MC. (2005) Digital image analysis for the evaluation of the inflammatory infiltrate in psoriasis. Arch Dermatol Res , 297(2):51-59. [10] Kim D, Gregory CW, Smith GJ, Mohler JL (1999)
Immunohistochemical quantitation of androgen receptor expression using color video image analysis. Cytometry 35(1):2-10.
[11] Matkowskyj KA, Cox R, Jensen RT, Benya RV (2003) Quantitative immunohistochemistry by measuring
cumulative signal strength accurately measures receptor number. J Histochem Cytochem, 51(2):205-214.
[12] Taylor CR, Levenson RM (2006) Quantification of immunohistochemistry- issues concerning methods, utility and semiquantitative assessment II. Histopathology, 49(4):411-424.
[13] Kayser K, Metze K, Goldmann T, Vollmer E, Mireskandari M, Kosjerina Z, Kayser G (2008) How to measure image quality in tissue-based diagnosis (diagnostic surgical pathology). Diagnostic Pathology 3(Suppl 1):S11.
[14] Kohlberger PD, Kieback DG, Bancher D, Stickeler E, Heinzl H, Gitsch G, Breitenecker G. (1997) Immunohistochemical detection of CD44 splice variant expression in premalignant lesions of the cervix and benign cervical epithelium. Gynecol Oncol 1 66:227–232.
[15] Kohlberger PD, Breitenecker F, Kaider A, Losch A, Gitsch G, Breitenecker G, Kieback DG. (1999) Modified true-color computer-assisted image analysis versus subjective scoring of estrogen receptor expression in breast cancer: a comparison. Anticancer Res 19:2189–2193.
[16] Chantrain CF, DeClerck YA, Groshen S, McNamara G. (2003) Computerized quantification of tissue vascularization using high-resolution slide scanning of whole tumor sections. J Histochem Cytochem 51:151–158.
[17] Ruifrok AC, Katz RL, Johnston DA. (2003) Comparison of quantification of histochemical staining byhue-saturation-int ensity (HSI) transformation and color-deconvolution. Appl Immunohistochem Mol Morphol 11:85–91.
[18] Arzt J, Gregg DA, Clavijo A, Rodriguez L. (2009) Optimization of Immunohistochemical and Fluorescent Antibody Techniques for Localization of Foot-and-Mouth Disease Virus in Animal Tissues Journal of Veterinary Diagnostic Investigation 779-792.
MF, Schubach AO, Santos GP, Nascimento LD, Marzochi MC, Marzochi KB. (2009) Accuracy of an ELISA and indirect immunofluorescence for the laboratory diagnosis of American tegumentary leishmaniasis.Trans R Soc Trop Med Hyg. 103(4):383-9.
[20] Taneja P, Maglic D, Kai F, Zhu S, Kendig RD, Fry EA, and Inoue K (2010) Classical and Novel Prognostic Markers for Breast Cancer and their Clinical Significance. Clin Med Insights Oncol.; 4: 15–34.
[21] Horak CE, Mendoza A, Vega-Valle E, Albaugh M, Graff-Cherry C, McDermott WG, Hua E, Merino MJ, Steinberg SM, Khanna, Steeg PS. (2007) Nm23-H1 suppresses metastasis by inhibiting expression of lysophosphatidic acid receptor EDG2. Cancer Res; 67:11751-11759.
[22] Arriazu R, Durán E, Pozuelo JM, Santamaria L (2013) Expression of lysophosphatidic acid receptor 1 and relation with cell proliferation, apoptosis, and angiogenesison preneoplastic changes induced by cadmium chloride in the rat ventral prostate. PLoS One 8(2): e57742. doi:10.1371/journal.pone.0057742.
[23] Chantrain CF, DeClerck YA, Groshen S, McNamara G
(2013) Computerized quantification of tissue vascularization using highresolution slide scanning of whole tumor sections. J Histochem Cytochem 51:151–158.
[24] Maximova OA, Taffs RE, Pomeroy KL, Piccardo P, Asher DM (2006) Computerized Morphometric Analysis of Pathological Prion Protein Deposition in Scrapie-Infected Hamster Brain.Journal of Histochemistry & Cytochemistry, Volume 54(1): 97–107.
[25] Leong, AS. (2004) Quantitation in immunohistology: fact or fiction? A discussion of variables that influence results. Appl. Immunohistochem. Mol. Morphol. 12, 1–7.
[26] Grube, D. (2004) Constants and variables in immunohistochemistry. Arch. Histol. Cytol. 67, 115–134. [27] Sharangpani, GM., Joshi, AS., Porter, K., Deshpande, AS
(2007). Semi-automated imaging system to quantitate estrogen and progesterone receptor immunoreactivity in human breast cancer. J. Microsc. 226, 244–255.