The 6
thInternational Malaysian Studies Conference (MSC6)
Engaging Malaysian Modernity
50 Years and Beyond
5-7 August 2008 | Crowne Plaza Riverside Hotel, Kuching
Impact of Teaching and Learning Method with
Multimedia Application Aided
Author Ahmad Rizal Madar, Mohamad Zaid Mustafa & Lutfan bin Jaes
Title & Position
Impact of Teaching and Learning Method with Multimedia Application
Aided
Institution UNIVERSITI TUN HUSSEIN ONN MALAYSIA (UTHM)
PRINCIPAL CONVERNOR:
Malaysian Social Science Association (PSSM)
CO-CONVERNER & HOST:
The Faculty of Social Sciences Universiti Malaysia Sarawak (UNIMAS)
CO-CONVERNER:
Impact of Teaching and Learning Method with Multimedia Application Aided
1
Ahmad Rizal Madar,2Mohamad Zaid Mustafa & 3Lutfan bin Jaes 1,2
Jabatan Pendidikan Kejuruteraan
Fakulti Pendidikan Teknikal
Universiti Tun Hussein Onn Malaysia (UTHM)
86400 Parit Raja Batu Pahat Johor
1
[email protected],[email protected]
3
Pusat Pengajian Kemanusian & Komunikasi
Universiti Tun Hussein Onn Malaysia (UTHM)
86400 Parit Raja Batu Pahat Johor
Abstract
This research is comparing the performance of student between control group
which have underwent conventional teaching and learning method and treatment group
which is using graphical animation courseware in teaching and learning method. This is
an experimental type research with design of pre-post test which uses descriptive and
inference statistic to analyze the data. The respondent of this research are junior student
(first year first semester) who are taking the course Diploma of Electrical Engineering in
Polytechnic of Johor Baru (PJB) and Polytechnic of Merlimau Melaka (PMM). 70
respondents are chosen randomly in this research. Coupled t-test is used which results in
null hypothesis are being rejected and accept the alternative hypothesis. Generally, the
findings from this research show that (a) there is a significant difference in enhancing the
learning achievement test between group which s using conventional learning method
and graphical animation courseware. (b) There is a significant difference in enhancing the
learning achievement test among the students who has VT, VR, and VTVR combination
ability in control and treatment group. (c) There is significant interaction effect in terms
Generating System of subject Electrical Technology 1 has an effect on the student
learning process. As a conclusion, graphical animation courseware can enhance the
achievement of VT or VR student totally.
1.0 INTRODUCTION
The usage of the multimedia courseware which has graphic animation as a
teaching tool has been getting attention in our country education system. The
conventional learning environment is not providing the chances for the student to involve
actively in the learning process during the class. Teaching and learning process which use
digital equipment is said to be able to strengthen self confidence, enhance the
communication level and positive altitude on learning. By using the multimedia
courseware in the process of learning, it is hoped that it will attract the interest and
motivate the student (Siti Aishah,et. al., 2004). Therefore, in order to achieve the aim of
the education in Malaysia, the paradigm shift of the way of thinking and using
technology is needed. According to Sahairil Azlan (2003), the usage of multimedia
technology especially the interactive multimedia and animation in the teaching and
learning process is the best alternative in delivering information effectively.
The advance of information and communication technology (ICT) has been
causing huge impact on education. (Jonathan, et. al., 2004) Education has to progress in
concordant with the technology development. The rapid development of the information
technology has caused the usage of computer in all level of education institution starting
from primarily to tertiary education. In conjunction with this, controlling the information
technology in technical field will produce highly skilled and innovative graduates. (Mohd
Zuber, et. al., 2005) One of the new developments in this field is the information
technology. Technology multimedia is able to cause huge and deep effect in education
Visualization or imagination is a technique in creating image, diagram or
animation which is able to communicate with the message (whether in abstract or
concrete idea) that is going to present to user. The ability of visualization encourages an
individual creativity through idea generation and will enable deeper understanding on
certain subject where dimension is used to show certain information. (Knight, 2000)
According to Mohd Daud (2004), visualization is one of the thinking ability which the
capability to imaging the shape and rotate the image in various direction. Visualization
also is said to be an imagination technique which is done by an individual during learning
process.
Through the usage of the multimedia courseware, the quantity of information
which is presented in one period of time can be controlled so that the information is not
over loaded for an individual short term memory capacity. (Jamalludin and Zaidatun,
2003) This shows that every individual has their own capability and is difference among
each person. Thus, the visualization capability for an individual either possesses high
visualization (HV) or low visualization (LV) will influence the learning performance.
2.0 METHODOLOGY
This research is an experimental type research which uses variation of design
between groups that is pre-post test and 2 x 2 (visualization level x group of student)
factorial designs. There are two polytechnic that are involved in this study. Each one of
them represent a group of category that is control group and treatment group respectively
and each category is divided into two level of visualization that is high visualization level
and low visualization level. The visualization level is divided base on the result of the
SVAT test and the group of student is divided according to polytechnic. In order to
investigate the effect of graphic animation as a teaching aided tool in the process of
teaching and learning. The design of this experimental research is chosen by the author
because this is the best design of research in order to compare among the groups. (Chua,
3.0 RESULT
Table 1: Distribution of SVAT test marks for treatment and control groups.
Control group Treatment group
Sex Sex
The marks of
SVAT test (%)
Male Female Total Male Female Total
01 – 50 8 3 11 4 3 7 (LV)
51 – 60 20 4 24 22 6 28 (HV)
Total 28 7 35 26 9 35
There are 35 respondents respectively in both the treatment and control groups as
shown in Table 1. There are 18 or 26% of respondents from both the treatment and
control groups have the LV characteristic. On the other hand, there are 52 or 74% of
[image:5.612.86.527.428.515.2]respondents have the HV characteristic.
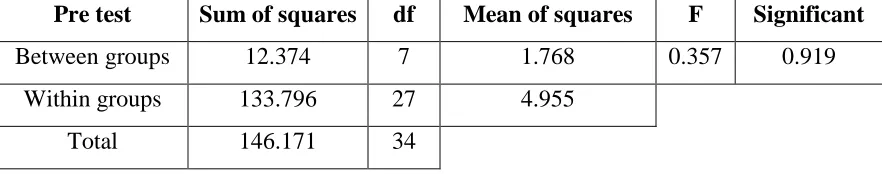
Table 2: the Homogeneity Test of Anova Pre Test Score for the combination of
treatment and control groups.
Pre test Sum of squares df Mean of squares F Significant
Between groups 12.374 7 1.768 0.357 0.919
Within groups 133.796 27 4.955
Total 146.171 34
Table 2 shows the result of the pre test score for homogeneity test for both
treatment and control groups. The single factor ANOVA (Analysis Of Variance) pre test
score for the subject Electrical Technology 1 in the homogeneity test show that there is
no significant difference between the control and treatment group which the significant
value is larger than 0.05 (>0.05). This means that the early knowledge for both groups of
students is the same. Thus, base on this result, it is assumed that the knowledge about the
topic of Generating System in the subject of Electrical Technology 1 for both groups at
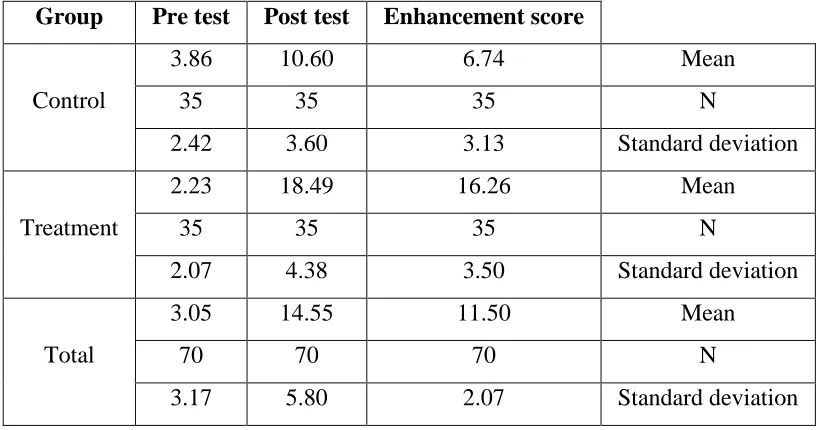
Table 3 : The pre test means score, post test and the enhancement of student
performance for treatment and control group.
Group Pre test Post test Enhancement score
3.86 10.60 6.74 Mean
35 35 35 N
Control
2.42 3.60 3.13 Standard deviation
2.23 18.49 16.26 Mean
35 35 35 N
Treatment
2.07 4.38 3.50 Standard deviation
3.05 14.55 11.50 Mean
70 70 70 N
Total
[image:6.612.83.493.112.331.2]3.17 5.80 2.07 Standard deviation
Table 4 : The result for t-test.
Group N Mean Standard
deviation t df
Significant (2
tailed)
Treatment 35 -6.743 3.128 -12.753 34 0.000
[image:6.612.83.494.113.328.2]Control 35 -16.257 3.501 -27.473 34 0.000
Table 4shows the result of t-test and the level of significant. It is shown that the p
value is smaller than the significant value,α(p=0.00 < 0.05). Thus, the null hypothesis is
rejected and alternative hypothesis is accepted. This means that there is a statistically
significant different in the test mean score for student learning achievement between the
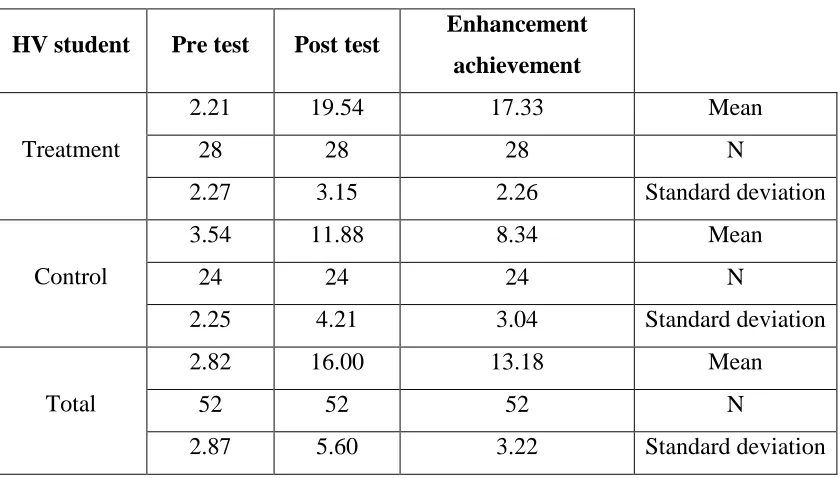
Table 5 : The Pre Test Mean Score, Post Test and enhancement of the HV student
achievement for the treatment and control group.
HV student Pre test Post test Enhancement achievement
2.21 19.54 17.33 Mean
28 28 28 N
Treatment
2.27 3.15 2.26 Standard deviation
3.54 11.88 8.34 Mean
24 24 24 N
Control
2.25 4.21 3.04 Standard deviation
2.82 16.00 13.18 Mean
52 52 52 N
Total
2.87 5.60 3.22 Standard deviation
Table 6 : T-test analysis is carried out on the enhancement of HV student
achievement.
Group N Mean Standard
deviation t df Significant (2 tailed)
Treatment 24 -8.333 2.259 -18.075 23 0.000
Control 28 -17.321 3.044 -30.115 27 0.000
As shown in Table 6, the result of the analysis which uses t-test to determine
whether there is a statistically significant difference between the treatment and control
groups. The result of the analysis shows that the null hypothesis is rejected due to the p
value is smaller than α value (p=0.00<0.05). This means that there is significant
differences in the test mean score of the HV student learning achievement between
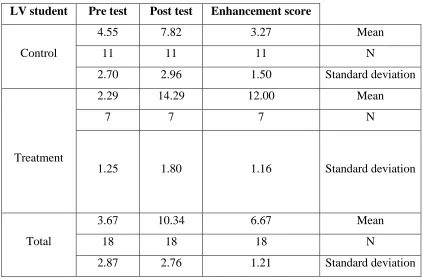
[image:7.612.84.511.479.565.2]Table 7 : The Pre Test Mean Score, Post Test and enhancement of LV student
achievement for the control and treatment group.
LV student Pre test Post test Enhancement score
4.55 7.82 3.27 Mean
11 11 11 N
Control
2.70 2.96 1.50 Standard deviation
2.29 14.29 12.00 Mean
7 7 7 N
Treatment
1.25 1.80 1.16 Standard deviation
3.67 10.34 6.67 Mean
18 18 18 N
Total
[image:8.612.83.506.124.403.2]2.87 2.76 1.21 Standard deviation
Table 8 : T-test analysis is carried out on the enhancement of LV student
achievement.
Group N Mean Standard
deviation t df
Significant
(2 tailed)
Treatment 11 -3.273 1.489 -7.288 10 0.000
[image:8.612.84.453.479.563.2]Control 7 -12.00 1.155 -27.495 6 0.000
Table 8 shows the result of t-Test and level of significant. The analysis shows
that the null hypothesis is rejected as the p value is smaller than the significant value, α
(p=0.000). So, there is statistically significant difference in the test mean score of the
student learning achievement enhancement among the LV student between control and
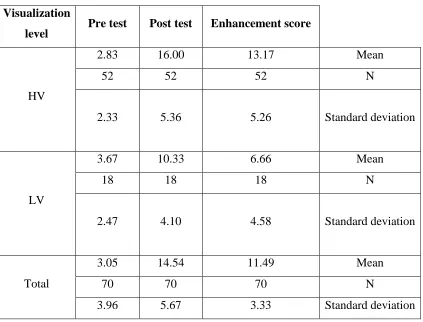
Table 9 : The Pre Test Mean Score, Post test and enhancement of the student
achievement between combination of the HV and LV student.
Visualization
level Pre test Post test Enhancement score
2.83 16.00 13.17 Mean
52 52 52 N
HV
2.33 5.36 5.26 Standard deviation
3.67 10.33 6.66 Mean
18 18 18 N
LV
2.47 4.10 4.58 Standard deviation
3.05 14.54 11.49 Mean
70 70 70 N
Total
3.96 5.67 3.33 Standard deviation
Table 10 : T-test analysis is carried out on the achievement enhancement of the
combination of HV and LV student.
Student N Mean Standard
deviation t df
Significant
(2 tailed)
HV 52 -13.173 5.261 -18.057 51 0.000
LV 18 -6.667 4.576 -6.181 17 0.000
The result of the t-Test and level of significant is as shown in Table 10. The
results of this analysis shows that the null hypothesis is rejected due to p value is smaller
than the significant value,α (p=0.000). Thus, alternative hypothesis is taken and so there
is significant differences in the test mean score of student learning achievement between
[image:9.612.84.453.517.603.2]Table 11 : The result of Pearson Coefficient Correlation Test between the
enhancement of learning achievement for the treatment group student and student
visualization.
Visualization Achievement enhancement
Pearson correlation 1 0.895
Significant level (2 tailed) 0.000 Visualization
N 35 35
Pearson correlation 0.895 1
Significant level (2 tailed) 0.000 Achievement
enhancement
N 35 35
The analysis as shown in Table 11 shows that there is a strong relationship
between the enhancement of the student test score and student visualization with
correlation coefficient, r = 0.895. The correlation coefficient (r) is a value which is used
to measure how strong the relationship between two variables is. So, when the p = 0.000
(p<0.05) shows that the null hypothesis is rejected and alternative hypothesis is accepted.
Thus, there is significant interaction in terms of student achievement with combination of
HV-LV.
Table 12 : The result of Pearson Coefficient Correlation Test between the
enhancement of learning achievement for the control group student and student
visualization.
Visualization Achievement enhancement
Pearson correlation 1 0.911
Significant level (2 tailed) 0.000 Visualization
N 35 35
Pearson correlation 0.911 1
Significant level (2 tailed) 0.000 Achievement
enhancement
[image:10.612.84.548.545.696.2]There is a very strong relationship between the enhancement of the student test
score and the student visualization which the correlation coefficient, r shows the value of
0.911 (Table 12). The value of p = 0.000 (p<0.05) shows that the null hypothesis is
rejected and alternative hypothesis is accepted. There is a significant interaction in terms
[image:11.612.120.496.209.347.2]of student achievement with combination of HV-LV.
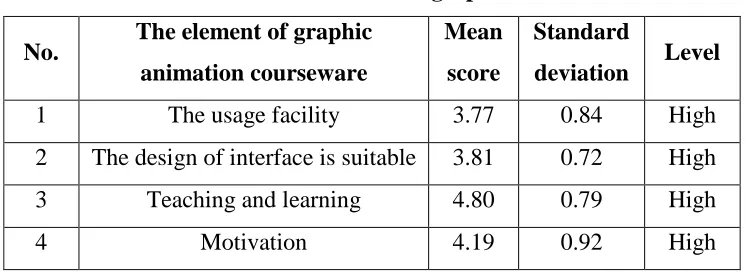
Table 13 : Mean score for the element of graphic animation courseware.
As shown in Table 13, the result of analysis for items in all the element of
graphic animation courseware shows that they are at high level. This means that generally
the students agree that the elements of the graphic animation courseware are at an
effective level and it is important in aiding the teaching process for the Electrical
Technology 1 subject.
4.0 DISCUSSION AND CONCLUSION
The achievement enhancement of the mean score shows that after the teaching
and learning session which use graphic animation courseware in the class, can enhance
the level of understanding on the content of Electrical Technology 1 in the topic of
Generating System. The level of understanding can improve the student learning
achievement. This achievement has proved the result of investigations which are done by
Zol Bahri (2001), Sahairil Azlan (2003) and Eun Mi Yang & Andre (2003). Bandura
(1977) and Gagne (1985) have given the same opinion which is supported Azizi et. al.
(2005) that student who involves in the media aided teaching and learning process show
an improvement in their test performance. Besides that, student with HV is a student who No. The element of graphic
animation courseware
Mean
score
Standard
deviation Level
1 The usage facility 3.77 0.84 High
2 The design of interface is suitable 3.81 0.72 High
3 Teaching and learning 4.80 0.79 High
possess high intelligence and excellent in art class able to give a clear visual during
thinking of something, easy to read diagram, map and graphic, describe the human body
or thing exactly to its origin, can watch movie, slide and picture, enjoy playing jigsaw,
maze or other visual activity. Visual intelligence is one of the aspects from the Multiple
Intelligences which is created by Dr. Howard Gardner, an education professor from
Harvard University in the year 1983. Technical student with visual intelligence usually
possess the characteristics such as like to play puzzle, jigsaw, Lego, maze, stair snake,
block arrangement and others. They like to exploit their toys, dismantle and reconstruct
the toys, like to take picture, possess high imagination and easily remember the position
of a things or a location. Thus, it would be more interested to the HV student if the
learning process is able to satisfy their imagination range which is farther than other
student. That is why they always look like a thinker as they like to spend their time to do
the things as mention above or just day dreaming. The usage of different elements in
courseware is to present a message which will increase the chances of achieving
objectives and aims. For the element of facility usage, the result of this research shows
that the overall mean score for this item is 3.77. This shows that the effectiveness of this
element in the graphic animation courseware is at high level and it is also user friendly to
the student. The results of this research have been supported by the results obtained from
Mohammad Nur Azhar and Baharuddin (2004). In this criterion, students do not face any
References
Aminordin Che Lah dan Fong Soon Fook (2004). “Kesan Grafik Berkomputer Dalam
Pembelajaran Fenomena Cuaca.” Jurnal Pendidik dan Pendidikan. 19. 19 - 31.
Pulau Pinang : Penerbit Universiti Sains Malaysia.
Azizi Yahaya, Asmah Suboh, Zurihanmi Zakariya, dan Fawziah Yahya (2005). “Aplikasi
Kognitif Dalam Pendidikan”. Edisi pertama. Pahang: PTS Professional. 80-91.
Baharuddin Aris, Mohammad Bilal Ali Jamalludin Harun, dan Zaidatun Tasir (2001).
“Sistem Komputer dan Aplikasinya”. Edisi pertama. Kuala Lumpur: Venton
Publishing. 25 1-253.
Bontempi, E. dan Hazlewood, L. W. (2003). “Factors in Effective Computer Assisted
Instruction.” Capaian maklumat pada Februari 15, 2007 dari
http://www.xplanazine.com/archives/2003/11/factors_in_effec.php
Bordens, K.S. dan Abbott, B. B. (2002). “Research Design and Methods”. Edisi keempat.
Australia: Longman. 559.
Bosco, J. (1986). “An Analysis of Evaluation of Interactive Video”. Educational
Technology, 25, 7-16.
Canino, C. dan Cicchelli, T. (1988). “Cognitive Styles, Computerized Treatments on
Mathematics Achievement and Reaction to Treatment.” Journal of Educational
Computing Research.4. 253 - 264.
Cano, J. dan Metzger, S. (1995). “The Relationship Between Learning Styles and Levels
of Cognition of Instruction of Horticulture Teachers.” Journal of Agriculture
Capaian maklumat pada September 2, 2006 http://evolution.massey.ac.nzilect 1 8/lect
800.htm.
Capaian maklumat pada Ogos 10, 2007 dari
http://evalution.massey.ac.nz/lect18/lect1800.htm
Carpenter, P. A. dan Just, M. A. (1992). “Understanding Mechanical System Through
Computer Animation and Kinematics Imagery.” Dalam Safuan Haji Rabaai dan
Fong, S. K. (2003). “Kesan Animasi Berasaskan Komputer Terhadap
Pembelajaran Bahasa Melayu.”Malaysian Journal of Education Technology.3(2).
17 - 24.
Ch. Raja Sekhar (2001). “Design of Courseware for E-Learning.”Capaian maklumat pada
September 11, 2007 dari http://www.cdac.in/html/pf/session4.3.pdf
Chen, S. Y., Magoulas, G. D., dan Dimakopoulos, D. (2005). “A Flexible Interface
Design for Web Directories to Accommodate Different Cognitive Styles.”
Journal of The American Society for Information Science and Technology.56(1).
70 - 83.
Ching Chun Shih dan Gamon, J. A. (2002). “Relationships Among Learning Strategies,
Patterns, Styles, and Achievement in Web Based Courses”. Journal ofAgricultural
Education, 43(4).
Chua Yan Piaw (2006a). “Kaedah Penyelidikan.” Kuala Lumpur: McGraw Hill
(Malaysia) Sdn. Bhd.
Cockcroff, W. H. (1986). “Mathemathics Count”. London: HMSO.
Connell, W.F. (1961). “The Foundation of Educatiom.” Sydney: Ian Novak Publisher.
Dunn, R. dan Griggs, S. (1990). “Research on the Learning Style Characteristics of
Selected Racial and Ethnic Groups, Reading, Writing, and Learning Disabilities.”
6. 261 - 280.
Ee, Ah Meng (2002). “Pedagogi IV.” Edisi kedua. Kuala Lumpur: Penerbit Fajar Bakti
Sdn Bhd.
Eun-Mi Yang dan Andre, T. (2003). “Spatial Ability and The Impact of
Visualization/Animation on Learning Electrochemistry.” Journal of Science
Education.25. 329 - 349.
Faharol Razi Bin Shaari (2002). “Psikologi Kognitif Dalam Pembinaan Bahan
Pengajaran Pembelajaran Berbantukan Komputer.”
Gagne, R. M. (1985). “The Conditions of Learning.” Edisi keempat. New York: Holt
Rinehart dan Winston.
Guilford, J. P. (1982). “Cognitive Psychology’s Ambiguities: Some Suggested Remedies.
Psychological Review.”89. 48 - 59.
Hsu, T. E., et al. (1994). “Effects of Learner Cognitive Styles and Metacognitive Tools
on Information Acquisition Paths and Learning in Hyperspace
Environments.”Capaian maklumat pada Februari 14, 2007, dari
http://home.alltel.net/vogannod/THESIS.html
Jamalludin dan Zaidatun (2000). “Pengenalan Kepada Multimedia”. Kuala Lumpur:
Jamalludin Harun, Baharuddin Aris, dan Zaidatun Tasir (2003). “Pembangunan Perisian
Multimedia.” Selangor: Venton Publishing (M) Sdn. Bhd.
Jonathan Sidi, Syahrul Nizam Junaini, dan Malijon Malajad (2004). “E-Enjin:
Penggunaan Animasi Interaktif Online Untuk Pengajaran dan Pembelajaran
Sistem Enjin Kemahiran Hidup Tingkatan 3 (Kajian Kes Sekolah Menengah Luar
Bandar di Sabah).”
Kamarudin Haji Husin, dan Siti Hajar Haji Abdul Aziz, (2003). “Pedagogi Untuk Asas
Pendidikan.” Edisi pertama. Kuala Lumpur: Kumpulan Budiman Sdn. Bhd. 128
-130.
Kamus Dewan Bahasa dan Pustaka (1994). Edisi ketiga. Kuala Lumpur: Dewan Bahasa
dan Pustaka.
Kappe, F., Maurer, H., dan Sherbakov, N. (1993). “Hyper-G: A Universal Hypermedia
System”. Journal of Educational Multimedia and Hypermedia, 2(1), 36-66.
Kementerian Pengajian Tinggi (2007). Capaian maklumat September 16, 2007 dari
http://www.mohe.gov.my
Knight, C. (2000). “System and Software Visualization”. UK: World Sci2ntific
Publishing Company.
Krejeie, R. V. dan Morgan, D. W. (1970). “Determining Sampel Size For Research,
Educational and Psychological Measurement.”30. 607 – 610.
Mayer, R. E. (2001). “Multimedia Learning.” United Kingdom: Cambridge University
Mayer, R. E. dan Anderson, R. B. (1991). “Animations Need Narrations: An
Experimental Test of Dual Coding Hypothesis.” Journal of Educational
Psychology.83(4). 484 - 490.
McGee, M. G. (1979). “Human Spatial Abilities: Sources of Sex Differences.” New York:
Praeger. Capaian maklumat pada September 2, 2007
http://evolution.massey.ac.nz/lect18/lect1800.htm.
McGee, M. G. (1979). “Human Spatial.Abilities: Sources of Sex Differences”. New York:
Praeger.
Messick, (1976). “Individuality and Learning”. San Francisco, California: Jossey¬Bass
Inc.
Mohamad Najib Abdul Ghafar (1999). “Penyelidikan Pendidikan.” Skudai: Universiti
Teknologi Malaysia.
.Mohd Majid Konting (2000). “Kaedah Penyelidikan Dalam Pendidikan”. Kuala Lumpur:
Dewan Bahasa dan Pustaka.
Mohd Najib Abdul Ghafar (2003). “Reka bentuk Tinjauan Soal Selidik Pendidikan.”
Skudai: Universiti Teknologi Malaysia.
Mohd Najib Ghafar (2001). “Pembinaan dan Analisis Ujian Bilik Darjah.” Skudai:
Universiti Teknologi Malaysia.
Mohd Zuber Zain, Abdul Halim Ali, dan Raja Ahmad Shalaby (2005). “Pak Lah dan
Pendidikan.” Edisi pertama. Tanjong Malim: Penerbit Universiti Pendidikan
Sultan Idris. Munir dan Halimah Badioze Zaman (1999). “Aplikasi Multimedia
Dalam Pendidikan.” Jurnal Bahagian Teknologi Pendidikan. Kuala Lumpur:
Mok Soon Sang (1994). “Penilaian, Pemulihan, dan Pengayaan dalam Pendidikan.”
Kuala Lumpur: Kumpulan Budiman Sdn. Bhd.
.
Nin Hayati Binti Mohd Yusof (2005). “Keperluan Pembelajaran Berbantu Multimedia
Bagi Subjek Sistem Elektronik 1 di Politeknik Malaysia.”Kolej Universiti
Teknologi Tun Hussein Onn: Tesis Sarjana.
Noordin Yahaya, Azizi Yahaya, dan Zurihanmi Zakariya (2005). “Psikologi Kognitif”.
Edisi Pertama. Skudai: Universiti Teknologi Malaysia. 122 - 134.
Norizan Binti Esa (2002). ”Kesan Modul-modul Multimedia Berasaskan Komputer Yang
Mempunyai Beban Kognitif Berbeza ke Atas Pencapaian Konsep-konsep Konkrit
Dalam Biologi.” Universiti Sains Malaysia: Tesis Ijazah Sarjana Doktor Falsafah
(Ph.D).
Olstad, Juarez, Davenport. dan Haury (1981). Capaian maklumat pada Ogos 10, 2007
dari http://evalution.massey.ac.nz/Iectl 8/lecti 800.htm
Paivio, A. dan Clark, J. M. (1991). Dual Coding Theory and Education. Educational
Psychology Review, 3(3), 149-170.
Sahairil Azlan Sahidun (2003). “Penggunaan Animasi Melalui Multimedia lnteraktif
Dalam Pengajaran dan Pembelajaran Matapelajaran Elektrik dan Elektronik”.
Kolej Universiti Teknologi Tun Hussein Onn: Tesis Sarjana.
Saracho, 0. N. dan Spondek, B. (1981), “Teacher’s Cognitive Styles and Their
Educational Implications”. Educational Forum, 45(2), 1553-1559. Capalan
maklumat pada Febuari 26, 2007 dari
Saracho, O. N. (2002). “Matching Teacher’s and Student’s Cognitive Styles.” EarlyChild
Development and Care.173(2). 161 - 173.
Saracho, O. N. dan Spondek, B. (1981), “Teacher’s Cognitive Styles and Their
Educational Implications.” Educational Forum. 45(2). 1553-1559. Capaian
maklumat pada Julai 26, 2007 dari
http://web10.epnet.com/externalframe.asp?html
Schwier, R. (1995). Dalam Stoney, S. dan Wild, M. “Designing Interfaces For
Instructional Multimedia With Motivational in Mind.” Proceedings International
Conference on Computers in Education (ICCE). 2 – 6 Disember 1997. Kuching,
Sarawak, Malaysia.
Sekaran, U. (2003). “Research Methods for Business: A Skill Building Approach.” Edisi
keempat. Singapore: John Wiley & Sons (Asia) Pte. Ltd.
Sexton, J. dan Raven, M. (1999). “The Relationship Between Thinking Styles. Field
Dependence and Independence, and Student Performance on Selected Thinking
Exerciss in an Undergraduate Agricultura Course”. Proceedings of the 26th
Annual National Agricultural Education Research Conference. 561-587
Shahabuddin Hashim dan Rohizani Yaakub (2003). “Psikologi Pembelajaran dan
Personaliti.” Edisi Pertama. Pahang: PTS Publications & Distributor Sdn. Bhd.
Sherry Chen (2005). “A Flexible Interface Design for Web Directories to Accommodate
Different Cognitive Styles”. Journal of The American Society for Information