Digital Camera Nikon D300 in Support of High Mountain
Studies in the Langtang Valley, Central Himalaya, Nepal
Viktor Kaufmann
1,*, Markus Dorn
1, Gian-Philipp Patri
1, Stefan Reimond
1, Wolfgang Sulzer
21Institute of Remote Sensing and Photogrammetry, Graz University of Technology, Graz, 8010, Austria 2Department of Geography and Regional Science, University of Graz, Graz, 8010, Austria
*Corresponding Author: [email protected]
Copyright © 2013 Horizon Research Publishing All rights reserved.
Abstract
This paper describes two different mapping projects in the upper Langtang Valley, Central Himalaya, Nepal, applying close-range photogrammetry using a non-metric consumer-grade digital camera Nikon D300. Data acquisition (terrestrial photographs, and additional handheld GPS and laser distance measurements) was carried out during a field campaign in April 2010. The first mapping project aimed to document the present extent of the glacier tongue of Kyimoshung Glacier, Langtang Himal, and to compare this glacial stage with an earlier one (1992). The second mapping project intended to produce a large-scale map of Kyanjin Gompa for socio-economic studies. Kyanjin Gompa is a small settlement with a fast growing tourism infrastructure. Photogrammetric work was supported by commercial software, such as ImageStation of Intergraph and/or PhotoModeler. The results obtained are presented graphically using maps and numerically.Keywords
Close-range photogrammetry, digital camera Nikon D300, glacier mapping, settlement mapping, Kyimoshung Glacier, Kyanjin Gompa, Langtang Valley, Central Himalaya, Nepal1. Introduction
High mountain research heavily relies on accurate and up-to-date topographic data/information, but data acquisition (area-based, point-based) in remote mountainous areas is still a challenge. The main methods of data acquisition are based either on remote sensing (in the strict sense, airborne and space-borne techniques) or in-situ measurements, such as close-range photogrammetry, terrestrial laser scanning, and geodetic methods (GPS/GNSS, tacheometry). The application of remote sensing techniques is outlined, for example, in [1] and [2]. Geodetic methods and close-range photogrammetry principles are addressed in [3].
Field work in remote mountainous areas is often hampered by costly and also bulky equipment/instrumentation, which often causes additional personnel costs. In this paper we
propose the application of terrestrial photogrammetry using consumer-grade, i.e. low-cost, digital cameras for local studies, e.g. monitoring of landslides, glacier tongues, rock faces, and other (man-made) surface features. Data acquisition is comparatively easy, fast, and also inexpensive. Data analysis and information extraction are typically carried out in the office at a later stage.
The Langtang Valley, Nepal, has been the focus of longstanding research by both Graz University of Technology and the University of Graz [4,5]. In April 2010, Wolfgang Sulzer and the first author carried out further field studies in the Langtang Valley. This work was accomplished in co-operation with the Institute of Geography, Tribhuvan University, Kathmandu, Nepal, and financially supported by the Austrian Eurasia-Pacific Uninet [6].
This paper deals with the acquisition of up-to-date topographic information in order to answer research questions related to (1) glacial studies (impact of atmospheric warming on Kyimoshung Glacier) and (2) socio-economic studies (impact of tourism on the settlement of Kyanjin Gompa).
2. Description of the Study Sites
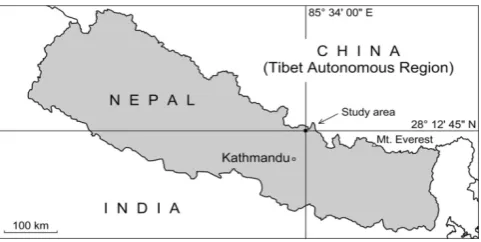
[image:1.595.314.555.622.743.2]The two study sites covered in this paper are located in the upper Langtang Valley in the Langtang Himal, central Nepal (Figure 1). Langtang Himal belongs to the Central Himalaya and is situated in the border area between Nepal and China (Tibet).
The area of interest is also part of the Langtang National Park, which was founded in 1976. Its scenic beauty and its relatively easy access (60 km north of Kathmandu) attract many tourists (mountain trekkers) every year. The topographic and natural setting of the two study sites is best shown in aerial views (Figures 2 and 3). Langtang Khola (River) shown in Figure 2 drains into Trishuli River, which is a tributary of the Gandaki River, one of the major rivers of Nepal and tributary of the Ganges.
Figure 2. Aerial photograph (1992) showing the surroundings of
Kyimoshung Glacier and Kyanjin Gompa. Aerial photograph © Survey Department, Kathmandu, Nepal
Figure 3. Aerial photograph (1975, Hasselblad camera) taken by Erwin
Schneider. Viewing direction towards Langtang Himal, border area between Nepal and China (Tibet). Source: Photo archive of Robert Kostka, TU Graz
2.1. Kyimoshung Glacier
The Langtang Himal peaks of Langtang Lirung (7227 m), Tsangbu Ri (6760 m), and Dragpoche (6562 m) shape the impressive mountain ridge north of Kyanjin Gompa (Figure 2). The three main glaciers south of this ridge are Eastern Langtang Lirung Glacier, Kyimoshung Glacier, and Yala Glacier. The glaciers are located in the Trishuli Sub-Basin, which belongs to the Gandaki Basin (glacier inventory by [7]). Kyimoshung and Yala Glaciers are debris-free (white or clean) glaciers, whereas Lirung Glacier is heavily debris-covered throughout its long glacier tongue. Lirung and Yala glaciers have been studied quite extensively in the past, whereas little emphasis was put on Kyimoshung Glacier. Kyimoshung Glacier (area of 4.23 km2 in 1992) is a
valley glacier consisting of a larger upper part (mostly accumulation area, orientation NW-SE) confined by mountain ridges, and a smaller lower part (ablation area, 0.84 km2 below 4900 m) which flows through a narrow section of
the hosting valley. The spectacular glacier tongue (south orientation, mean steepness of 32°) shows an irregular surface with icefalls and seracs. The lower end of the present glacier tongue is embedded in the confining lateral moraines of an earlier glacial stage (Yala I & II as described in [8] and [9]). This glacial stage can be related to the Little Ice Age (last maximum glacial extent at around 1850 in Europe).
In 2012, a discussion was launched about the retreat or even growth of glaciers in the Hindu Kush Karakorum Himalaya (HKKH) region. It has been reported that glaciers in the Karakorum area are partly growing [10,11].
In the present study Kyimoshung Glacier was selected to study glacier change in the Langtang area based on independent sources. Recently published glacier retreat for the Greater Himalayan region gives reason to expect that Kyimoshung Glacier has retreated too [7,11].
2.2. Kyanjin Gompa
Kyanjin Gompa (3870 m) is a small settlement situated on a small prominent terrace on the orographic right side of Langtang Khola. Kyanjin Gompa (Monastery) is a Buddhist sanctuary. In the course of time this summer pasture (yak grazing) settlement has turned increasingly into a tourist destination with many hostels, lodges and shops. At Kyanjin Gompa there is a well-known cheese factory. At the moment there is an oversupply of tourist beds, which is causing problems for the various accommodation providers. This specific socio-economic situation is being studied, for example, by human geographers. To date, however, there is no large-scale settlement map providing a sound basis for spatial-temporal analyses of the development of Kyanjin Gompa (cp. [5]).
[image:2.595.58.300.478.719.2]3. Previous Work
The catchment area of Langtang Khola has been the focus of a large number of studies, resulting in extensive literature. Cartographic base maps covering the area of interest are limited to two adjacent 1:50,000 maps of the Austrian Alpine Club (1990) and the Nepalese topographic map (of 1992) mentioned above. For more information see [4,12,13].
3.1. Kyimoshung Glacier
Airborne and terrestrial photographs have been acquired during different missions (governmental, research, private) using metric, semi-metric and non-metric cameras. A (first) glacier inventory of the Langtang area was compiled by [14], which also includes an oblique aerial photograph of Kyimoshung Glacier of 1991. Other photo documents of their database are from 1981 (aerial) and 1990-1991 (terrestrial).
Kappenberger et al. [15] were the first to quantify glacier change at Kyimoshung Glacier using terrestrial photogrammetry. Terrestrial photographs of three glacial stages, i.e. 1980, 1984, and 1991, were digitally overlayed by means of projective transformation based on visible landmarks. The comparison of the glacier termini showed that no significant changes in position had occurred between 1980 and 1991, and Kyimoshung Glacier was thus classified as stationary.
The database of the World Glacier Monitoring Service (WGMS) lists three different glaciers of the Langtang National Park, i.e. Langtang Glacier, Lirung Glacier, and Yala Glacier. Kyimoshung Glacier is not included. However, the mean annual change in ice thickness of Yala Glacier for the time period 1994-2009 confirms strong ice melt and can be used to validate results obtained for Kyimoshung Glacier ([16]; cp. with [17] and [18]).
The interested reader is referred, for example, to [19] for a more detailed documentation of Lirung Glacier. A mean (1988-2000) temperature rise of 0.27°C/year was measured at the meteorological station at Kyanjin Gompa ([20: 20]). Extensive glacial studies based on satellite image data have been carried out by different universities, as well as governmental and non-governmental agencies in the Langtang region [7,11]. Another source of information on Kyimoshung Glacier is [21].
3.2. Kyanjin Gompa
The structural development of Kyanjin Gompa due to tourism has been studied, for example, by [5] based on field surveys (1988, 1992, and 2006). Building counts and additional panoramic photographs of the settlement confirm rapid growth. A detailed large-scale map of the settlement was not available to support a more quantitative (spatial-temporal) analysis as anticipated by the human geographer. A first large-scale map of Kyanjin Gompa and
its surroundings was produced by [22,23]. Aerial photographs taken by E. Schneider in 1983 with a non-metric Hasselblad camera equipped with a fisheye lens (f = 30 mm) were evaluated photogrammetrically using an analytical plotter. This 1:10,000 scale map shows 10 buildings for the settlement area, but was actually generated for the purpose of vegetation mapping. In 1992, aerial photographs were acquired by the Survey Department of Nepal [13]. Due to the small image scale and fresh snow cover, however, the area of interest is not depicted very well. In 2008, the two virtual globes, i.e. Google Maps and Microsoft Virtual Earth/Bing Maps, had not yet provided high-resolution image data for the area of interest and we did not have access to other sources of high-resolution satellite imagery at the time of investigation (2010).
3.3. Close-range Photogrammetry Using Consumer-grade Cameras
Off-the-shelf digital cameras are being used increasingly in close-range photogrammetric projects and can provide valuable support in monitoring tasks in mountainous areas. Some monitoring applications focusing on landslides, glaciers and rock glaciers are highlighted in [24]. Accurate camera calibration is a prerequisite for successful projects [25,26].
4. Data Acquisition
Field data acquisition was done in a joint research project of Graz University of Technology and the University of Graz in April 2010. It included terrestrial photography (Nikon D300), handheld GPS measurements using a Garmin GPSMAP 60CSx (differential GPS could not be used due to technical problems), distance measurements using a Leica handheld laser distometer, and measurements using a BREITHAUPT optical hand clinometer (this data was not used in the evaluation process).
Aerial photographs (Eastern Nepal Topographic Mapping Project 1992, image scale 1:60,000) of the Langtang Valley were made available through the Survey Department, Kathmandu, Nepal.
4.1. Nikon D300
Figure 4. Consumer-grade digital camera Nikon D300 with a 50mm lens attached
4.2. Kyimoshung Glacier
[image:4.595.61.297.77.247.2]Terrestrial photographs (50mm lens only) of Kyimoshung Glacier were taken on April 14 and 17, 2010 from 6 different positions at the orographic right lateral moraine of Lirung Glacier at a mean elevation of 4010 m (see Figures 5 and 6). GPS measurements were recorded, and selected slant range distances between the positions were measured. The clinometer was used to additionally measure vertical angles between selected positions and from specific positions to a few benchmarks in the surroundings of the glacier. At the time of data acquisition the authors did not know about the availability of aerial photographs, which then substantially facilitated absolute orientation of the terrestrial photographs.
Figure 5. Terrestrial photograph (April 17, 2010) of the glacier tongue of
[image:4.595.59.298.464.642.2]Kyimoshung Glacier taken with a digital camera Nikon D300 (50mm lens). Position of photographer (V. Kaufmann) is on the right lateral moraine of Lirung Glacier (at 4030 m). Lateral moraines of an older glacial stage (LIA) can be seen in the foreground
Figure 6. Clip of the topographical map 1:50,000 (sheet number 2885 15)
showing the study area with Kyimoshung Glacier and Kyanjin Gompa. Compare with Figure 2. The photogrammetric baseline (1-5) for mapping Kyimoshung Glacier was added graphically. Map © Survey Department, Kathmandu, Nepal
4.3. Kyanjin Gompa
The majority of the terrestrial photographs of Kyanjing Gompa were taken when ascending and descending Phushung Peak (4329 m) (see Figure 7). Additional photographs were taken from other viewing directions when strolling around the settlement. The photographs were not geo-referenced using GPS. However, the coordinates of 27 control points, i.e. corner points of selected buildings and roofs, and other prominent landmarks, were measured using a handheld GPS unit. Unfortunately, the differential GPS (DGPS) measurements did not work well, and thus the coordinates obtained have only standard positioning accuracy.
Figure 7. Terrestrial panoramic photograph (April 15, 2010) of Kyanjin
[image:4.595.314.553.555.641.2]5. Photogrammetric Mapping
The photogrammetric evaluation of the terrestrial photographs differed between the two mapping tasks. In both cases, however, the evaluation was done using pre-processed image data, which had already proved beneficial in previous projects [27]. In a first step, the RAW format photographs were converted to 8bit TIFF. The images obtained were subsequently rectified using available camera calibration parameters to form perfect central-perspective images (principal point in the image center, square pixels, no radial image distortion). The main processing steps and results are presented and discussed in the following text.
5.1. Kyimoshung Glacier
Four black-and-white transparencies of the 1992 aerial project covering the area of interest were scanned at 15 µm. Bundle adjustment was carried out on a photogrammetric workstation of Intergraph. Absolute orientation is based on 11 control points measured in the topographic map. In order to map and document the 1992 glacial stage of Kyimoshung Glacier, a high resolution digital elevation model (DEM) was generated with a grid spacing of 10 m. A high resolution orthophoto with a ground sampling distance (GSD) of 0.5 m was produced. The boundary of Kyimoshung Glacier was mapped interactively using Intergraph and Microstation software. Subsequently, an orthophoto map (Figure 8) was produced as a reference for the present glacier change study. Height accuracy is better than ±9 m. RMS errors (for the control points) in X and Y are also in the same order.
Prior to the evaluation of the terrestrial photographs, the relative geometry of the various baselines was reconstructed by means of bundle adjustment using PhotoModeler software. Scale was deduced from the distance measurements. GPS measurements were not considered in the orientation process due to low accuracy. Limited cloud cover and a good base-to-distance ratio were the criteria for selecting a single stereopair (positions 1 & 5, see Figure 6) for further stereo mapping on the Intergraph workstation. In fact, stereo mapping using PhotoModeler’s scanner functionality failed since dense automatic image matching provided an insufficient number (60) of surface points. PhotoModeler provides neither stereo viewing nor interactive stereo measurements.
At this stage, the potential photogrammetric mapping accuracies could already be quantified. The effective baseline amounts to 235 m, the mean distance to the object (glacier) is 3000 m, which results in a base-to-distance ratio of 0.078. We calculated the mapping accuracy using standard formulas (normal case) of photogrammetry: assuming 1 pixel measurement accuracy for image coordinates and parallaxes, accuracies of mx,y = ±0.33 m
(parallel to the image plane) and mz = ±4.2 m (in viewing
direction) can be expected. These accuracies obtained for the model coordinate system can be transferred to UTM mapping geometry. Assuming a mean slope of 32° for Kyimoshung Glacier, 3D coordinate accuracies mX,Y,Z are
calculated at better than ±3 m for a mean camera-to-object distance.
Finally, the photogrammetric evaluation of the stereopair was carried out on the Intergraph photogrammetric workstation. A total of 16 stable surface points were identified in both data sets of 1992 and 2010 for the absolute orientation of the terrestrial stereomodel. Bundle adjustment was performed using homologous points and control points, with their coordinates extracted from the 1992 aerial photographs. RMS errors obtained for the control points were better than ±9 m, which basically reflects the accuracy of the reference coordinate system. Thus, the expected horizontal and vertical absolute accuracies for the photogrammetric mapping of the glacier are of the same order of magnitude.
Automatic digital elevation extraction from the 2010 stereopair also failed on the Intergraph workstation. Furthermore, the simulation of an aerial overflight geometry by means of an appropriate coordinate transformation proved unsuccessful. A point grid with a spacing of 10 m was captured manually in specific parts (defined by collection boundaries) using Intergraph's ISDC software. This interactive work proved to be relatively tedious, but it was successful. All data was triangulated to form a TIN, which provided the basis for the generation of a regular grid (DEM) with a grid spacing of 10 m (same spacing as for 1992). Some areas that were occluded due to the viewing geometry were outlined using polygons. Accuracy assessment of the DEM was carried out in two ways: (1) stereoscopic superimposition of DEM data (point data or contour lines) of the respective other epoch, and (2) DEM differencing. Stable areas, e.g. gentle slopes E and W of the glacier, were analyzed. RMS errors (including probable systematic effects) are in the range of ±10 m, which is in accordance with the height accuracies discussed previously. The glacier extent of 2010 was traced manually. Since the right (W) and left (E) parts of the glacier terminus are strongly debris-covered (cp. Figure 5), the exact delineation of the glacier limits was not always possible. Glacier change in the period 1992-2010 was numerically quantified stating mean glacier length change and mean change of ice thickness; the latter is also shown graphically in a thematic map.
5.2. Kyanjin Gompa
It was decided to solve the task of mapping Kyanjing Gompa using the commercial software PhotoModeler only. The primary goal was to produce a large-scale map showing all buildings and other man-made structures of the settlement and to associate names/usage to these buildings.
interest. At this stage the reconstruction was still relative. The model obtained has arbitrary scale, is not leveled, and has no explicit map coordinate reference. We therefore wanted to use high-accurate DGPS measurements to georeference the stereomodel. The data of the GPS base station was lost, however, due to technical problems. As a result, the accuracy of the single receiver solution (standard GPS positioning) is limited and restricted to ±10 m in planimetry and ±10-30 m in altitude [3: 179]. Finally, WGS84 coordinates of all points were converted to UTM-45N coordinates. Unfortunately, PhotoModeler could not properly handle such low-accuracy control points, and bundle adjustments did not converge. Another attempt at proper scaling and leveling of the model was to exploit geometric constraints, such as measured distances and verticality/horizontality of buildings. This attempt was not successful either, since the overall model geometry obtained was systematically deformed. Finally, it was decided to select three well-distributed GPS points for geo-referencing.
PhotoModeler’s bundle adjustment resulted in an overall RMS error of 0.8 pixel (maximum value 2.4). The precision obtained is high, however, systematic model deformation can be expected without external (geometric) control. Self-calibration showed only a small improvement in precision. After conformal transformation of the initial stereomodel, we calculated the displacement vectors of all GPS points with respect to the final model. The vector field obtained shows local systematic effects which cannot be explained.
Two efforts were made to judge the absolute mapping accuracy of the final result. (1) A comparison with the 1992 model (see above) had to be dismissed because of snow cover, low contrast, and an insufficient number of identical buildings. (2) At the time of writing this paper (2013) Microsoft Bing Maps already provided high resolution image data (DigitalGlobe) for the area of interest. A screen shot of the image data (0.5 m GSD) was used as a reference (Mercator projection) for accuracy assessment of the final map. Thirteen common points were measured in the Kyanjin Gompa map and in the image (orthophoto) of Microsoft Bing Maps. An affine coordinate transformation was needed to model the geometric difference between the two products. The precision is quite high and amounts to ±1.5 m in X and ±2.3 m in Y. As expected from the systematic behavior (rotation-like displacement) of the map against the GPS-based UTM system, the final map is indeed rotated by 5.7° (mean of both axes) against the north direction.
A total of 33 distinct gable points of various large buildings of Kyanjin Gompa were measured within the PhotoModeler environment to serve as a reference for further work.
6. Results
6.1. Kyimoshung Glacier
A comparison of the two glacial stages of 1992 and 2010
[image:6.595.313.552.345.669.2](time span of 18 years) clearly indicates a recession of the glacier terminus, while Kappenberger et al. [15] had classified Kyimoshung Glacier as stationary for a previous time period, 1980-1991 (see Figure 8). This Figure also outlines the maximum glacial extent of the last cold period (Little Ice Age), which ended here around 1910 [9]. Mean length changes amount to -480 m for LIA maximum extent to 1992, and -160 m for 1992 to 2010. Ice thickness has decreased at a mean rate of -1.7 m/year for the time period 1992-2010, measured at the position of the 2010 glacier terminus. Surface lowering (between 30 and 10 m) was measured in the lower part of the glacier snout. Surface rising was also observed in two small areas in the middle and upper reaches, which is mainly due to topography and ice dynamics. However, large areas of the glaciated area display no significant change of ice thickness, i.e. change is within the error level of ±10 m. The vertical shift of the glacier terminus is approximately +93 m. The glacier retreat observed at Kyimoshung Glacier for the time period 1992-2010 compares very well with findings shown in other studies, e.g. [7: 454-455] and [28, paper & supporting information).
Figure 8. Orthophoto map of Kyimoshung Glacier, Langtang Himal,
Nepal. Orthophoto and contour lines refer to the glacial stage of 1992. Glacial stages of the Little Ice Age (LIA) and 2010 are outlined. Aerial photograph © Survey Department, Kathmandu, Nepal
6.2. Kyanjin Gompa
topographic features were extracted in PhotoModeler and exported in DXF format. The final layout of the Kyanjin Gompa map was made using SURFER from Golden Software (Figure 9). The index of buildings comprises 23 entries. The small misalignment of the map with respect to the north direction is indicated by the north arrow. This map can be seen as a good cartographic basis for further studies in
[image:7.595.180.432.170.421.2]human geography. Older terrestrial photographs, e.g. from 1988 and 2006 as shown in [5], and other sources, e.g. maps, should make it feasible to identify old/new buildings and subsequently reconstruct the expansion of the settlement over the course of time, taking special account of the influence of tourism and general economic conditions.
Figure 9. Line map of Kyanjin Gompa, Langtang Valley, Nepal. Numbers (1-23) indicate various buildings of different usage. Map data is derived from
terrestrial photographs only. Map © Institute of Remote Sensing and Photogrammetry, TU Graz
Figure 10. Orthophoto map of Kyanjin Gompa. Map geometry is the same as in Figure 9. Numbers (1-23) indicate various buildings of different usage.
[image:7.595.183.430.458.703.2]7. Conclusions
In this paper we successfully demonstrated that 3D data acquisition using a low-cost digital consumer camera, such as a Nikon D300, is feasible in remote and mountainous environments. The procedures outlined can provide geometrically concise topographic information. Since photogrammetry is only a relative measurement technique, some external information (geometry) is always needed for proper absolute orientation of the photogrammetric models reconstructed. Available sources (maps, etc.) or point measurements using differential GPS/GNSS techniques, which can be carried out relatively easily during field work and photo acquisition, provide an efficient and cost-effective means of georeferencing.
Acknowledgements
The first author would like to express special thanks to his colleague Robert Kostka, TU Graz, for providing detailed information about previous mapping projects in the Langtang area and continuous discussion. Wolfgang Sulzer, Institute of Geography and Regional Planning, UNI Graz, was a member of the field campaign and carried out essential measurements (GPS, distances) for the present study. He also helped to finalize the settlement map. The authors are grateful to Dhananjay Regmi, Himalayan Research Expedition (P) Ltd., who was the local organizer of the field campaign to the Langtang area in 2010. Regmi also helped to obtain copies of the 1992 aerial photographs from the Survey Department, Kathmandu, Nepal. Tobias Bolch, Department of Geography, University of Zurich, and Samjwal Bajracharya, ICIMOD, Kathmandu, are thanked for providing collateral information. The field campaign 2010 was partly financed by Eurasia-Pacific Uninet, Salzburg, Austria.
REFERENCES
[1] M.F. Buchroithner. Spaceborne stereo-photography for mapping of high mountain terrain, IAPRS, Kyoto, Japan, Vol. XXVII, Part B2, 481-490, 1988
[2] W. Sulzer. Remote sensing technologies and applications for monitoring high mountain environments, Journal of Aeronautics and Space Technologies, Vol.6, No.1, 19-29, 2013
[3] B. Hofmann-Wellenhof, K. Legat, M. Wieser. Navgation – Principles of Positioning and Guidance, Springer-Verlag, Wien, New York, 2003
[4] R. Kostka. Remote Sensing Activities for Glacier Mapping in the Langtang Himal, Nepal, Proceedings of the Second International Symposium on High Mountain Remote Sensing Cartography, Astronautic Publishing House, Beijing, China, 145-155, 1993
[5] W. Sulzer. Monitoring of a high alpine landscape: Case study Langtang Himal (Nepal), Ekologia: Proceedings of the 15th International Symposium on Problems of Landscape Ecological Research, Bratislava, Slovak Republic, 351-364, 2010
[6] Austrian Eurasia-Pacific Uninet, Online available from http://www.eurasiapacific.net
[7] S. Bajracharya, S.B. Maharjan, F. Shrestha. Glaciers Shrinking in Nepal Himalaya, In: Blanco, J. (Ed.), Climate Change - Geophysical Foundations and Ecological Effects, InTech, Online available from http://www.intechopen.com, 446-458, 2011
[8] T. Shiraiwa, T. Watanabe. Late Quaternary glacial fluctuations in the Langtang Valley, Nepal Himalaya, reconstructed by relative dating methods, Arctic and Alpine Research, Vol.23, No.4, 404-416, 1991.
[9] P.L. Barnard, L.A. Owen, R.C. Finkel, K. Asahi. Landscape response to deglaciation in a high relief, monsoon-influenced alpine environment, Langtang Himal, Nepal, Quaternary Science Reviews, Vol.25, 2162-2176, 2006
[10] A. Kääb, E. Berthier, C. Nuth, J. Gardelle, Y. Arnaud. Contrasting patterns of early twenty-first-century glacier mass change in the Himalayas, Nature, Letter, 23 August 2012, 488, 495-498, 2012
[11] T. Bolch, A. Kulkarni, A. Kääb, C. Huggel, F. Paul, J.G. Cogley, H. Frey, J.S. Kargel, K. Fujita, M. Scheel, S. Bajracharya, M. Stoffel. The State and Fate of Himalayan Glaciers, Science, Review, 20 April 2012, 336(6079), 310-314, 2012
[12] R. Kostka, G. Moser, G. Patzelt. Begleitworte zur topographischen Karte des Langtang Himal 1:50.000, In: Arbeiten aus Nepal - Erwin Schneider zum Gedächtnis, High Mountain Research, Association for Comparative Alpine Research Munich, Vol.9, Universitätsverlag Wagner, Innsbruck, 173-180, 2004
[13] T.B. Pradhananga. Topographical Survey Branch with Remote Sensing, Nepalese Journal on Geoinformatics, Vol.2, 47-52, 2002
[14] T. Shiraiwa, T. Yamada. Glacier Inventory of the Langtang Valley, Nepal Himalayas, Low Temperature Science, Series A, 50, Data report, 47-72, 1991
[15] G. Kappenberger, U. Steinegger, L.N. Braun, R. Kostka. Recent Changes in Glacier Tongues in the Langtang Khola Basin, Nepal, Determined by Terrestrial Photogrammetry, In: Snow and Glacier Hydrology, Proceedings of the Kathmandu Symposium, November 1992, IAHS Publication, Vol.218, 95-101, 1993
[16] WGMS. Fluctuations of Glaciers 2005-2010 (Vol. X): Zemp, M., Frey, H., Gärtner-Roer, I., Nussbaumer, S.U., Hoelzle, M., Paul, F. & W. Haeberli (eds.), ICSU (WDS)/ IUGG (IACS)/ UNEP/ UNESCO/ WMO, World Glacier Monitoring Service, Zurich, Switzerland. Based on database version doi: 10.5904/wgms-fog-2012-11, 2012
[17] K. Fujita, T. Nuimura. Spatially heterogeneous wastage of Himalayan glaciers, PNAS, 23 August 2011, Vol.108, No.34, 14011-14014, 2011
and 1996, Bulletin of Glaciological Research, Vol.16, 75-81, 1998
[19] N. Naito, T. Kadota, K. Fujita, A. Sakai, M. Nakawo. Surface lowering over the ablation area of Lirung Glacier, Nepal Himalayas, Bulletin of Glaciological Research, Vol.19, 41-46, 2002
[20] WWF Nepal. An overview of glaciers, glacier retreat, and subsequent impacts in Nepal, India and China, WWF Nepal Program, 2005
[21] J. Lindenmann. Untersuchungen dekadischer
Gletschervolumenänderungen im Langtang Himalaya, Nepal, basierend auf DHM-Analysen verschiedener Datensätze inklusive statistischer Unsicherheitsanalyse, Unpublished master thesis, Institute of Geography, University of Zurich, 2012
[22] M. Gruber, R. Kostka. Detailkartierung in Nepal mit unkonventionellen Luftaufnahmen, Zeitschrift für Photogrammetrie und Fernerkundung, No.5, 144-149, 1990 [23] M. Gruber, R. Kostka. Großmaßstäbige Karten in entlegenen
Gebirgsregionen – Vegetations- und Landnutzungskartierung im Langtang-Himal/Nepal 1:10 000, Kartographische Nachrichten, Vol.40, No.2, 46-51, 1990
[24] V. Kaufmann. The evolution of rock glacier monitoring using terrestrial photogrammetry: the example of Äusseres Hochebenkar rock glacier (Austria), Austrian Journal of Earth Sciences, Vol.105, No.2, 63-77, 2012
[25] F. Remondino, C. Fraser. Digital camera calibration methods: considerations and comparisons, IAPRS, Dresden, Germany, Vol. XXXVI, Part 5, 266-272, 2006
[26] C. Fraser. Automatic camera calibration in close range photogrammetry, PE&RS, Vol.79, No.4, 381-388, 2013 [27] V. Kaufmann, R. Ladstädter. Application of terrestrial
photogrammetry for glacier monitoring in alpine environments, IAPRS, Beijing, China, Vol. XXXVII, Part B8, 813-818, 2008