A Study on the Returns and Volatility of the top 05 PSUs and
Private Sector Banks with Reference to Nifty 50
Dr. Nilam Panchal
Abstract
This paper is a humble attempt to measure the volatility of the top 05 Public Sector Banks and Private sector banks (as per Market Capitalization) with respect to volatility of NIFTY. Stock markets in general are considered volatile and this volatility plays important role in measuring the risk-return trade-offs. For investors estimating volatility enables the pricing of securities and, understanding stock market volatility or individual stock price volatility enables them to take informed decisions. Risk-averse Investorsare happy to invest in low Beta stocks, whereas Risk-takers would happily invest in stocks having higher Beta. Volatility is simply a measure of deviation from the mean values. In this study standard deviation and individual beta values have been calculated to get an idea of the volatility.
Introduction
Indian Stock market has drastically changed since last few decades. Capital market in India is a very robust market. Consequently, transparency of markets has increased over period. Volatility of Stock markets plays an important role in measuring the risk –return trade-offs. There are so many factors that make the stock market volatile and it is of general interest to understand if the volatility of the stock market in India in line with the volatility of the different sectors in India. Banks have been major contributors to the fluctuations in the stock market index (Anbukarasi&Nithya, 2013). For investors estimating volatility enables the pricing of securities and, understanding stock market volatility or individual stock price volatility enables them to take informed decisions. Risk-averse Investors are happy to invest in low Beta stocks, whereas Risk-takers would happily invest in stocks having higher Beta. Volatility is simply a measure of deviation from the mean values.
Given this premise, the banking sector is chosen in this study to see if the movements of the top 5 PSUs and top 5 Private sector banks is in line with NSE NIFTY. As on date there are 27 public sector banks in India out if which 19 are nationalised banks and six are SBI and its associate banks, the other two being IDBI Bank and BharatiyaMahila Bank. Apart from this there are 23 private sector banks and a good number of foreign banks operational in the country. Banks in India are regulated by RBI and as such have to comply with regulatory norms like the CRR, SLR, and Basel III among others. As per directions of RBI on managing the NPAs and stricter provisioning norms to meet the minimum capital adequacy standards, the banking sector and PSU banks in particular have been volatile recently. RBI controls the flow of funds in the economy and tries to control the liquidity in the economic system. RBI’s actions affect banks’ lending and thereby the profitability and therefore the demand for these securities.
A. National Stock Exchange Index (NIFTY)
National Stock Exchange, popularly known as NIFTY 50 is the leading index of the Indian Stock market. Nifty stocks consist of 23 different economic sectors. Banking sector is one of the most actively traded sectors in NSE.
B. Constituents of Bank index
The Bank Nifty or CNX Bank Index provides an overview of the stock market performance of the Indian banking sector. This study comprises of top 05 PSU banks and top 5 Private sector Banks (by market capitalization) which are constituents of Bank NIFTY. These constituents (PSU Banks and Private sector banks) serve as a benchmark and assists investors to easily understand and make informed investment decisions.
II. Review of Literature
William and Vimala (2015) examined the volatility of equity share price of five select private banks listed in the National Stock Exchange. Considering that banks play an important role in the economy of India, an attempt was made to analyse the market volatility of the selected banks by using mean, standard deviation and beta values using the opening and closing prices. It was concluded that the volatility of the closing prices was similar for all the five banks selected for the study.
Anbukarasi and Nithya (2014) made an attempt to bring out the correlation between select stock indices and the NIFTY from January 2013 to June 2014. It was found that there was a significant correlation of all the selected indices except Metal, Pharma, Bank and Realty indices. It was also concluded that the Pharma and Bank indices have a strong impact on NIFTY movements.
Rajamohan.S and Muthukamu.M (2014), conducted a comparative study between bank Index and other sectoral indices using Pearsonian correlation coefficient. It was found that Bank index positively influenced almost all the other sectoral indices. Investors, before investing in any sector, hence need to check the patterns in the banking sector as it could influence the behaviour of other sector stocks.
Bhowmik.D (2013) evaluated the framework of stock market volatility at the country level. According to the study volatility would be spurred by political turmoil or instability and high volatility reduces growth rate of the economy. Volatility also influences the volume of international trade and increases current account deficits
Shanmugasundram and Benedict (2013) conducted a study on the volatility of the sectoral indices with reference to NSE. In this study the risk relationship in different time intervals of the CNX NIFTY index and five sectoral indices including Auto index, Bank index, FMCG index, Infrastructure index and IT index was examined. The results of the study did not support any significant difference across the risk of sectoral indices and NIFTY.
Swarna Lakshmi (2013) used the ARCH model to measure the volatility in NIFTY and other 11 select sectoral indices in India for the period 2008 to 2013. A conclusion was made on the 11 sectors volatility in comparison with the NIFTY and it was found that among the 11 sectors, the realty sector was the most volatile than any other sector. The paper also has discussions on the reasons for the same.
Iii. Scope of the Study
This study is limited to period of one year from 21stApril 2017 to 20th April 2018 and is restricted to measuring and comparing the returns, volatility and beta of the top5 PSUs and 5 Private sector banks (by market capitalization) with the NIFTY index.
IV. Objective of the Study
sector banks (by market capitalization) with the NIFTY index have been analysed.
V. Research Methodology A. Data used
The data used in for the study is purely secondary in nature where the daily closing of the NIFTY index and daily closing prices of stock of thetop 5 PSUs and 5 Private sector banks (As per highest Market Capitalization). The daily closing prices have been collected from the official website of National stock Exchange (NSE) for a period of one year from 21stApril 2017 to 20th April 2018.
B. Tools used for analysis
For data analysis here the descriptive statistics with regard to daily closing prices average, high and low and the daily returns are used. Volatility is explained using standard deviation and beta. The NIFTY index returns and each of the bank returns have been correlated to see the relationship.
C. Daily returns
To measure the daily returns as a percentage between any two days, the difference between closing price of the individual stock value of second day and the first day is divided by the closing price of the individual stock of the first day.
D. Standard deviation as a measure of volatility
Volatility is a measure of dispersion. If volatility is high, the risk of the security is considered high as well. Here standard deviation is used as a tool to measure volatility. Standard deviation is measure of dispersion of a set of data from its mean. The formula for standard deviation is
Where σ the standard deviation, x is each value of the data set, x̅ is the mean value of the data set and n is the number of values in the data set.
E. Beta as a measure of volatility
Beta has also been calculated for the top 5 PSUs and 5 Private sector banks (by market capitalization) stock.Beta is also known systematic risk to indicate if the bank stock is more or less volatile than the NIFTY. Beta measures the volatility of the stock to the market. A beta of more than 1 is an indication that the stock’s price is more volatile than the market. So, for e.g., if the beta of a stock is 1.2, it is meant to be 20 percent more volatile than the market. The formula used to arrive at Beta (β) is as follows:
Where β is Beta, Covariance (rm, ri) is the covariance between the market and stock and Variance(ri) is the variance of the market. All calculations have been done using MS Excel 2016
F. Correlation
VI. Analysis and Interpretation
A. Descriptive statistics of the banks and NIFTY index
Daily closing value of the NIFTY 50 and the top 5 PSUs and 5 Private sector banks (by market capitalization) stocks for the period between 21stApril 2017 and 21st April 2018 were extracted from the NSE website and the mean and standard deviation was arrived at. The table one below shows the daily high, low, average equity share price and standard deviation of the top 5 PSUs and 5 Private sector banks (by market capitalization) stocks and also the highest, lowest and average values and standard deviation of the NIFTY index.
TABLE1: Closing Index and bank index stock prices: Highest, Lowest, Mean values and Standard Deviation for the period 21stApril 2017- 20th April 2018
TYPE Name of Index/ Stock Closing Highest
Closing Lowest
Closing Mean
Standard Deviation (AvgDaily Volatility in %)
NIFTY INDEX 11130.4 9119.4 10093.6 0.687
PSUs SBI 337.5 234.8 287.207 2.24
Bank of Baroda 195.75 131.55 159.2659 2.87
IDBI Bank 84.65 51.8 62.477 3.34
Canara Bank 439.9 235.45 339.523 3.30 Bank of India 207.85 95.1 151.685 3.15
Private Banks
HDFC 2005.7 1496.6 1789.32 0.93
Kotak Mahindra 1172.1 880.4 1015.51 1.25
ICICI 362.3 257.85 302.59 1.90
Axis 620.1 449.95 524.38 1.81
IndusInd 1866.85 1389.25 1637.307 1.16
The table shows that the highest value of the NIFTY index for the period 21stApril 2017 to 20th April 2018 was 11130.4 with the lowest being 9119.4 and a mean of 10093.6 and a
standard deviation of 0.687 (Average daily Variance in %). Among the banks listed, IDBI bank had the highest standard deviation of 3.34% reflecting highest fluctuation in price. HDFC Bank has the least standard deviation of 0.93% reflecting least fluctuation in price.
B. Average returns of the Index and Bank stocks
The average of daily returns for the Bank index stocks and Average NIFTY daily returns was calculated. The average returns of the NIFTY index for the period April 2015 –March 2016 was -0.06%. Average daily returns for the top 5 PSUs and 5 Private sector banks (by market capitalization) for the corresponding period are presented in Table two below.
TABLE 2: Average Daily Returns of the bank index stock for the period between April 2017 and March 2018
Sr. No Name of the bank Average daily returns (in %)
PSUs SBI -0.06
Bank of Baroda -0.08
IDBI Bank -0.03
Canara Bank -0.09
Bank of India -0.16
Private Sector Banks
HDFC 0.11
Kotak Mahindra 0.11
ICICI 0.02
Axis 0.02
The average daily returns shown in the table indicate returns similar to the NIFTY index average returns. All the stock in the bank index have small amounts of negative returns for the period mentioned except Private Sector Banks which have shown a small but positive return.
C. Correlation between the bank index stock and NIFTY index
The correlation statistics between the daily average returns of the individual banks with the NIFTY index is presented in Table three. From the table it is very clear that all the banks’ returns have positively correlated with the NIFTY index. HDFC bank among the top 5 PSUs and 5 Private sector banks (by market capitalization) has the highest correlation (0.496) with the NIFTY index, followed by SBI (0.457), ICICI bank (0.444), and so on. The least co-relation is of Canara Bank and IDBI bank with 0.37 and 0.287 values respectively.
More than 75 percentages of the stocks in the bank index have positive correlations of more than 0.40 with that of the NIFTY index, reflecting that both the bank index stocks and the NIFTY index move parallel or vary together.
TABLE 3: Correlation between Bank index stock and NIFTY index for the period 21stApril 2017 to 20th April 2018
Sr. No Name of the bank Correlation with NIFTY Index
PSUs SBI 0.457
Bank of Baroda 0.394
IDBI Bank 0.287
Canara Bank 0.37
Bank of India 0.422
Private Sector Banks
HDFC 0.496
Kotak Mahindra 0.4238
ICICI 0.444
Axis 0.408
IndusInd 0.441
D. Beta of Bank Index stocks
As mentioned earlier beta reflects the volatility of the respective stock in relation to the market movements which is in this case considered as NIFTY index movements, as NIFTY reflects market movement. A beta of more than 1 is an indication that the stock’s price is more volatile than the market.
Beta value has also been calculated for all the top 5 PSUs and 5 Private sector banks (by market capitalization) stock appearing in the bank index using Ms Excel 2016. The data related to daily returns of the NIFTY index and daily returns of the stock were used to arrive at the beta value to explain the share volatility corresponding to the index. Table 4 presents the details of calculated Beta values of the top 5 PSUs and 5 Private sector banks (by market capitalization).
TABLE 4: Beta values of the banks for the period 21stApril 2017 – 20th April 2018
Sr No. Name of the bank Beta of the stock
PSUs SBI 1.023
Bank of Baroda 1.129
IDBI Bank 0.983
Canara Bank 1.22
Bank of India 1.328
Private Sector Banks
HDFC 0.4598
Kotak Mahindra 0.530
ICICI 0.843
Axis 0.738
A look at the table four gives a clear indication that all the bank stock appearing in the bank index has been highly volatile during the period. Bank of Indiashows the highest beta value of 1.328 followed by Canara Bank (1.22), Bank of Baroda (1.129), SBI (1.023), IDBI Bank (0.983), ICICI Bank (0.843), Axis bank (0.738), Kotak Mahindra bank (0.53) and the lowest beta value among the banks was HDFC bank with 0.45 beta. This gives a clear indication that all banks except HDFC bank were more volatile than the market.
TABLE 5: Summary of research data
RESEARCH OF INVESTMENT RISK USING BETA COEFFICIENT
Symbol Close Price Daily return Daily Volatilt y Annual Volatilt y Covarianc e Correlatio
n Beta
PSU Banks
BANKINDIA 151.69 -0.16% 3.15% 60.11% 0.912 0.422
1.32 8
CANBK 339.52 -0.09% 3.30% 63.07% 0.837 0.369
1.21 9 BANKBAROD
A 159.27 -0.08% 2.87% 54.74% 0.775 0.394
1.12 9
SBIN 287.21 -0.06% 2.24% 42.72% 0.702 0.457
1.02 3
IDBI 62.48 -0.03% 3.43% 65.46% 0.675 0.287
0.98 3
PVT Banks
ICICIBANK 302.59 0.02% 1.90% 36.31% 0.579 0.444
0.84 3
AXISBANK 524.39 0.02% 1.81% 34.54% 0.507 0.408
0.73 8
KOTAKBANK
1015.5
2 0.11% 1.25% 23.92% 0.364 0.424
0.53 1
INDUSINDBK
1637.3
1 0.09% 1.16% 22.23% 0.352 0.441
0.51 3
HDFCBANK
1789.3
3 0.11% 0.93% 17.71% 0.316 0.496
0.46 0 Table 5 shows comparative analysis between PSU banks and Private sector banks.
Vii. Discussion and Conclusion
The objective of the paper was to analyser the nature and extent of relationship between returns and volatility of top 5 PSU and Private sector banks (based on highest Market Capitalization). With reference to TABLE 5 showing research summary, following points can be concluded: -
1) The daily returns of the PSU banks are negative whereas that of Private sector banks are positive.
2) The PSU banks have higher daily volatility than the Private sector banks. Financially stronger banks have less volatility amongst the banking sector.
3) Similarly, the PSU banks have higher annual Volatility than the Private sector banks.
by Co-Variance and co-relation).
5) PSU banks are having higher β than the Private sector banks. PSU banks carry more
risk than NIFTY whereas Private sector banks carry less risk than NIFTY.
6) For investors, going long on Private sector banks, and short on PSU banks has generated Alpha in the period studied.
References
1) http://www.ijarcsms.com/docs/paper/volume4/issue4/V4I4-0065.pdf
2) https://zerodha.com/varsity/chapter/volatility-calculation-historical/
3) https://www.investopedia.com/articles/financial-theory/11/calculating-covariance.asp
4) https://www.nseindia.com
5) http://www.indianjournals.com/ijor.aspx?target=ijor:ajm&volume=4&issue=2&article =009
Participation Level and Empowerment of Women through
MGNREGP in Keerapalayam Block, Cuddalore District
B.ARISHBABU
Dr.T.SEZHIYAN
Abstract
This study focus on women’s levels of participation in Mahatma Gandhi National Rural Employment Guarantee programme inKeerapalayam block of Cuddalore District. The MGNREGP has implemented in 2nd February in 2006, introduced in 200 most backward districts in the country. The programme aims toreduce poverty, create employment opportunity, create assets, and empowering rural women. The programme providing 100 days guarantee employment in rural peoples, now its increasing 100 days to 150 days and it also to improve labour market outcomes. MGNREGP increase income and expenditure of the households compare after the MGNREGP period and the scheme significantly enhances the social and economic decision making power to women in the men dominant rural society. This scheme improves the standard of living in rural poor especially among women. The programme aims for strengthening women empowerment, protect the social environment and also give equal power in the political level of men and women. MGNREGP is improving woman economically and socially.
Keywords: Employment Guarantee, Empowerment, Poverty elevation
Introduction
The women are an essential part of the society because they play a very important role in the development of the society. At the same time, women are needed some support for empowerment themselves and their family. Women empowerment in the power of having decision making to their own. The present day the word empowerment has become synonyms of the women.
At present it is generally seen that women are not lagging behind of men. They play vital role to the contribution of making their family decision independently. The women empowerment is very important who earn their livelihood and it can challenge the social gender relations and gender equality. The central government takes various rural development programmes for the upliftment of women development and women empowerment. The MahatmaGandhi National Rural Employment Guarantee Act (MGNREGA) introduced on 2nd February 2006 in implemented in the most backward district of our country to develop the women socio-economic status and women empowerment. The Act that provides guaranteed to work for rural poor and mainly for women’s the main objective of this act is to improve the women socio-economic status and purchasing power in rural poor. It also aims to empowerwomen and strengthening the women weaker sections, improving women economic status and create self-respect in the society.
Ph.D Research Scholar, Department of Economics Annamalai University, Annamalai Nagar 608002
The Mahatma Gandhi National Rural Employment Guarantee Act, besides, the main features mentioned in the above background note, also involves participatory planning and implementation of the Act through
(i) Proactive role of Gram Sabha
(ii) Rigorous & continuous monitoring by way of social audit
(iii) Involvement of ordinary people at the grass-roots level.
It addresses to reduce, chronic poverty, Drought, Deforestation and Soil erosion. It also aims at Generating productive assets, Protecting the environment, Empowering rural women and arresting rural-urban migration.
Review of Literature
SumeethAgarwal and Madhavi Devi (2015) have explained in this study woman of India are relatively disempowered and they enjoy somewhat lower status than that of men in spite of many efforts undertaken by the government. MGNREGA by adopting Inclusive participatory growth is playing a major role inbringing the women of the society into the productive zone. Rural women are more prone to domestic violence than that of urban women. A large gender gap exists in political participation too. The study concludes with an observation that MGNREGS has to lead to women empowerment through the active participation of women in MGNREGS works.
Sharma Vishnu Kanth and Kumar Ashvine (2013) have discussed in this article rural household whose adult members are willing to participate in unskilled manual work. The act is an important step towards the realization of the right to work and aims at arresting out-migration of rural households to strengthen the women employment by enforcing that about 33 percent of the totalworkforce should be allotted to women and also that there will be equal wages for men and women. It is playing a substantial role in creating employment for women thereby, leading to greater independence and self-respect among women. Employment and simultaneously enhancing people’s livelihood on a sustained basis, by developing the economic and social infrastructure in rural areas
Venubabu and Sudhakar (2014) have discussed in this article about women empowerment.NREGA promises from the perspective of women’s empowerment as well. Most boldly, in a rural milieu marked by stark inequalities between men and women. In the opportunities for gainful employment afforded as well as wage rates enhance livelihood security in rural areas by providing at least 100 days of guaranteed wage employment in a financial year. To every poor woman’s whose adult members volunteer to do unskilled manual work? This work guarantee can also serve to generate productive assets, protecting the environment, empowering rural women, reducing rural-urban migration and fostering social equity, among others.
Objectives
1. To analysis socio-economic status of sample respondent in Keerapalayam block Cuddalore district.
2. To analysis participation level of women on MGNREGA in Keerapalayam block of Cuddalore district.
Methodology
sample size for 150 and were selected randomly in interview method in households in the study area.
Table-1: Classification of Respondents According to their Age
S.No Age/Village No of respondent Total
(%)
Vayalur village Kannur village
1 20-30 21
(14.0)
29 (19.3)
50 (33.3)
2 31-40 34
(22.7)
17 (11.3)
51 (34.0)
3 41-50 14
(9.3)
19 (12.7)
33 (22.0)
4 Above-50 6
(4.0) 10 (7.0) 16 (10.7) Total 75 (50.0) 75 (50.0) 150 (100.0) Sources: Primary data
The table-1 explicit the classification of sample respondents according to the category of age and village wise of the total 150 sample respondents 34.0 percentages of respondents (22.7 percent from Vayalur and 11.3 percent from Kannur) are under the age group of 31-40. Further 20-30 age group of respondents is involved 33.3 percent (14.0 percentages from Vayalur and 19.3 percentages from Kannur). Similarly, the 22.0 percent of respondents belong to the age group of (9.3 percent from Vayalur and 12.7 percent from Kannur) 46-50. Rest of the 10.7 percent of respondents (4.0 percent from Vayalur and 7.0 percent from Kaanur) above 50 age group.
Table-2: Classification of the Respondents According to their Education Level
S.No Education No of respondent Total
(%) Vayalur village Kaanur village
1 Illiterate 11
(7.3)
14 (9.3)
25 (16.7)
2 Primary education 25
(16.7)
29 (19.3)
54 (36.0)
3 Middle education 27
(18.0)
18 (12.0)
45 (30.0)
4 Higher education 12
(8.0) 14 (9.4) 26 (17.3) Total 75 (50.0) 75 (50.0) 150 (100.0) Sources: Primary data
Table-3: Classification of the Respondents According to their Income Level
S.No Income
No of respondent
Total (%)
Vayalur village Kaanur village
1 Below-`.40000 28
(18.7)
19 (12.7)
47 (31.3)
2 40001-60000 24
(16.0)
29 (19.3)
53 (35.3)
3 60001-80000 12
(8.0)
13 (8.7)
25 (16.7)
4 Above-80001 11
(7.3)
14 (9.3)
25 (16.7)
Total 75
(50.0)
75 (50.0)
150 (100.0) Source: Primary data
Table- 4 shows that the annual income of sample respondents, in the Kaanur village 18.7, 16, 8, and 7.3 of the respondents has an annual income below- `.40000. `.40001-`.60000, `.60001-`.80000 and above `.80001 earned respectively. In the second village of Kaanur 12.7, 19.3, 8.7, and 9.3 of the respondents their annual income below-`.40000, `.40001-`.60000, `.60001-`.80000 and above `.80001 earned respectively.
Table-4: Classification of Respondents According to their Savings
S.No Saving
No of respondent Total
(%)
Vayalur village Kaanur village
1 Below-`.5000 26
(17.3)
22 (14.7)
48 (32.0)
2 `.5001-`.10000 20
(13.4)
11 (7.3)
31 (20.7)
3 `.10001-`.15000 15
(10.0)
27 (18.0)
42 (28.0)
4 Above-`.15000 14
(9.3)
15 (10.0)
29 (19.3)
Total 75
(50.0)
75 (50.0)
150 (100.0) Source: Primary data
Table-5: Cross Table Analysis of the Respondents about their Empowerment in the Study Area
S.No Category Low Moderate High Total
1 Skill development 59
(39.3) 82 (54.7) 9 (6.0) 150 (100.0)
2 Communication skill 27
(18.0) 79 (52.7) 44 (29.3) 150 (100.0)
3 Decision making skill 24
(16.0) 65 (43.3) 61 (40.7) 150 (100.0)
4 Ability to bargain skill 28
(18.7) 80 (53.3) 42 (28.0) 150 (100.0) 5
Ability to question various forum of exploitation 7 (4.7) 77 (51.3) 66 (44.0) 150 (100.0)
Table-5-explain empowerment of the respondents in Keerapalayam block, regarding the empowerment, five independent variables are taken to the account viz., skill development, communication skill, decision making skill, ability to bargain skill, ability to question various forum of exploitation. In Keerapalayam block the respondents are having a moderate level of communication skill, decision making skill. Regarding skill such as the ability to question various forum of exploitation, ability to bargain and skill development the respondents have a high level of skill are recorded in Keerapalayam block.
Hence, the respondents in Keerapalayam block Vayalur village respondents have a higher level of skills than the Kaanur village. At the same time, both village people are having socio-economic empowerment through the MGNREGP schemes.
Findings
1. The 67 percent of the respondents belong to below 40 years of age
2. The participation level of women respondents was fall under the primary and middle education, ie 66 percent in the study region.
3. The 66.5 percent of the respondents were got an annual income of below `.60000 and only 33.5 percent of the respondents received their annual income of above `.60000 in the study region.
4. In the study region, the respondents have development skill at a high level. That is nearly 50 percent of the respondents have a skill like decision making, ability to bargain and ability to question in the various forum.
5. Based on this study more than 65 percent of the respondents are having economic empowerment and political empowerment through the MGNREGP schemes in the study region.
Suggestions
1. The number of working days should be increased to 200 days per yea
2. To arrange safe drinking water and health facility in the study region.
Conclusion
utilization of funds under the scheme will have a positive input in rural women, rural development and the economic development in the study region. Hence the MGNREGP play a vital role to develop the respondent's socio-economic empowerment in the study region.
References
Babita Panda and Tan Veer Ahmed Wane (2013) “A case study of women participation in Kashmir”, International Journal of allied practice research and Review PP-(9-17). ChannabaSavaiah (2014) “Analysis of women empowerment through MGNREGA in
Karnataka”, a Global journal for research analysis.Pp-6-9.
InderjeetKaur (2014) “Economic Empowerment of rural women and MGNREGA in India”, Journal of Public Administration, vol-1,LX -3 pp-692-705.
Pall Anurath (2015) “Women Empowerment through MGNREGA. A study in Vizianagaram District”, International Journal of multidisciplinary and Academic Research pp-3-9.
Sharma Vishnu Kant and Kumar Ashvine (2013) “women empowerment through rural employment in Uttar Pradesh”, an international journal of engineering and management sciences, vol-4(2) pp-144-149
Shenbakaraj and Arokiasamy (2013) “ Impact of MGNREGA on local development in a study of Ottapidaram blocks in Thookudi District, Tamil Nadu” International journal of development in research, vol-3 (4) pp-2-7.
SmithAgarwal and M. Madhavidevi (2015) empowerment of women through MGNREGA with special reference to Chhattisgarh, Indian journal of applied research.Vol-5(4) pp-656-659.
Sunil and Anupriya (2015) “employment-oriented development strategy: evaluation of MGNREGA in Haryana”, International Journal of Arts, Humanities and Management studies.vol-2,pp-4-8.
ROLE OF ICT IN EDUCATION SECTOR: A STUDY OF ICT
TOOLS IN EDUCATIONAL SETTING
Neerja Nigam
Professor (Dr) Sameer Sharma
Abstract
This study aims to explain the role of ICT in education sector, and to understand that how various ICT tools can help in making learning process easy and effective for students. Researcher has explained the concept of e-learning in modern era. The study is conceptual in nature and based on the studies conducted by various researchers in this area. It can be concluded from the study that adopting ICT tools in both primary & higher institutions does help in improving the effectiveness of learning. These tools are manifesting their usefulness both in the way Learners approach to their classes as well as how the Instructors deal with them. Hence it has become a necessity for institutions across the globe to adapt to ICT as the old traditional patter may not be sufficient in near future & will become obsolete as the human civilization advances & so does the sphere of knowledge.
Keywords: ICT, education, e-learning, educational tools, students, teachers, classroom training, and educational institutes.
1. Meaning of Ict
ICT is the short form of Information and communication technologies. This is an extensional term for Information technology(IT) which stresses the role of unified communication and integration of telecommunications (Telephone lines & Wireless signals), Computers as well as necessary enterprise software. Middleware, storage & audio visual systems which enables users to access, store, transmit & manipulate information (Chris, 2007). This includes Internet, Wireless networks, cell phones & other communication devices. The term ICT is also used to refer to the convergence of audiovisual & telephone networks with computer networks through a single cabling or link system (Watson, 1986). However, the definition is not sacrosanct as the “concepts, methods & application” involved in ICT are constantly evolving almost on daily basis The broadness of ICT covers any product that will store, retrieve, manipulate, transmit or receive information electronically in digital form. ICT can enhance the quality of education in several ways such as increasing learner’s motivation and engagement, facilitating the acquisition of basic skills and by enhancing teacher training. ICT are also transformational tools which when used appropriately can promote the shift to a learner centered environment (Lefrancois, 1972).
In recent years there has been a groundswell of interest in how computer & internet can be best used to improve the efficiency & effectiveness of education at all levels in both formal & non formal settings (McMahon, 1997). Hence ICT is being used widely in teaching & learning in both classroom settings & informal settings (Coleman, 1984).
Assistant Professor, SSIM, New Delhi
2. Literature Review
Currently IC technology is being employed by Instructors & Teachers across the Globe for designing instructional material which can not only be operated by students themselves but also give them a platform to connect not only with other Students but Teachers as well in their pursuit of education (Eric, et al., 2009). Though here the focus is on educational theories only but they are more interactive as compared to a traditional Classroom teaching. Using ICT tools the students can share their learnings, ideas, views & queries with others & vice versa. Same way they can collaborate with others to find solutions to problems. This could have been nearly impossible & erratic in traditional type of learning methods (Hamid et al., 2014). Another advantage is that large amount of historical & current data is available here which can be easily sorted & downloaded for quick reference (Peter, 2011). This is far easier than going across scores of books searching to find relevant data. Thus it also saves a lot of time & energy (Elis, 2004). Not only that but this is also a better leaning medium in which the learner can go thru the material again & again which was not possible in traditional way of teach (Desai et al., 2008). On the other side the Teachers can go through the instructions & further keep on refining those (Schroeder et al., 2010). This results in development of a system which continuously improves upon itself thus becoming more efficient & effective as a learning tool with each passing day (Seaman & Tinti-Kane, 2013).
Thus we can say that ICT is a continuously evolving system which makes the traditional teaching/learning system far more interesting, collaborative, efficient & effective. ICT is not only a tool for learning but has the capability to change the entire nature of the education & its objectives. We can understand it from the fact that with the growth of civilization human race has been continuously innovating (Odom, 2010). From being hunters in primitive ages it converted to farming, developed communities, defined laws & regulations for social co existence, acquired skills in various fields such as medicine, Engineering etc& developed a Global world order where different countries across various continents are bonded together with various treaties & Agreements. Thus the ambit of knowledge kept on expanding & today has become so wide that there is a fear of losing acquired skills as we move forward if we rely on the traditional systems only (McLoughlin& Lee, 2008). ICT as a tool here offers enormous advantage as not only all the acquired knowledge can be stored easily but can also be retrieved with equal ease for further working. Analysis & synchronization of data has become very smooth due to this (Griffith &Liyanage, 2008). Hence now the instructor role has basically changed to that of a moderator & the ICT tools provides the platform for the students to have an interactive learning (Tay& Allen, 2011). On the other hand, the effectiveness of Instructor has increased manifold as he can quickly retrieve & give references to students to explain his point of view without carrying a bundle of books or carefully stacked notes with him (Racthman&Firpo, 2011).
3. Usefulness of ICT Educational Tools
Global validation for same. Also against any query/problem posted we can get a myriad of solutions, may be all different but all correct under the environment & context it has been posted by respondent (As environment varies from Community to Community & from Nation to Nation). Moreover, Educational articles can be published online & their access can be provided to other learners under a controlled environment with the Author acting as an Administrator of that material (Hemmi et al., 2009). Thus it is possible for anybody to use the material of any Author though with the consent of Administrator, may be at a price or some quid pro quo (Selwyn, 2012).
As per the researches done by many psychologists with regards to ICT tools majority of them agree that using ICT tools increases learning speed by providing a better experience in an interesting environment (Crook et al., 2008). Practically also it has been observed that ICT tools give a better understanding to learners as they tend to become more attentive & hence there are lesser chances of losing interest when ICT is used in classroom setting (Chen et al., 2011). Not only that but they also imbibe the learning’s better & this has reflected not only in the overall scores but also in effective operation of various tasks. Another important aspect is that some learners are hesitant to ask questions/queries in classroom & the resultant poor understanding of the topic weakens their base & the subsequent topics which are related to that subject matter become even more difficult to understand. ICT comes as a boon for such Learners as they can use social ICT educational tools such as wikis, Blogs & social networking sites to clear their queries as well as seek answers to their doubts as here they can frankly put in their views without any fear of adverse comments by the Instructor or their becoming centre of fun in the presence of others. This not only helps them to manifest themselves in a coherent & detailed way but also their motivation level & learning improves by the feedbacks received. Such feedbacks are very useful as the publisher get the detailed view of both the sides of coin thereby improving his analytical skills as well which in turn reflects in their quality of work (Ellison, 2007).
Researchers one after other have repeatedly observed that when learners publish their ideas, work or experiences online they are read by numerous viewers & audiences belonging to different social backgrounds & as a result the feedback which comes is very enriching (Tower et al., 2014). Moreover, even the viewers find it interesting to read as well as such works is genuine firsthand experience of a person & closer to reality (Hall and Hall, 2010).
Hence academicians have come to a conclusion that ICT, if utilized in the right way, can be one of the most effective tools as a learning aid for the students (Pursel&Xie, 2014). Not only that but it can be productively utilized in large organizations in motivating the Employees by improving their skills as well as by keeping them update on the vision & mission of the company thereby building efficient & cooperative work force aligned to Organizations objectives.
students take the centre stage in stark contrast to traditional classroom setup where learners tend to become bored after some time (Hoffer, 1988). Another effect was on scope of learning as the students were able to data mine a lot of relevant information & works of other from the Internet (Preece&Shneiderman, 2009). This also leads to assimilating new & innovative approaches in their own work. Moreover, learners as a result not only are more at ease with the Computers & modern communication gadgets but also get a fairly good idea of the various ethical & social issue which they need to take care when using these media. Also it was felt that with ICT tools as an aid in traditional classroom teaching the environment changed to learner centered (where careful attention is paid to the knowledge, skill, attitudes and beliefs that learner bring with them to the classroom) from being Instructor centred (Rifkin et al., 2009). In this type of set up the knowledge is “not out there” independent of learner and which the learner passively receives. Rather knowledge is created through an active process in which the learner transforms information. Constructs hypothesis & makes decisions using his/her mental models (Rosen and Michelle, 1995).
Most advantaged by these ICT tools are the learners in the under developed countries who earlier did not had a reach to latest things happening in the knowledge sphere as they lacked the basic infrastructure of traditional classroom setting in their countries. Such learners now with the help of ICT tools are connected to the entire world & are update on the latest developments & innovations happening across the globe.
4. Trends of Information Communication Technologies in Education
Classrooms equipped with ICT tools i.e. Smart classes as they are also called have an interactive whiteboard predominantly displayed along with a Projector connected to Computer with CD Rom, Scanner & Printer (Gateway, 2010). On the software side we have software programs. However, with the advent of technology these Smart Classrooms have also seen a qualitative improvement by deploying wireless connections & web portals (Casal, 2007). These things might seem to be complex to observe but due to user friendly applications have made lifes of both teachers & taught stress free to a great extent. As they contain a large amount of information which can be easily mined by the Instructor it has made his life simple as he does not need to keep an assortment of reference books at home & make notes out of same. Also he need not keep on collecting latest editions of books to update his knowledge as all that is available on the click of the mouse. The learners on the other hand by interacting with other learners across the globe get a fairly clear understanding of any subject (Rubina et al., 2011).
However, it is important for the Instructor as well as the learner to keep abreast of the latest trends which are happening globally with reference to ICT (Hawkins Roberts, 2010). Major 10 trends are as in numerated below:
most useful when outside the class. In other words, they are definitely not a substitute for the ICT classrooms but are surely supplementing tools. Through this we can get answers of any queries we come across after classroom by directly mailing them to Wikipedia & getting response in the form of text message (Ramzan, 2004).
2. Cloud Computing: As this requires less power in computing memory & is economical to use as compared to a proper ICT Classroom set up it’s very useful for underdeveloped, emerging & weak economies. Additionally, this can also be provided by a third Party in case the inherent competence & capabilities are not strong enough with regards to strategic support. Also this saves a lot of expenses as well which is required in case of independent set up. However, this does require Internet connectivity & is also sometimes susceptible to hackers.
3. One-to-One Computing: In a typical ICT Classroom setting across the world the concept is to have Students learn from one data gadget under supervision of one Instructor. However, some countries are experiencing with a novel concept where each student has been provided one individual gadget – That may be a PC, Laptop, Smart Cell Phone or Tablet etc with worldwide accessibility. One example is Uruguay who have given 1 PC to each student at the primary class level & planned to start this activity from small & remote towns & then gradually move towards big cities. Thus they are using the ICT tools not only for the purpose of education but to transform a community as a whole. Intention is to speed up their learning process by giving the kids the latest gadgets & thereby giving them a global exposure. Additionally, the children were also encouraged to share their ideas, experience & knowledge with relatives & seniors at home. They got very encouraging results though faced some implementation issues, major being keeping the instructors update in view of fast learning capabilities of the kids & arrangement of financial resources to procure so many gadgets at one time along in case of this One-to-One Computing model.
Another issue down the line will be related to E-disposal of these machines & their batteries.
4. All pervasive Learning: As the high speed internet availability is increasing & at the same time the costs of Computer & other Gadgets is going down, Governments across the world are transforming the traditional classroom settings to ICT Classrooms. Further they are trying to develop the capabilities so that the Learners can learn at any point of time & at any location. This is going to be a big change from the traditional classroom settings where we had eight periods of half an hour each. Also the hardware & software needs to be modified to provide for Learner to Learner interaction as well as deeper learning of topics with the help of virtual teachers. Even the books can be converted in to digital form which learners can study after the classrooms with the help of virtual Instructors. This is going to have a very wide ramification for the Private Tuition Industry that flourishes across the world as of now.
they are multiplayer games they develop team spirit as well. Current generation is very knowledgeable about these games.
6. Personalized Learning: Present ICT tools are able to comprehensively assess the current knowledge level vis a vis past knowledge base of learner & accordingly identify the gaps therein. Accordingly, Instructions can be molded to not only bridge these identified gaps but also to suit the education style of the learner. Thus using ICT enables Institutes to properly regulate instructions as per the individual needs of the learner. This is a sea change from the current education pattern where learners are taught as a group whereas in this pattern the student is the centre of attention. Many institutions are shifting to this pattern whereas each student’s individual needs are assessed regularly & then each one of them is tutored based on that assessment. Initial results of this approach have been very encouraging. This pattern is only going to increase with time as the technological innovation keep on happening in ICT to take care such needs
7. Redefinition of Learning Spaces: With the advent of these new ICT based approaches the pattern & setting of the Classrooms is also changing. The present seating pattern of Students & teaches in an enclosed room is increasingly being considered as a prison type of structure with more of monologues than dialogues. This is giving was to a seating system which is more open & flexible & promotes a collaborative type of atmosphere thereby developing team spirit amongst the learners. Accordingly, the Instructor role is also changing to that of a facilitator. Even the hardware of classroom is changing. The traditional desk & chair giving way to round tables & Room structures transforming to open spaces or conference halls type of setting. In short look wise classrooms are changing into Art galleries.
8. Teacher-Generated Open Content: This is a new style of teaching & MIT is one of the inventors of this approach & has played a crucial role in bringing it to the world. In this approach instructors are allowed to generate their own education content as per the need of their classrooms & their teaching style by suitable modifying, adding or converting the material available in web putting in their own insights & experience. Instructors following this approach regularly collaborate amongst with each other regarding subject matter & share data with each other. This is also leading to changes in the legal setup where creative common licenses are becoming norm of the day instead of earlier copyright system where permission was required from the author to even reproduce his ideas.
9. Smart Portfolio Assessment: ICT is also helping in systematic & orderly organization of all the educational information under various categories. This makes it easy for the Instructors to modify the matter & their education style based on the gaps observed. So far the students are concerned all their work whether in the form of blog, tweet, image etc which they put up on internet is also displayed on their individual collection. Consequently, their work available on the individual collection can be evaluated by the Instructor or feedbacks can be solicited from peers. This way ICT is actually transforming the entire evaluation system which is present today
the classroom & outside, recognizing gaps in individual leaner’s education base to modify the instruction style & pace accordingly.
Above trends which are emerging fast across all nations of the world are challenging the present system of traditional classroom learning & many nations are adopting these in order to keep pace with the changing needs in a technology based world.
5. E-Learning and Its Importance
Earlier anybody had just one option to learn i.e., go to a school and attend lecture from teachers. However, in case of E Learning both student & teacher interact online through a collaborative approach (Morgan, 2003). Both of them communicate & learn the courses online even if they are in the same premises. Though student can use offline material as well but they are sent to Teacher through internet. Online learning also uses internet but is a combination of E leaning & blended learning & uses tools like eztalks& cloud meetings (Virkus, 2008.) On the other hand, Distance learning though was introduced to attract students globally but now is becoming a synonym of online learning. In this pattern of education courses are offered to students if they meet the qualification & entry requirements. For instance, it allows a student from America to attend a European college without having to travel physically to attend Classes (Volman, 2005). However, E Learning is the latest concept & is very important for instructors & learners due to below reasons:
1) Flexibility: Many learners have some constraints not allowing them to attend a traditional classroom on regular basis. There, E Learning extends an advantage that the Learners can assess the subject material & teachers as per their own convenience. Not only that they can also submit their work whenever they require through Internet for evaluation as well.
2) Improved and Revitalized Teaching: E Leaning is a dynamic process as both learner & Instructor are exposed to plenty of subject knowledge & is more open to evaluation & review. In this innovative strategies need to be continuously devised. Hence Instructors need to devote a lot of time to structure the discourse in order to provide students an exciting experience.
3) Enhanced Learning Experience: E learning provides enhanced learning experience as there is more collaboration amongst the learners as it is not limited as in case of traditional classroom setting to few hours. Moreover, as the performances can be compared with that of others gaps are easily identified & one can strategize to bridge that gap. Learners who are not comfortable with English ascent have a problem of understanding the spoken lecture & are also unable to put in their doubts/queries clearly. However, in case of E Learning they can take their own time in going through the material available online & can also send blogs etc which are quickly evaluated by Instructor & peers.
4) Improved Time to Degree: In case of E Leaning thefast learners can complete their courses before time & move ahead. Also in certain cases where Learners are not able to clear some subjects they can take advantage of E Learning to clear them without wasting another year. Employed people can also take the advantage of getting higher qualification while they earn being gainfully employed.
substitute but does improves the current system.
6. Conclusion
Now it can be comfortably concluded that adopting ICT tools in both primary & higher institutions does help in improving the effectiveness of learning. These tools are manifesting their usefulness both in the way Learners approach to their classes as well as how the Instructors deal with them. Hence it has become a necessity for institutions across the globe to adapt to ICT as the old traditional patter may not be sufficient in near future & will become obsolete as the human civilization advances & so does the sphere of knowledge. With increasing literacy level & deeper penetration of Internet even Parent are influencing upon institution to shift to ICT tools as they are convinced that Learners using technology are far more successful in professional life’s as compared to those not exposed to it. Various researches have repeatedly validated those students who adopted IC tools irrespective of subjects not only scored better but also developed better reading & writing skills. They became more collaborative, got more dedicated to task & exhibited enhanced confidence. Moreover, since they believe in interaction which involves acceptance of contrary views as well they are more patient to instructions by the Instructor. Another advantage that came out repeatedly was the correction of mistakes is far easier on computer than in traditional means like manual writing or typewriter where the mistake is to be crossed or retyped after putting white ink. Moreover, by using ICT tools work can be presented in a more beautiful way in the form of presentation with very little labor.
However, this has another aspect as well which is contrary to what has been discussed above. It is also possible that students may get bored also with ICT learning if it is not stimulating, inspiring & fulfilling the expectations of learners. Hence there is another school of thought which says that 100% dependence on ICT tools cannot bring out the desired results unless it is backed by proper teaching plan by the Instructor. Moreover, the ease with which a learner adopts top ICT tools also depends upon the social environment in which he has been brought up, his Family condition & the level of technology that is available in his country.
Thus we can conclude that the importance of ICT tools in learning cannot be discounted but at present it can act as supplement to traditional system of education in countries which are under developed & developing ones. However sooner or later entire Globe has to shift to ICT based learning as the enormous amount of knowledge generated cannot be retained & taught by manual methods.
References
1. Brown, T., & Schroeder T. (2010). From VLEs to learning webs: The implications of Web 2.0 for learning and teaching. Interactive Learning Environments. Educational journa1 8(1), 1–10.
2. Casal, R. (2007). ICT for Education and Development. Info. 9(4).
3. Chen, R., Hwang, P., Wu, T., Huang, M., &Hsueh, T. (2011). Assessment of implementing a digital game-based learning system over Facebook. Paper presented at the 11th IEEE International Conference on Advanced Learning Technologies, Athens, GA.
5. Coleman, J. (1984). Applied Behavior Analysis for Teachers: Influencing Student Performance by Paul A. Alberto & Anne C. Troutman. Columbus, Ohio: Charles E. Merrill, 1982. 375 pages. 15.95. Remedial and Special Education, 5(2), pp.59-60.
6. Crook, C., Fisher, T., Graber, R., Harrison, C., &Lewin, C. (2008). Implementing Web 2.0 in secondary schools: Impacts, barriers and issues. Becta Report (Retrieved from dera. ioe.ac.uk/1478/1/becta_2008_web2_useinschools_report.pdf).
7. Desai, M., Hart, J., & Richards, T. (2008). E-learning: paradigm shift in education. Education, 129 (2), 327-334. Retrieved March 10, 2018, from Ebscohost database.
8. Ellis, R. (2004). Down with boring e-learning! Interview with e-learning guru Dr. Michael W. Allen. Learning circuits. Retrieved from. http://www.astd.org/ LC/2004/0704_allen.htm. 71
9. Ellison, N. (2007). Facebook use on campus: A social capital perspective on social network sites. Paper presented at the Sixth ECAR Symposium. USA: Boca Raton.
10.Eric U., Drier, S., Harper, S., & Timmerman, M. A. (2000). Promoting appropriate uses of technology in teaching preparation. Contemporary Issues in Technology and Teacher Education.
11.Gateway, D. (n.d). Defining ICT in Education. Retrieved October 3, 2010, from: http://www.rwandagateway.org/ICT4E/spip.php?rubrique6.
12.Griffith, S., &Liyanage, L. (2008). An introduction to the potential of social networking sites in education, In Paper presented at the Proceedings of the Second Emerging Technologies Conference 2008. Australia: Wollongong.
13.Hall, R., & Hall, M. (2010). Scoping the pedagogic relationship between self-efficacy and Web 2.0 technologies. Learning, Media and Technology, 35(3), 255–273.
14.Hamid, S., Kurnia, S., Waycott, J., & Chang, S. (2011). Exploring Malaysian students' perspectives of Online Social Networking (OSN) use for higher education. Paper presented at the 22nd Annual Conference ISANA International Education Association (ISANA) 2011, Hobart, Tasmania.
15.Hawkins R. (2002). Ten Lessons for ICT and Education in the Developing into the Learning Environment at Sevenoaks Senior College. Paper AlD01027. Available: http://www.aare.edu.au/01par/ald012027. Htm. [Accessed on 10 April 2018].
16.Heide, A., & Henderson, D. (2001). Active learning in the digital age classroom. Portsmouth, NH: Heinemann. Heidelberg, New York. Springer 965-982.
17.Hoffer, T. (1988). Book Review Teachers and Texts: A Political Economy of Class and Gender Relations in Education by Michael W. Apple. Is J Sociol, 93(5), p.1284.
18.Lefrancois (1972), Behaviorism. Retrieved 20/04/2018, from http://www.forerunner.com/forerunner/X0497_DeMar_-Behaviorism.html.
19.McLoughlin, C., & Lee, M. (2008). Social software and participatory learning: Pedagogical choices with technology affordance in the Web 2.0 era. Paper presented at the Ascilite Conference, Singapore.
20.McMahon, M. (1997). Social Constructivism and the World Wide Web - A Paradigm for Learning. Paper presented at the ASCILITE conference. Perth, Australia.
21.Morgan, G. (2006). Faculty Use of Course Management Systems: Boulder, Colo.: EDUCAUSE Center for Applied Research, 2003.
23.Preece, J., &Shneiderman, B. (2009). The Reader-to-Leader Framework: Motivating technology-mediated social participation. AIS Transactions on Human–Computer Interaction, 1(1), 13–32.
24.Prensky, M. (2001). Digital native, digital immigrants. On the Horizon, 9(5), http://www.marcprensky.com/writing/Prensky%20%20Digital%20Natives,%20Digital %20Immigrants%20-%20Part1.pdf Retrieved April 2018.
25.Pursel, K., &Xie, H. (2014). Patterns and pedagogy: Exploring student blog use in higher education. Contemporary Educational Technology, 5(2), 96–109.
26.Racthman, P., &Firpo, D. (2011). Using social networking technology to enhance learning in higher education: A case study using Facebook. Paper presented at the 44th Hawaii International Conference on Systems Sciences Hawaii, USA.
27.Ramzan, M. (2004). Does level of knowledge impact Librarians‘Attitude towards
Information Technology (IT) Applications? 2nd International CALIBER. 2004, Dew Dell: 11–13 February.
28.Rifkin,W., Longnecker, N., Leach, J., Davis, L., &Ortia, L. (2009). Motivate students by having them publish in new media: An invitation to Science lecturers to share and test. Paper presented at the Australian Conference on Science and Mathematics Education: Motivating Science Undergraduates — Ideas and Interventions, Sydney, Australia.
29.Rosen, L., & Michelle, W. (1995). Computer availability, computer experience and technophobia among public school teachers. Computer in Human Behaviour, 11, 9-31.
30.Rubina, B., Shakeel, K., &Aqeel, k. (2011). Use of ICT by Students: A Survey of Faculty of Education at IUB.
31.Schacter, J. (1999). The impact of education technology on student achievement: what the most current research has to say. Santa Monica, CA: Milken Exchange on Education technology.
32.Tay, E., & Allen, M. (2011). Designing social media into university learning: Technology of collaboration or collaboration for technology? Educational Media International, 48(3), 151–163.
33.Tower, M., Latime, S., & Hewitt, J. (2014). Social networking as a learning tool: Nursing students' perception of efficacy. Nurse Education Today, 34, 1012–1017.
34.Virkus, S. (2008). Use of Web 2.0 technologies in LIS education: Experiences at Tallinn University, Estonia. Electronic Library and Information Systems, 42(3), 262– 274.
35.Volman, M. (2005). Variety of roles for a new type of teacher. Educational technology and the teacher profession. Teacher and Teacher Education, 21, 15-31.
36.Watson, M. (1986). The Impact Report of Evaluation of the Impact of Information Technology on Children‘s Achievement in Primary and Secondary Schools. London: Kings College.
37.Watson, M. (1998). Blame the Technocentric artifact! What research tells us about problems inhibiting teacher use of IT. In G. Marshall, & M. Ruohonen (Eds.), Capacity Building for IT in Education in Developing Countries (pp. 185-192), London: Chapman & Hall.
Mutual Funds in India: A Comparative analysis of Mid cap
Mutual fund schemes
Dr. NilamPanchal
Abstract
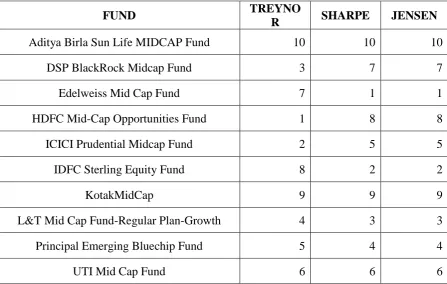
The present paper analyses the performance of 10 mid cap mutual funds with its benchmark index as Nifty free float Midcap 100 for 12 months period starting from April, 2017 to March, 2018. Monthly NAV of different schemes have been used to calculate the returns from the fund schemes. Nifty free float midcap 100 has been used for market portfolio. The historical performance of the selected schemes were evaluated on the basis of Sharpe, Treynor, and Jensen’s measure whose results will be useful to investors for taking better investment decisions.
Key Words: Mutual Funds, Portfolio
Introduction
Among many of the financial instruments, mutual fund is one of the most attractive financial investment instruments that play a vital role in the economy of a country. Mutual fund schemes provide new opportunities for investors. During the last few years many extraordinary and rapid changes have been seen in the Mutual fund industry. Therefore, due to the changed environment it becomes important to investigate the mutual fund performance. The need for evaluating the performance of mutual fund schemes in India to see whether the mutual fund schemes are outperforming or underperforming than the benchmark and to see the competency of schemes to make out a strong case for investment. For example, The Assets Under Management (AUM) of the Indian mutual fund (MF) industry witnessed an exceptional growth of 42% in FY2017. According to Association of Mutual Funds in India (AMFI) data, AUM grew from Rs. 12.3 lakh crore in March 2016 to Rs. 17.5 lakh crore in March 2017. The Quarterly Average Assets under Management (QAAUM) also registered a growth of 8% in the last quarter of FY2017. The growth can be attributed to strong retail participation and overall market gains.
Mid cap mutual funds primarily invest in mid cap stocks of companies whose market capitalization falls below top 100 companies in India. These funds are regarded risker tan large caps but safer than small caps. During Bullish phases, these funds can give you sky high returns but during bearish phases, these tend to lose more than small caps and usually wiping out fortunes. Mid cap equity funds often operates in niche segments of the economy and have the potential to become future large caps.
Basically, long-term investors benefit hugely in Midcaps. Overall, Midcaps tend to go through high volatility but, at the end of the day who has remained a long-term investor has amassed considerable wealth. The Midcap index has given an amazing 400% in the last one decade at the same time the large cap (Nifty 50) has given a return of 350%, so we are not really that far in terms of return, but in terms of volatility, the large cap has had a