RESEARCH ARTICLE
t
Post-emergence herbicides are cost effective for
vineyard floor management on the Central Coast
by Laura Tourte, Richard Smith, Larry Bettiga, Tiffany Bensen, Jason Smith and Daryl Salm
Central Coast growers are under in-creasing scrutiny and regulatory pres-sure to manage herbicide use because of their farmland’s proximity to the Monterey Bay and National Marine Sanctuary. Vineyard floor manage-ment practices typically consist of a combination of weed control strate-gies, including herbicide use and cover crops. We evaluated nine combina-tions of vineyard floor management practices for their impacts on fruit yield, quality and costs. We found that compared to the grower stan-dard, post-emergence herbicide treatments generally used smaller amounts of chemicals and were less costly, with similar yields and quality.
G
rowers along California’s Central Coast are under increasing pres-sure to keep herbicides from contami-nating groundwater, and in turn, the Monterey Bay and National Marine Sanctuary. In vineyards, weed control generally consists of both pre- and post-emergence herbicide applications. The common pre-emergence herbicide simazine has been identified as a con -tamination risk for groundwater. This project was initiated to compare the long-term effects of floor management practices and alternative weed-control strategies on vineyard productivity over five growing seasons (2001 to 2005). In addition, we evaluated the as-sociated economics over four growing seasons (2002 to 2005).Vineyard floor management
Vineyard floors are managed to facilitate cultural practices and reduce competitive effects from noncrop veg-etation. In California, key strategies for managing vineyard floors and suc -cessfully producing wine grapes are
herbicide use, mechanical weed control and cover-cropping (Elmore et al. 1997; Ingels et al. 1998). These practices, used alone or in combination, must be considered carefully because they have both direct and indirect costs as well as production implications for wine grapes. A grower’s selection of vineyard floor management practices is based on numerous factors includ-ing production philosophy, terrain, soil type, irrigation system, economics, risk management, and environmental and regulatory pressures.
Weeds compete with grapevines for water, soil nutrients and sometimes sunlight. Weed competition is most severe during the first 3 years of vine establishment, when root growth is limited. However, dense weed popu-lations can also reduce growth and yields in well-established vineyards (Hembree et al. 2006). In addition, vineyards with high weed populations may require additional water and fer -tilizer to maintain production (Lanini and Bendixen 1992).
Cover crops may be either planted, or resident, vegetation in vineyard row middles. In vineyards, cover crops: benefit vine growth and productivity (Costello and Daane 1997; Hirschfelt et al. 1993); reduce nutrient loss and cycle nitrogen for crop growth (Christensen 1971; Hirschfelt et al. 1993; Bettiga et al. 2006); and improve soil structure and prevent erosion (Gaffney and van der Grinten 1991; Bettiga et al. 2006). Because growers recognize the im-portance of cover crops for producing grapes, reducing erosion and improving water quality, more than 90% of Central Coast vineyards are cover-cropped. However, due to the low rainfall in this area, cover crops are typically planted in narrower bands than in other parts of the state to reduce competition with the vines for soil water and nutrients. Economics of grape production
The economic aspects of wine grape production add another layer of com-plexity to selecting floor management strategies. This includes evaluating:
Vineyard floors are managed to prevent competition from vegetation that can inhibit grape yields and quality.
(1) the cost and ease of implementing a practice, (2) the resulting weed popula-tion dynamics and their effect on crop yields and quality and (3) the level of risk or uncertainty associated with a technique, especially if it is a new or unknown technology (Bosch and Pease 2000). Growers use herbicides to manage risk because they reduce variability in management costs and yield, and there-fore income, even though herbicide use may result in added costs in some situ-ations (Olson and Eidman 1992). When multiple options for weed control exist, growers often consider trade-offs, or conflicting objectives that include direct financial costs and benefits along with indirect environmental and social costs and benefits, such as soil erosion and water quality (Wiles 2004).
This article examines how three weed management and three cover crop sys-tems affect the costs of weed control in Central Coast wine grape production. Management practices
Research site.The research was ini-tiated in fall 2000, in a drip-irrigated vineyard near Greenfield in Monterey County. Greenfield has a Mediterranean climate, with annual rainfall ranging from 4 to 8 inches. The vineyard was es-tablished in 1996 with Vitis vinifera L. cv. Chardonnay on Teleki 5C (V.berlandieri Planch. × V. riparia Michx.) rootstock. Vine spacing was 8 feet between rows and 6 feet within rows. The soil was el-der loam with gravelly substratum.
Experimental design.The in-row weed control treatments were: (1) cultivation, (2) post-emergence weed control only (glyphosate at 2.0% plus oxyfluorfen at 1.0%) and (3) pre-emergence and post-pre-emergence weed control (simazine at 1.8 pounds active ingredient per acre plus oxyfluorfen at 1.0 pound active ingredient per acre; and glyphosate at 2.0% plus oxyfluor -fen at 1.0%, respectively). Cultivations and herbicide applications were timed in accordance with grower practices and label rates. Cultivations were per-formed as needed during the growing season (March through October) using a Radius Weedercultivator (Clemens and Company, Wittlich, Germany). Cultivation consisted of a metal knife held perpendicular to the direction of
[image:2.612.233.581.73.320.2]the tractor movement, and inserted slightly below the soil surface to sever weed shoots from their roots. Pre-emergence herbicides were applied with a standard spray rig in fall or winter. Post-emergence herbicides were applied in spring, summer or fall as needed with a Patchen Weedseeker light- activated sprayer (NTech Industries, Ukiah, Calif.); spray volume varied on a per-acre basis depending on weed cover. Row-middle cover crop treatments were: (1) no cover crop (bare ground), (2) ‘Merced’ rye (Secale cereale L.) and (3) ‘Trios 102’ triticale (× Triticolsecale Wittm. Ex A. Camus). Cover crops were planted with a vineyard seed drill in the 32-inch centers of the 8-foot-wide rows just before the start of the rainy season in November of each year, from 2000 to 2005. Cover crops were mowed in spring to provide frost protection for the vines, and senesced in sum-mer. Prior to planting cover crops each November, row middles were disked to incorporate the previous year’s cover crop and stubble, and to prepare the
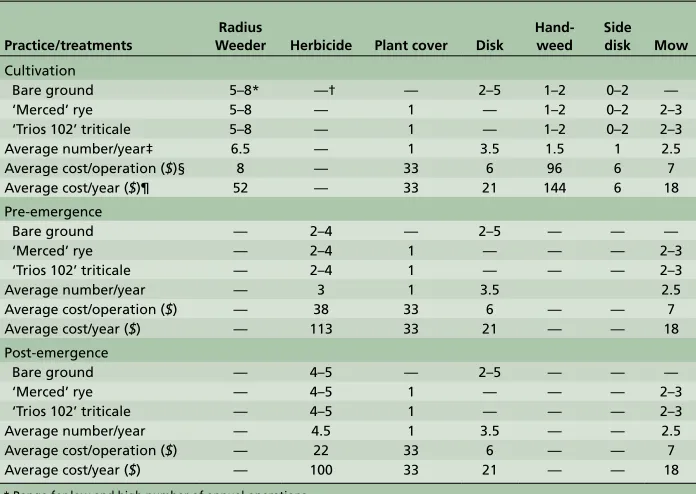
TABLE 1. Number of annual floor management operations and average costs, 2002–2005
Practice/treatments
Radius
Weeder Herbicide Plant cover Disk
Hand- weed
Side disk Mow
Cultivation
Bare ground 5–8* —† — 2–5 1–2 0–2 —
‘Merced’ rye 5–8 — 1 — 1–2 0–2 2–3
‘Trios 102’ triticale 5–8 — 1 — 1–2 0–2 2–3
Average number/year‡ 6.5 — 1 3.5 1.5 1 2.5
Average cost/operation ($)§ 8 — 33 6 96 6 7
Average cost/year ($)¶ 52 — 33 21 144 6 18
Pre-emergence
Bare ground — 2–4 — 2–5 — — —
‘Merced’ rye — 2–4 1 — — — 2–3
‘Trios 102’ triticale — 2–4 1 — — — 2–3
Average number/year — 3 1 3.5 2.5
Average cost/operation ($) — 38 33 6 — — 7
Average cost/year ($) — 113 33 21 — — 18
Post-emergence
Bare ground — 4–5 — 2–5 — — —
‘Merced’ rye — 4–5 1 — — — 2–3
‘Trios 102’ triticale — 4–5 1 — — — 2–3
Average number/year — 4.5 1 3.5 — — 2.5
Average cost/operation ($) — 22 33 6 — — 7
Average cost/year ($) — 100 33 21 — — 18
* Range for low and high number of annual operations. † Operation not used.
‡ Average number of operations per year. § Cash costs rounded to nearest dollar.
¶ Based on number of operations and cumulative cash costs.
seedbed. Bare-ground middles were kept free of weeds by periodic disking during the year (table 1).
Weed control (in-row main plot) and cover crop (row-middle subplot) treatments were arranged in a three-by-three split-block design with three replicate blocks covering a total of 23 vineyard rows, or 7 acres. Each block contained six vine rows and six adja-cent middles. Weed control treatments were applied along the entire length of each vine row, which each had roughly 300 grapevines. Cover crop treatments were established along one-third of each middle and were continuous across the main plot treatments in each block. Each replicate main plot–by- subplot treatment combination included roughly 100 grapevines. Weed control data was collected under the vine rows (main plots) four to five times from spring through fall. Percentage vegeta-tive cover and plant diversity were estimated using a line-intercept tech-nique. Plant species intersecting points at 12-inch intervals along a 100-foot
transect were recorded in each plot, or in 18% of each plot.
Statistics. Yield data and quality
were analyzed using ANOVA with mean separation by Duncan’s multiple range test. Multiple year analyses were performed by utilizing a split-plot de-sign, with weed control as the main plots and cover crops as subplots. Analysis of variance was used to make across-treatment comparisons for the cover of key weeds.
Economics. Partial budget analyses were performed using Budget Planner Software for the four growing seasons from 2002 to 2005 for each of nine vine-yard floor management practice treat -ments. Data was collected by main plot and subplot, transformed and reported on a per-acre basis for the timing of each operation, equipment type and use (including fuel, lubrication and re-pairs), material inputs (herbicides and seed), labor hours (machine and field) and interest on operating capital. Data was entered into Budget Planner, which generated tables estimating annual cash costs per acre for each treatment’s op-erations and inputs. We also calculated the average cost per operation and per year, and annual and cumulative cash costs per acre by treatment.
Weed control
[image:3.612.208.557.83.135.2]Because the grower had used the same weed control strategy since es-tablishing the vineyard 4 years before our experiment began, the initial weed population was assumed to be uniform across the experimental site. However, over the course of the 5-year trial, the three weed control strategies developed distinct weed communities. In each case, weeds that were less susceptible
TABLE 2. Mean percentage cover of three selected weeds in each weed control treatment, summer and fall 2001–2005*
Weed control treatments Common purslane Horseweed Yellow nutsedge
Cultivation 11.5a 0.2a 4.3a
Pre-emergence 0.7b 3.2a 7.3a
Post-emergence 0.1b 4.0a 4.9a
* Values within a column followed by the same letter are not different (Fisher’s protected LSD test, α = 0.05). 25
20
15
10
5
0 c
c
Year
Cover (%)
ba a
bc
[image:3.612.209.560.149.686.2]2001 2002 2003 2004 2005
Fig. 1. Mean percentage cover of common purslane by year in the vine row in summer and fall weed evaluations. Bars with the same letter are not significantly different (Fisher’s protected LSD test, α = 0.05).
To assess the effectiveness of various vineyard floor management strategies, the authors compared pre- and post-emergence herbicide treatments with cultivation in the rows, and several different cover crops in the middle. The primary weeds in the Monterey County vineyard were yellow nutsedge, horseweed and common purslane.
Crop growth, yield and quality The weed control treatments that we studied had no effect on vine growth. While cover crop treatments also had no significant effect on vine growth overall, the ‘Trios 102’ triticale treatment significantly reduced prun -ing weights in 2001 and 2005. Prun-ing weights are a measurement of sea-sonal growth. The lowered pruning weights that we found may be due to the fact that the ‘Trios 102’ triticale grows later and so uses more soil wa-ter than the rye.
No differences in crop yields or fruit composition were measured from 2000 to 2005 that could be attributed to the weed control treatments. Cover crop treatments, when averaged over the 5 years, also had no significant effect on yield or fruit composition, although in 2001 and 2004 there was a reduction in berry size with the triticale treatment.
Cover crops may compete with grapevines for water and nutrients, and this competition may be benefi -cial or detrimental to
vine productivity and fruit quality depend -ing on the amount of soil moisture available during the growing season. In this study, it appears that irrigation management practices were able to overcome the impact of water use by the cover crop, and fruit production losses were avoided.Higher water costs may be asso-ciated with this result, however, and irrigation practices were not part of the economic analysis for this experiment. Economic impacts
The effectiveness of in-row weed control or lack thereof affected the economics of each strat-egy.Costs varied by year in response to differing levels of weed pressure and the timing of weed
control practices. Fig. 2. (A) Annual and (B) cumulative cash costs per acre, by treatment.
450
400
350
300
250
200
150
100
50
0
1,100
1,000
900
800
700
600
500
400
300
200
100
0
B (cumulative) A (annual)
Year
Cash costs per acre ($)
Cash costs per acre ($)
2002 2003 2004 2005
Cultivation Bare Rye Trios Pre-emergence
Bare Rye Trios Post-emergence
Bare Rye Trios to that particular weed control
strat-egy increased, most notably common purslane (Portulaca oleracea), horseweed (Conyza canadensis) and yellow nutsedge (Cyperus esculentus).
Purslane.The cover ofcommon
purslane was significantly greater in the cultivation treatment than the post-emergence and pre-emergence treatments (table 2). In the cultivation treatment, this weed increased dra-matically during the first 4 years of the trial (fig. 1). Purslane was likely able to produce large amounts of seed since it can set seed in as little as 3 weeks, and the weeds were only cultivated roughly once a month (Haar and Fennimore 2003). During the fourth and fifth years of the trial, increased field labor for hand-weeding was required to bring this weed under control and minimize its potential to compete with grape-vines for water and nutrients.
Horseweed.The overall percentage
cover of horseweed was not signifi -cantly different in any treatment during the 5 years of this trial (table 2). Both cultivation and pre-emergence appli-cations of simazine and oxyfluorfen provided good control of this weed throughout the trial. However, by the second growing season, horseweed populations had increased in the post-emergence treatment (data not shown) due to inadequate control with glyphosate and oxyfluorfen. To bring this weed under control in the post-emergence treatment, it was necessary to include an application of glufosinate (at 3% v/v) in early summer 2002, and in late spring or early summer in all sub-sequent years.
Yellow nutsedge.The most trouble-some weed in the pre-emergence treatment was yellow nutsedge, which was not controlled at all by the pre-emergence application of simazine and oxyfluorfen. Additional summer herbicide applications were used to manage this weed, which resulted in higher overall costs when compared to the post-emergence treatments. Because additional herbicide applica-tions were made, the percentage cover of yellow nutsedge over the 5 years of the trial did not significantly differ from the other weed control treat-ments (table 2).
Annual cash costs.The three weed control treatments had similar annual cash costs per acre in the second and third years of the trial (fig. 2A). However, in the fourth and fifth years, costs for the cultivation treatment dramatically increased by $160 and $210 per acre. This result is explained by the steady increase in percentage cover of common purslane, which peaked in 2004, and the concomitant need for supplemental labor to hand-weed around the vines (figs. 1 and 2A).
In general, the post-emergence treat-ment was the least costly of the three weed control treatments.The exception was in the fifth year of the study, when the cost of the pre-emergence treat-ment was slightly lower (fig. 2A). This is because by the 2005 growing season, persistent horseweed populations pre-sented particular control challenges, and resulted in the need for higher ap-plication rates of the more costly herbi-cide glufosinate.
[image:4.612.354.576.390.717.2]cumulative cash costs, ranging from $899 to $1,032 per acre over the 4-year study period (fig. 2B). The pre- emergence treatment had the next highest cumulative cash costs, ranging from $555 to $690 per acre. The post-emergence treatment was least expen-sive, at $498 to $633 per acre.
In total, the post-emergence treat-ments generally maintained good weed control and used smaller amounts of chemicals than the pre-emergence treatment.In addition, the post-emergence treatment achieved adequate weed control without the high-risk herbicide simazine used in the pre-emergence treatment.
Cover crop costs. Annual costs for preparing the ground and planting row-middle cover crops averaged $33 per acre per year in this trial (table 1). In years with low weed densities, cover crop costs ranged from between 20% and 30% of total floor-management costs; the cost range was lower in years with higher weed densities. The cost of planting and maintaining a cover crop in vineyards does not appear to dampen grower interest. In this pro-duction system, the cost of a cover crop may not be an annual expense because growers often manage cover crops to set seed, thus reducing the need to re-seed each year.
Choosing effective strategies
This production, weed control and economic information can assist
grow-ers in selecting practices and strate-gies for vineyard floor management. Weed control and cover crops have direct short-term financial costs and production implications; they have also been shown to have indirect and longer-term benefits for crop produc -tivity, soil management, water quality and economic profitability. Affiliated research has shown beneficial impacts on nutrient cycling and soil microbiol-ogy (Baumgartner et al. 2005; Bettiga et al. 2006). This study has shown that weed control strategies without the inclusion of high-risk herbicides can be used effectively and economically to manage vineyard floors.
L. Tourte, R. Smith and L. Bettiga are Farm Advisors, UC Cooperative Extension (UCCE), Santa Cruz, Monterey and San Benito coun-ties; T. Bensen is former Staff Research As-sociate, UCCE Monterey County; and J. Smith and D. Salm are growers and managers, Val-ley Farm Management, Soledad, Calif. The Viticulture Consortium Program and the California Department of Pesticide Regulation (DPR) Reduced Risk Pest Manage-ment Grant Program funded this research. Thank you to Dave Miltz, Pat Headley and Adelia Barber, Research Assistants, UCCE Monterey County, for their contributions and assistance. Thanks also to Steve Fennimore, Extension Specialist, UC Davis Department of Plant Sciences, for his editing advice, and Karen Klonsky, Extension Specialist, UC Davis Department of Agricultural and Resource Economics, for her suggestions and assistance with the tables and graphs.
References
Baumgartner K, Smith R, Bettiga L. 2005. Weed control practices and cover crop management affect mycorrhizal colonization of grapevine roots and arbuscu-lar mycorrhizal fungal spore populations in a California vineyard. Mycorrhiza 15:111–9.
Bettiga L, Smith R, Cahn M, Tourte L. 2006. Evalua-tion of the long-term impact of vineyard floor manage-ment practices on crop production and quality, weed control, soil and water parameters, and the economics of wine grape production. Viticulture Consortium Final Research Report. UCCE Monterey County. 44 p.
Bosch DJ, Pease JW. 2000. Economic risk and water quality protection in agriculture. Rev Agri Econ 22(2):438–63.
Christensen P. 1971. Modified sod cover cropping in vineyards. Blue Anchor 48(3):20–2.
Costello MJ, Daane KM. 1997. Cover crops affect vine growth and vineyard microclimate. Grape Grower 29(8):22–5.
Elmore CL, Roncoroni R, Wade L, Verdegaal P. 1997. Mulch plus herbicides effectively control vineyard weeds. Cal Ag 51(2):14–8.
Gaffney FB, van der Grinten M. 1991. Permanent
cover crop for vineyards. In: Hargrove WL (ed.). Cover
Crops for Clean Water. Soil and Water Conservation So-ciety, Ankeny, IA. p 32.
Haar MJ, Fennimore SA. 2003. Evaluation of
inte-grated practices for common purslane (Portulaca
olera-cea) management in lettuce. Weed Tech 17:229–33.
Hembree KJ, Ingels CA, Lanini WT. 2006. Weed management. UC IPM Pest Management Guidelines. www.ipm.ucdavis.edu/PMG/r302700111.html.
Hirschfelt D, Peacock W, Christensen P, Bianchi M. 1993. Vineyard floor management, nitrogen uptake. Grape Grower 25(8):18–20.
Ingels CA, Bugg RL, McGourty GT, Christensen LP
(eds.). 1998. Cover Cropping in Vineyards: A Grower’s
Handbook. ANR Pub 3338. 162 p.
Lanini T, Bendixen W. 1992. Characteristics of im-portant vineyard weeds. In: Flaherty DL, Christensen LP,
Lanini WT, et al. (eds.). Grape Pest Management (2nd
ed.). ANR Pub 3343. 412 p.
Olson KD, Eidman VR. 1992. A farmer’s choice of weed control method and the impacts of policy and risk. Rev Agri Econ 14(1):125–37.
Wiles LJ. 2004. Economics of weed management: Principles and practices. Weed Tech 18:1403–7.