2922
THE
CIPP
-
SAW
EVALUATION MODEL DESIGN IN
MEASUREMENT THE EFFECTIVENESS OF E-LEARNING
AT HEALTH UNIVERSITIES IN BALI
1I PUTU WISNA ARIAWAN, 2MADE KURNIA WIDIASTUTI GIRI, 3*DEWA GEDE HENDRA DIVAYANA
1Department of Mathematics Education, Universitas Pendidikan Ganesha, Indonesia
2Department of Medical, Universitas Pendidikan Ganesha, Indonesia
3Department of Information Technology Education, Universitas Pendidikan Ganesha, Indonesia
*Correspondence E-mail: [email protected]
ABSTRACT
This research aims to provide information about the design of an evaluation model that is suitable to be used to evaluate the level of effectiveness of the application of e-learning in health colleges in Bali. The evaluation model intended is called CIPP-SAW, where this model is a combination of the CIPP (Context -Input-Process-Product) evaluation model with SAW (Simple Additive Weighting) method. The CIPP-SAW
model is capable of presenting accurate calculation results in determining evaluation aspects which are classified based on preference values ranging from the lowest to the highest value. This research was carried out with a development approach used the Borg and Gall method which focused on three stages, including: 1) design development; 2) initial trial; and 3) initial trial revision. Subjects that were involved in the stage of design development and stage of initial trial revision were three people (all researchers). Subjects that were involved in the stage of initial trial were 34 respondents (4 knowledge experts and 30 lecturers). The instrument that was used in data collection was a questionnaire consisting of 10 question items. The analysis technique was used was the quantitative descriptive, with the results of the analysis showed the evaluation model design that was classified as good with an effectiveness percentage was 88.00%.
Keywords: CIPP, SAW, Evaluation Model, E-Learning, Health Universities
1. INTRODUCTION
The implementation of ICT in the industrial revolution era 4.0 is an essential thing to do because all activities carried out by humans today require a quick, easy, and optimal solution through an integrated, predictable and real-time computer system. This matter is following the statement of Khan and Turowski [1] which states that the scenario of the industrial revolution 4.0 can be running optimally in solving the human life problems as long as the computerized system can work in real-time, integrated, and easily predict the threats or possibilities of risks that occur in the future.
Likewise, also in higher education, the use of information technology has supported the teaching process carried out by lecturers, where conventional teaching methods have gradually shifted towards computer-assisted learning. This matter is following the opinion of Neo et al. [2], which stated that
current the conventional teacher-centered teaching methods had transform become student-centered information technology-based teaching methods.
One ICT-based learning model that is commonly used in the learning process in higher education is e-learning. E-learning is computer-assisted learning that is used to help student-centered collaborative learning processes. That matter is following the opinion of Jethro, Grace, and Thomas [3] which stated that E-learning could be seen as student-centered learning and it was able to create a collaborative learning climate with the learning process that utilizes computer assistance.
The existence of e-learning in the field of education can provide an opportunity for everyone to be able to learn and share knowledge resources with easy access without being limited by distance and time. This matter is in accordance with the opinion of Lin et al. [4] which in principle stated
2923 resources in various fields without being limited by time and space, so that the learning model could reduce the gap of people to it was able to access knowledge and get a quality education. That Lin et al.’s statement was also reinforced by the Reeves et al.’s statement [5] which stated that the existence of
e-learning could save education costs because the students could learn from home without must be come to school, so the cost of travel to school could be minimized.
The implementation of e-learning in higher education must be supported by adequate specifications of digital tools and readiness of human resources to use them so that the learning process can run optimally. This matter is in accordance with the opinion of Arkorful and Abaidoo [6] which stated that in the teaching and learning process based on e-learning model were needed the digital devices with appropriate specifications and readiness of the user's ability to operate those the digital devices, so the effectiveness of implementation e-learning could be realized well.
Even so, in reality, there are still many universities (especially in health universities in Bali) that have not been effective in implementing this learning model in the learning process. The cause of those ineffectiveness needs to be sought with use the appropriate evaluation model. Some evaluation model that can be used to measure the implementation of e-learning optimally, such as formative summative and CIPP model. But if only
relying on the evaluation components of each of those model, then it is still difficult to determine the dominant aspects that need attention to be improved. Based on those problems, it is necessary to determine the innovation of evaluation model that can be used to determine the dominant aspects that are prioritized for revision in realize the effectiveness of the implementation of e-learning in health universities.
The evaluation model innovation that can be designed is in the form of the CIPP-SAW model
which is a combination of educational evaluation model with artificial intelligence model so that it can determine the dominant aspects in each component context, input, process, and product based on the highest vector value through the results of SAW calculation. Based on that
innovation, the purpose of this study was to found the form of innovation design from modified the
CIPP (Context-Input-Process-Product) evaluation
model with SAW (Simple Additive Weighting)
which could be used as an evaluation model of the
e-learning in health universities. The problem statement of this study was “how was the design of the CIPP-SAW model that was used to measure the
effectiveness of the e-learning implementation in health colleges, especially those in Bali?”.
This research was motivated by several results and constraints that were found in relevant studies that had conducted by several previous researchers. Research that was conducted by Tymczyńska [7] showed that the Moodle platform could be used to support the collaborative learning process that allows students to create learning communities independently outside the classroom. The obstacles that were found in the Tymczyńska’s research were it didn’t yet show the input and process components that were used to evaluate online learning activities, because in this research only focus on context and product evaluation components. Research that was conducted by Zhang et al. [8] explained that the
suitable platform for e-learning of social medicine is Moodle, where Moodle can provide modules for self-learning and modules for mixed learning. The constraints that were found in Zhang et al.’s
research were it didn't yet discuss the dominant aspects that need to be prioritized for reforming the e-learning of social medicine starting from context evaluation components, input evaluation components, process evaluation components, product evaluation components. Evaluation that was carried out in Zhang et al.’s research was only
limited to show the correlation that was occurred between the log of online activities with the test results that was obtained by students. The research that was conducted by Dhir et al. [9] also explained
things which in principle was the same as Zhang et al. E-learning provides the self-learning modules
and blended learning. The self-learning module enables students to learn actively and explore learning resources themselves through full online, while the blended learning module makes it possible the students doing learning together both with the teachers in full face-to-face through online. The limitations that were found in Dhir et al.’s
research were it didn't yet explain about the types of evaluation model that could be used to measure the e-learning effectiveness, because Dhir et al.’s
research only focuses to explained the resolution, characteristics, advantages, and perceptions of users to e-learning.
Based on previous research problems and relevant research, the authors were interested and felt it was important to research and provide essential information to readers about the design of
2924 concept to obtained an overview of how to measure the e-learning effectiveness in the several health universities in Bali.
2. RESEARCH METHODOLOGY
Generally, this research used a development approach, with ten development stages of the Borg and Gall method. However, especially in 2019, this research focused on several stages, including 1) design development; 2) initial trial; 3) initial trial revision. During the design development stage, the initial design of the evaluation model was made by combining the concept of CIPP with SAW. During
the design development stage, all members of the researcher had expertise in the fields of education evaluation, health, and informatics engineering education.
In the initial trial phase, it was conducted the assessment on the initial design of the CIPP-SAW
evaluation model that involved two educational evaluation experts, two informatics education experts, and 30 lecturers from health universities in the Province of Bali. Determination of subjects that involved in conducting the initial trial used a purposive sampling technique that determined the parties involved and comprehending thoroughly about the object being studied or assessed. In the initial trial revision phase, the trial results were revised on the suggestions given by experts and lecturers who had made an initial assessment of the design of the CIPP-SAW evaluation model. The
time that was needed to make a model design for one week. The time that was needed to conduct an initial trial for one month. The time that was needed to revised the model design that according to the recommendations of experts and lecturers for one week. The location of this research was carried out at six health universities that were located in 4 districts in the province of Bali. As for the six health universities, including STIKES Buleleng that
is located in Buleleng Regency; STIKES Bina Usada Bali that is located in Badung Regency; STIKES Wiramedika Bali, STIKES Bali, and
Polytechnic State of Denpasar that is located in Denpasar; as well as STIKES Advaita Medika that
is located in Tabanan Regency. The tool that was
used to conduct an initial trial on the design of the
CIPP-SAW evaluation model in the form of
questionnaires instruments. The questionnaires consist of 10 questions with five answer items that used a Likert scale. The analysis technique that was used in analyzing the results of the answers to the questionnaires was quantitative descriptive, by explained the comparison results of the quality score of the evaluation model design with a
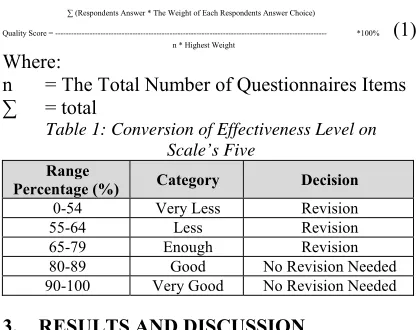
standard reference score that refers to the five-scale quality categorization. The way to determine the design quality score of the model uses the formula of the quantitative descriptive percentage that completely can be seen in equation (1) [10], while the five-scale quality categorization score can be shown in Table 1.
∑ (Respondents Answer * The Weight of Each Respondents Answer Choice)
Quality Score = --- *100% (1) n * Highest Weight
Where:
[image:3.612.312.521.176.341.2]n = The Total Number of Questionnaires Items ∑ = total
Table 1: Conversion of Effectiveness Level on Scale’s Five
Range
Percentage (%) Category Decision
0-54 Very Less Revision 55-64 Less Revision 65-79 Enough Revision 80-89 Good No Revision Needed 90-100 Very Good No Revision Needed
3. RESULTS AND DISCUSSION
The design of the CIPP-SAW evaluation model
design was made using the yEd Graph Editor
2925
Figure 1: The Design of CIPP-SAW Evaluation Model
Figure 1 above showed the design form of the
CIPP-SAW evaluation model that is used to provide
an overview of the mechanism of the evaluation process for the implementation of e-learning in several health universities in the province of Bali. That evaluation model uses a combination of CIPP
evaluation models with one of the decision-making methods, namely, SAW. The CIPP evaluation
model is used as a basis for determining evaluation aspects, while the SAW method is used as the basis
for calculations in determining the dominant aspects that need to be improved in implementing e-learning. The CIPP evaluation model is one of
the educational evaluation models consisting of 4 main components, including context components, input components, process components, and product components. Asfaroh, Rosana, and Supahar
[11] stated that CIPP is the abbreviation of
Context-Input-Process-Product. Aziz, Mahmood, and Rehman [12] stated that the CIPP model is an
effective educational evaluation model that is used to evaluate school services.
The number of aspects that are used in the context, input, and process components in the
CIPP-SAW evaluation model is four aspects, while
for the product components, there are two aspects. Each evaluation aspect is measured those use questionnaires. The measurement results of each aspect are then given the weight of the decision by the experts/decision makers, to proceed with the calculation process using the SAW method in
2926 best method of decision making, and the calculation is simple. Podvezko [14] stated that SAW is the
decision support method that most are used, most simple, and natural.
Experts/decision makers give recommendations based on the results of determining the most
dominant aspects of all aspects of evaluation, starting from the lowest level to the highest level using the SAW method. The calculation process of
the SAW method to determine the dominant aspects
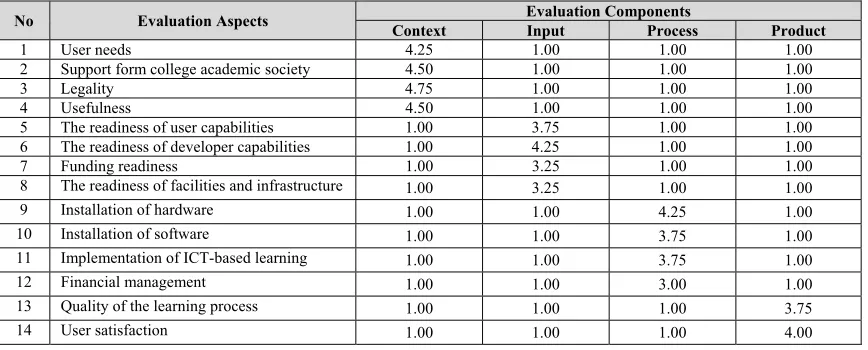
[image:5.612.91.525.181.356.2]can be simulated using simulation data shown in Table 2.
Table 2: The Data of Assessment Average for Each Aspect of Evaluation by Experts
No Evaluation Aspects Evaluation Components
Context Input Process Product
1 User needs 4.25 1.00 1.00 1.00
2 Support form college academic society 4.50 1.00 1.00 1.00
3 Legality 4.75 1.00 1.00 1.00
4 Usefulness 4.50 1.00 1.00 1.00
5 The readiness of user capabilities 1.00 3.75 1.00 1.00 6 The readiness of developer capabilities 1.00 4.25 1.00 1.00
7 Funding readiness 1.00 3.25 1.00 1.00
8 The readiness of facilities and infrastructure 1.00 3.25 1.00 1.00
9 Installation of hardware 1.00 1.00 4.25 1.00
10 Installation of software 1.00 1.00 3.75 1.00
11 Implementation of ICT-based learning 1.00 1.00 3.75 1.00
12 Financial management 1.00 1.00 3.00 1.00
13 Quality of the learning process 1.00 1.00 1.00 3.75
14 User satisfaction 1.00 1.00 1.00 4.00
Based on the data that was shown in Table 2, then the SAW calculation can be carried out to
determine the most dominant aspects to be the priority of improvement. The calculation stages are as follows.
1. Determination of data normalization
At this stage, it begins by identifying aspects that include benefit attributes and cost attributes. Some aspects that are classified as benefit attributes are based on the data in Table 2, including: aspects of the user need, aspects of the support form college academic society, aspects of the legality, aspects of the usefulness, aspects of the readiness of user capabilities, aspects of the readiness of developer capabilities, aspects of the readiness of facilities and infrastructure, aspects of the hardware installation, aspects of the software installation, aspects of the ICT-based learning implementation, aspects of the quality of the learning process, and
aspects of user satisfaction. Aspects classified as cost attributes, including aspects of the funding readiness and aspects of financial management. The next step, normalization calculation is done by using formula (2) [15].
(2)
Where:
rij is the normalized performance rating of the Ai
alternative on the Cj attribute; i=1,2,...,m and
j=1,2,...,n [15].
Based on the formula (2) and the data available in Table 2, the normalization of data can be completed. The normalization calculation process completely can be shown as follows.
r1-1 =
4.25
= 4.25 = 0.895 max{4.25;4.50;4.75;4.50;1.00;1.00;1.00;1.00;1.00;1.00;1.00;1.00;1.00;1.00} 4.75
r2-1 = 4.50 =
4.50
= 0.947 max{4.25;4.50;4.75;4.50;1.00;1.00;1.00;1.00;1.00;1.00;1.00;1.00;1.00;1.00} 4.75
r3-1 = 4.75 = 4.75 = 1.000
max{4.25;4.50;4.75;4.50;1.00;1.00;1.00;1.00;1.00;1.00;1.00;1.00;1.00;1.00} 4.75
r4-1 = 4.50 =
4.50
= 0.947 max{4.25;4.50;4.75;4.50;1.00;1.00;1.00;1.00;1.00;1.00;1.00;1.00;1.00;1.00} 4.75
r5-1 = 1.00 =
1.00
= 0.211 max{4.25;4.50;4.75;4.50;1.00;1.00;1.00;1.00;1.00;1.00;1.00;1.00;1.00;1.00} 4.75
2927
r6-1 = 1.00 = 1.00 = 0.211
max{4.25;4.50;4.75;4.50;1.00;1.00;1.00;1.00;1.00;1.00;1.00;1.00;1.00;1.00} 4.75
r7-1 = min{4.25;4.50;4.75;4.50;1.00;1.00;1.00;1.00;1.00;1.00;1.00;1.00;1.00;1.00} = 1.00 = 1.000
1.00 1.00
r8-1 = 1.00 =
1.00
= 0.211 max{4.25;4.50;4.75;4.50;1.00;1.00;1.00;1.00;1.00;1.00;1.00;1.00;1.00;1.00} 4.75
r9-1 = 1.00 =
1.00
= 0.211 max{4.25;4.50;4.75;4.50;1.00;1.00;1.00;1.00;1.00;1.00;1.00;1.00;1.00;1.00} 4.75
r10-1 = 1.00 =
1.00
= 0.211 max{4.25;4.50;4.75;4.50;1.00;1.00;1.00;1.00;1.00;1.00;1.00;1.00;1.00;1.00} 4.75
r11-1 = 1.00 = 1.00 = 0.211
max{4.25;4.50;4.75;4.50;1.00;1.00;1.00;1.00;1.00;1.00;1.00;1.00;1.00;1.00} 4.75
r12-1 = min{4.25;4.50;4.75;4.50;1.00;1.00;1.00;1.00;1.00;1.00;1.00;1.00;1.00;1.00} = 1.00 = 1.000
1.00 1.00
r13-1 = 1.00 =
1.00
= 0.211 max{4.25;4.50;4.75;4.50;1.00;1.00;1.00;1.00;1.00;1.00;1.00;1.00;1.00;1.00} 4.75
r14-1 = 1.00 =
1.00
= 0.211 max{4.25;4.50;4.75;4.50;1.00;1.00;1.00;1.00;1.00;1.00;1.00;1.00;1.00;1.00} 4.75
r1-2 = 1.00 =
1.00
= 0.235 max{1.00;1.00;1.00;1.00;3.75;4.25;3.25;3.25;1.00;1.00;1.00;1.00;1.00;1.00} 4.25
r2-2 = 1.00 =
1.00
= 0.235 max{1.00;1.00;1.00;1.00;3.75;4.25;3.25;3.25;1.00;1.00;1.00;1.00;1.00;1.00} 4.25
r3-2 = 1.00 = 1.00 = 0.235
max{1.00;1.00;1.00;1.00;3.75;4.25;3.25;3.25;1.00;1.00;1.00;1.00;1.00;1.00} 4.25
r4-2 = 1.00 =
1.00
= 0.235 max{1.00;1.00;1.00;1.00;3.75;4.25;3.25;3.25;1.00;1.00;1.00;1.00;1.00;1.00} 4.25
r5-2 = 3.75 = 3.75 = 0.882
max{1.00;1.00;1.00;1.00;3.75;4.25;3.25;3.25;1.00;1.00;1.00;1.00;1.00;1.00} 4.25
r6-2 = 4.25 =
4.25
= 1.000 max{1.00;1.00;1.00;1.00;3.75;4.25;3.25;3.25;1.00;1.00;1.00;1.00;1.00;1.00} 4.25
r7-2 = min{1.00;1.00;1.00;1.00;3.75;4.25;3.25;3.25;1.00;1.00;1.00;1.00;1.00;1.00} = 1.00 = 0.308
3.25 3.25
r8-2 = 3.25 = 3.25 = 0.765
max{1.00;1.00;1.00;1.00;3.75;4.25;3.25;3.25;1.00;1.00;1.00;1.00;1.00;1.00} 4.25
r9-2 = 1.00 =
1.00
= 0.235 max{1.00;1.00;1.00;1.00;3.75;4.25;3.25;3.25;1.00;1.00;1.00;1.00;1.00;1.00} 4.25
r10-2 = 1.00 =
1.00
= 0.235 max{1.00;1.00;1.00;1.00;3.75;4.25;3.25;3.25;1.00;1.00;1.00;1.00;1.00;1.00} 4.25
r11-2 = 1.00 =
1.00
= 0.235 max{1.00;1.00;1.00;1.00;3.75;4.25;3.25;3.25;1.00;1.00;1.00;1.00;1.00;1.00} 4.25
r12-2 = min{1.00;1.00;1.00;1.00;3.75;4.25;3.25;3.25;1.00;1.00;1.00;1.00;1.00;1.00} = 1.00 = 1.000
1.00 1.00
2928
max{1.00;1.00;1.00;1.00;3.75;4.25;3.25;3.25;1.00;1.00;1.00;1.00;1.00;1.00} 4.25
r14-2 = 1.00 =
1.00
= 0.235 max{1.00;1.00;1.00;1.00;3.75;4.25;3.25;3.25;1.00;1.00;1.00;1.00;1.00;1.00} 4.25
r1-3 = 1.00 =
1.00
= 0.235 max{1.00;1.00;1.00;1.00;1.00;1.00;1.00;1.00;4.25;3.75;3.75;3.00;1.00;1.00} 4.25
r2-3 = 1.00 =
1.00
= 0.235 max{1.00;1.00;1.00;1.00;1.00;1.00;1.00;1.00;4.25;3.75;3.75;3.00;1.00;1.00} 4.25
r3-3 = 1.00 =
1.00
= 0.235 max{1.00;1.00;1.00;1.00;1.00;1.00;1.00;1.00;4.25;3.75;3.75;3.00;1.00;1.00} 4.25
r4-3 = 1.00 =
1.00
= 0.235 max{1.00;1.00;1.00;1.00;1.00;1.00;1.00;1.00;4.25;3.75;3.75;3.00;1.00;1.00} 4.25
r5-3 = 1.00 = 1.00 = 0.235
max{1.00;1.00;1.00;1.00;1.00;1.00;1.00;1.00;4.25;3.75;3.75;3.00;1.00;1.00} 4.25
r6-3 = 1.00 = 1.00 = 0.235
max{1.00;1.00;1.00;1.00;1.00;1.00;1.00;1.00;4.25;3.75;3.75;3.00;1.00;1.00} 4.25
r7-3 = min{1.00;1.00;1.00;1.00;1.00;1.00;1.00;1.00;4.25;3.75;3.75;3.00;1.00;1.00} = 1.00 = 1.000
1.00 1.00
r8-3 = 1.00 = 1.00 = 0.235
max{1.00;1.00;1.00;1.00;1.00;1.00;1.00;1.00;4.25;3.75;3.75;3.00;1.00;1.00} 4.25
r9-3 = 4.25 = 4.25 = 1.000
max{1.00;1.00;1.00;1.00;1.00;1.00;1.00;1.00;4.25;3.75;3.75;3.00;1.00;1.00} 4.25
r10-3 = 3.75 =
3.75
= 0.882 max{1.00;1.00;1.00;1.00;1.00;1.00;1.00;1.00;4.25;3.75;3.75;3.00;1.00;1.00} 4.25
r11-3 = 3.75 =
3.75
= 0.882 max{1.00;1.00;1.00;1.00;1.00;1.00;1.00;1.00;4.25;3.75;3.75;3.00;1.00;1.00} 4.25
r12-3 = min{1.00;1.00;1.00;1.00;1.00;1.00;1.00;1.00;4.25;3.75;3.75;3.00;1.00;1.00} =
1.00
= 0.333
3.00 3.00
r13-3 = 1.00 =
1.00
= 0.235 max{1.00;1.00;1.00;1.00;1.00;1.00;1.00;1.00;4.25;3.75;3.75;3.00;1.00;1.00} 4.25
r14-3 = 1.00 =
1.00
= 0.235 max{1.00;1.00;1.00;1.00;1.00;1.00;1.00;1.00;4.25;3.75;3.75;3.00;1.00;1.00} 4.25
r1-4 = 1.00 = 1.00 = 0.250
max{1.00;1.00;1.00;1.00;1.00;1.00;1.00;1.00;1.00;1.00;1.00;1.00;3.75;4.00} 4.00
r2-4 = 1.00 = 1.00 = 0.250
max{1.00;1.00;1.00;1.00;1.00;1.00;1.00;1.00;1.00;1.00;1.00;1.00;3.75;4.00} 4.00
r3-4 = 1.00 = 1.00 = 0.250
max{1.00;1.00;1.00;1.00;1.00;1.00;1.00;1.00;1.00;1.00;1.00;1.00;3.75;4.00} 4.00
r4-4 = 1.00 = 1.00 = 0.250
max{1.00;1.00;1.00;1.00;1.00;1.00;1.00;1.00;1.00;1.00;1.00;1.00;3.75;4.00} 4.00
r5-4 = 1.00 = 1.00 = 0.250
max{1.00;1.00;1.00;1.00;1.00;1.00;1.00;1.00;1.00;1.00;1.00;1.00;3.75;4.00} 4.00
r6-4 = 1.00 =
1.00
= 0.250 max{1.00;1.00;1.00;1.00;1.00;1.00;1.00;1.00;1.00;1.00;1.00;1.00;3.75;4.00} 4.00
r7-4 = min{1.00;1.00;1.00;1.00;1.00;1.00;1.00;1.00;1.00;1.00;1.00;1.00;3.75;4.00} =
1.00
= 1.000
2929
r8-4 = max{1.00;1.00;1.00;1.00;1.00;1.00;1.00;1.00;1.00;1.00;1.00;1.00;3.75;4.00} 1.00 = 1.00 4.00 = 0.250
r9-4 = 1.00 =
1.00
= 0.250 max{1.00;1.00;1.00;1.00;1.00;1.00;1.00;1.00;1.00;1.00;1.00;1.00;3.75;4.00} 4.00
r10-4 = 1.00 =
1.00
= 0.250 max{1.00;1.00;1.00;1.00;1.00;1.00;1.00;1.00;1.00;1.00;1.00;1.00;3.75;4.00} 4.00
r11-4 = 1.00 = 1.00 = 0.250
max{1.00;1.00;1.00;1.00;1.00;1.00;1.00;1.00;1.00;1.00;1.00;1.00;3.75;4.00} 4.00
r12-4 = min{1.00;1.00;1.00;1.00;1.00;1.00;1.00;1.00;1.00;1.00;1.00;1.00;3.75;4.00} = 1.00 = 1.000
1.00 1.00
r13-4 = max{1.00;1.00;1.00;1.00;1.00;1.00;1.00;1.00;1.00;1.00;1.00;1.00;3.75;4.00} 3.75 = 3.75 = 0.938
4.00
r14-4 = 4.00 =
4.00
= 1.000 max{1.00;1.00;1.00;1.00;1.00;1.00;1.00;1.00;1.00;1.00;1.00;1.00;3.75;4.0
} 4.00
2. Determination of the Matrix
The results of the normalization above are then mapped into the normalization matrix. That matrix is intended can be shown as follows.
0.895 0.235 0.235 0.250 0.947 0.235 0.235 0.250 1.000 0.235 0.235 0.250 0.947 0.235 0.235 0.250
0.211 0.882 0.235 0.250 0.211 1.000 0.235 0.250
R = 1.000 0.308 1.000 1.000 0.211 0.765 0.235 0.250 0.211 0.235 1.000 0.250 0.211 0.235 0.882 0.250 0.211 0.235 0.882 0.250
1.000 1.000 0.333 1.000 0.211 0.235 0.235 0.938 0.211 0.235 0.235 1.000 3. Stage of Ranking
Things that need to be prepared before making a ranking are determining the weights for each evaluation component. After the weight is determined, then the calculation can be done using the following formula (3) [16].
Where:
Vi = preference values for each alternative
Wj = weight of decision makers
rij = a performance rating that has been
normalized from each alternative j = the initial limit value of an iteration n = the final limit value of an iteration
The weight given by experts for context components is 25%, the input component is 25%, the process component is 25%, and product component is 25%. Based on the weight and data in the R matrix, the ranking can be calculated as follows.
V1 = (0.25)(0.895) + (0.25)(0.235) + (0.25)(0.235)
+ (0.25)(0.250) = 0.404
V2 = (0.25)(0.947) + (0.25)(0.235) + (0.25)(0.235)
+ (0.25)(0.250) = 0.417
V3 = (0.25)(1.000) + (0.25)(0.235) + (0.25)(0.235)
+ (0.25)(0.250) = 0.430
V4 = (0.25)(0.947) + (0.25)(0.235) + (0.25)(0.235)
+ (0.25)(0.250) = 0.417
V5 = (0.25)(0.211) + (0.25)(0.882) + (0.25)(0.235)
+ (0.25)(0.250) = 0.395
V6 = (0.25)(0.211) + (0.25)(1.000) + (0.25)(0.235)
+ (0.25)(0.250) = 0.424
V7 = (0.25)(1.000) + (0.25)(0.308) + (0.25)(1.000)
+ (0.25)(1.000) = 0.827
V8 = (0.25)(0.211) + (0.25)(0.765) + (0.25)(0.235)
+ (0.25)(0.250) = 0.365
V9 = (0.25)(0.211) + (0.25)(0.235) + (0.25)(1.000)
+ (0.25)(0.250) = 0.424
V10 = (0.25)(0.211) + (0.25)(0.235) + (0.25)(0.882)
+ (0.25)(0.250) = 0.395
V11 = (0.25)(0.211) + (0.25)(0.235) + (0.25)(0.882)
+ (0.25)(0.250) = 0.395
V12 = (0.25)(1.000) + (0.25)(1.000) + (0.25)(0.333)
+ (0.25)(1.000) = 0.833
V13 = (0.25)(0.211) + (0.25)(0.235) + (0.25)(0.235)
+ (0.25)(0.938) = 0.405
V14 = (0.25)(0.211) + (0.25)(0.235) + (0.25)(0.235)
+ (0.25)(1.000) = 0.420
Based on the results of the ranking calculation,
nj
ij j
i
w
r
V
1
2930 the recapitulation can be made. The ranking recapitulation can be shown in Table 3.
Table 3: The Recapitulation of Ranking Results
Rank V Preference
Value Aspects
1 V12 0.833 Financial management
2 V7 0.827 Funding readiness
3 V3 0.430 Legality
4 V6 0.424 The readiness of developer capabilities
5 V9 0.424 Installation of hardware
6 V14 0.420 User satisfaction
7 V2 0.417 Support form college academic society
8 V4 0.417 Usefulness
9 V13 0.405 Quality of the learning process
10 V1 0.404 User needs
Rank V Preference
Value Aspects
11 V5 0.395 The readiness of user capabilities
12 V10 0.395 Installation of software
13 V11 0.395 Implementation of ICT-based learning
14 V8 0.365
The readiness of facilities and infrastructure
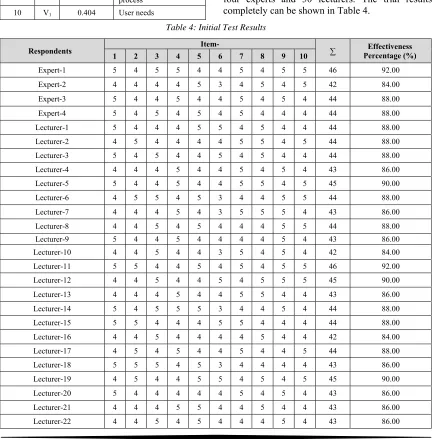
Based on the data in Table 3 above, the aspect of readiness of facilities and infrastructure is the most dominant aspect of getting the top priority to be improved because the preference value shows the lowest score. The aspect that is retained its effectiveness is the financial management aspect because they get the highest score. The initial trial of the CIPP-SAW evaluation model design involved
[image:9.612.90.523.307.746.2]four experts and 30 lecturers. The trial results completely can be shown in Table 4.
Table 4: Initial Test Results
Respondents Item- ∑ Percentage (%) Effectiveness
1 2 3 4 5 6 7 8 9 10
Expert-1 5 4 5 5 4 4 5 4 5 5 46 92.00 Expert-2 4 4 4 4 5 3 4 5 4 5 42 84.00
Expert-3 5 4 4 5 4 4 5 4 5 4 44 88.00
Expert-4 5 4 5 4 5 4 5 4 4 4 44 88.00 Lecturer-1 5 4 4 4 5 5 4 5 4 4 44 88.00 Lecturer-2 4 5 4 4 4 4 5 5 4 5 44 88.00 Lecturer-3 5 4 5 4 4 5 4 5 4 4 44 88.00 Lecturer-4 4 4 4 5 4 4 5 4 5 4 43 86.00 Lecturer-5 5 4 4 5 4 4 5 5 4 5 45 90.00 Lecturer-6 4 5 5 4 5 3 4 4 5 5 44 88.00
Lecturer-7 4 4 4 5 4 3 5 5 5 4 43 86.00 Lecturer-8 4 4 5 4 5 4 4 4 5 5 44 88.00 Lecturer-9 5 4 4 5 4 4 4 4 5 4 43 86.00 Lecturer-10 4 4 5 4 4 3 5 4 5 4 42 84.00 Lecturer-11 5 5 4 4 5 4 5 4 5 5 46 92.00 Lecturer-12 4 4 5 4 4 5 4 5 5 5 45 90.00 Lecturer-13 4 4 4 5 4 4 5 5 4 4 43 86.00
Lecturer-14 5 4 5 5 5 3 4 4 5 4 44 88.00 Lecturer-15 5 5 4 4 4 5 5 4 4 4 44 88.00 Lecturer-16 4 4 5 4 4 4 4 5 4 4 42 84.00 Lecturer-17 4 5 4 5 4 4 5 4 4 5 44 88.00 Lecturer-18 5 5 5 4 5 3 4 4 4 4 43 86.00 Lecturer-19 4 5 4 4 5 5 4 5 4 5 45 90.00
2931
Respondents 1 2 3 4 5 Item- 6 7 8 9 10 ∑ Percentage (%) Effectiveness
Lecturer-23 5 5 4 5 5 5 4 5 5 4 47 94.00 Lecturer-24 5 4 4 4 4 3 5 4 4 5 42 84.00 Lecturer-25 4 5 5 4 5 4 5 5 4 4 45 90.00 Lecturer-26 4 4 4 5 5 4 4 5 5 4 44 88.00
Lecturer-27 5 5 4 5 4 3 5 4 5 5 45 90.00 Lecturer-28 5 4 5 4 5 4 4 5 4 4 44 88.00 Lecturer-29 4 4 4 5 4 5 5 5 4 4 44 88.00 Lecturer-30 5 4 5 4 4 4 4 5 4 4 43 86.00
Average 88.00
Generally, the results of the initial trial design of the CIPP-SAW evaluation model have been
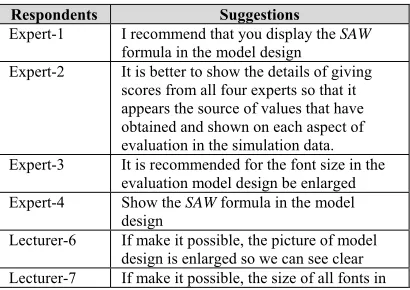
[image:10.612.91.296.380.525.2]going well. The average percentage of effectiveness showed that the evaluation model design was in a good category, so there wasn’t need to make major revisions. However, there were some suggestions given by respondents when conducted the initial trials. Those suggestions can be shown in Table 5.
Table 5: Respondents Suggestions for the Design of the CIPP-SAW Evaluation Model
Respondents Suggestions
Expert-1 I recommend that you display the SAW
formula in the model design
Expert-2 It is better to show the details of giving scores from all four experts so that it appears the source of values that have obtained and shown on each aspect of evaluation in the simulation data. Expert-3 It is recommended for the font size in the
evaluation model design be enlarged Expert-4 Show the SAW formula in the model
design
Lecturer-6 If make it possible, the picture of model design is enlarged so we can see clear Lecturer-7 If make it possible, the size of all fonts in
Respondents Suggestions
the model design must be more is enlarged, so it easier to read. Lecturer-10 If make it possible, the font size is
zoomed, because the font size is too small so difficult to read it.
Lecturer-14 If make it possible, display the SAW
formula in the model design
Lecturer-18 Please enlarge each font that is used on the model design
Lecturer-24 If make it possible, explain how to get the score of each evaluation aspect shown in the simulation data table
Lecturer-27 If make it possible, The model design is equipped with the SAW formula
Based on the suggestions given by the respondents when conducting an initial trial of the design of the CIPP-SAW evaluation model that has
[image:10.612.91.523.563.727.2]shown in Table 5, the next step was carried out a revised of the model design and revised the simulation data. The complete revision of simulation data can be shown in Table 6, while the revised model design can be shown in Figure 2.
Table 6: The Revision of Simulation Data
Evaluation Aspects
Evaluation Components
Context Input Process Product
E1 E2 E3 E4 E1 E2 E3 E4 E1 E2 E3 E4 E1 E2 E3 E4
User needs 5 4 4 4 1 1 1 1 1 1 1 1 1 1 1 1 Average 4.25 Average 1.00 Average 1.00 Average 1.00 Support form college academic
society
4 5 5 4 1 1 1 1 1 1 1 1 1 1 1 1 Average 4.50 Average 1.00 Average 1.00 Average 1.00 Legality 5 5 4 5 1 1 1 1 1 1 1 1 1 1 1 1
Average 4.75 Average 1.00 Average 1.00 Average 1.00 Usefulness 4 5 4 5 1 1 1 1 1 1 1 1 1 1 1 1
Average 4.50 Average 1.00 Average 1.00 Average 1.00 The readiness of user capabilities 1 1 1 1 3 4 4 4 1 1 1 1 1 1 1 1
Average 1.00 Average 3.75 Average 1.00 Average 1.00 The readiness of developer
capabilities
2932
Evaluation Aspects
Evaluation Components
Context Input Process Product
E1 E2 E3 E4 E1 E2 E3 E4 E1 E2 E3 E4 E1 E2 E3 E4
Average 1.00 Average 3.25 Average 1.00 Average 1.00 The readiness of facilities and
infrastructure
1 1 1 1 3 4 3 3 1 1 1 1 1 1 1 1 Average 1.00 Average 3.25 Average 1.00 Average 1.00 Installation of hardware 1 1 1 1 1 1 1 1 4 5 4 4 1 1 1 1
Average 1.00 Average 1.00 Average 4.25 Average 1.00 Installation of software 1 1 1 1 1 1 1 1 4 3 4 4 1 1 1 1
Average 1.00 Average 1.00 Average 3.75 Average 1.00 Implementation of ICT-based
learning
1 1 1 1 1 1 1 1 4 4 4 3 1 1 1 1 Average 1.00 Average 1.00 Average 3.75 Average 1.00 Financial management 1 1 1 1 1 1 1 1 3 4 2 3 1 1 1 1
Average 1.00 Average 1.00 Average 3.00 Average 1.00 Quality of the learning process 1 1 1 1 1 1 1 1 1 1 1 1 4 3 4 4
Average 1.00 Average 1.00 Average 1.00 Average 3.75 User satisfaction 1 1 1 1 1 1 1 1 1 1 1 1 4 4 5 3
[image:11.612.88.525.70.584.2]Average 1.00 Average 1.00 Average 1.00 Average 4.00 Notes: E1 = Expert-1; E2 = Expert-2; E3 = Expert-3; E4 = Expert-4
Figure 2: The Revision Design of CIPP-SAW Evaluation Model
The novelty of this study when is compared with previous studies is to present a CIPP
evaluation model combined with the SAW concept,
so that this model is able to show the calculation process based on artificial intelligence to determine the dominant aspects that are improvements priority in each component evaluation, including context, input, process, and product based on preference value from highest to lowest value. The results of this study are also reinforced by research conducted by Sanjaya et al. in 2019 [17] and Jampel et al. in
2017 [18] which show the accuracy of the SAW
method that used to determine evaluation aspects which are the top priority for improvement.
The results of this study are able to answer the constraints of Tymczyńska's research by showing the existence of input components and process components to evaluate e-learning. Besides, this study was also able to overcome the research constraints of Zhang et al. by presenting SAW
calculations in determining the dominant aspects that are prioritized for improvement in e-learning.
2933 constraints. Those constraints are there aren’t yet evaluation standards set for each CIPP component.
4. CONCLUSIONS
The design and simulation of the CIPP-SAW
evaluation model have been able to describe the accuracy of the process of determining the dominant aspects that need to be improved and must be maintained to obtain the effectiveness of the implementation of e-learning in health universities in Bali. The future work that needs to be done to answer the obstacles in this research is set the clear evaluation standard based on regulations owned by the government of the Republic of Indonesia regarding the use of ICT-based learning in health universities.
5. ACKNOWLEDGMENTS
The authors deliver their sincere gratitude to the Director General of Higher Education of the Indonesia Republic had provided the funding for this research through research grant with contract number 134/UN48.16/LT/2019. The authors also deliver their deepest gratitude to the Rector and the Chair of the Research and Community Service Institute of the Universitas Pendidikan Ganesha
that had provided the opportunities to carry out this research. Besides, the authors are grateful to all those who had helped in the completion of this research.
REFERENCES
[1] A. Khan, and K. Turowski. “A Perspective on Industry 4.0: From Challenges to Opportunities in Production Systems,” In:
Proceedings of the International Conference on Internet of Things and Big Data (IoTBD 2016), 441-448, 2016.
[2] M. Neo, H. Park, M.J. Lee, J.Y. Soh, and J.Y. Oh. “Technology Acceptance of Healthcare E-Learning Modules: A Study of Korean and Malaysian Students’ Perceptions,” TOJET: The Turkish Online Journal of Educational Technology, Vol. 14, No. 2, 181-194, 2015.
[3] O.O. Jethro, A.M. Grace, and A.K. Thomas. (2012). “E-Learning and Its Effects on Teaching and Learning in a Global Age,”
International Journal of Academic Research in Business and Social Sciences, Vol. 2, No. 1,
203-210, 2012.
[4] Y. Lin, T. Tanioka, K. Tanihira, F. Ren, T. Tada, K. Howard, and H. Kobayashi. “An Interactive E-learning System for Practicing Team Care by Interdiciplinary Collaboration,”
Kawasaki Journal of Medical Welfare, Vol.
12, No. 1, 37-44, 2006.
[5] S. Reeves, S. Fletcher, C. McLoughlin, A. Yim, and K.D. Patel. “Interprofessional Online Learning for Primary Healthcare: Findings From A Scoping Review,” BMJ Open, Vol. 7, 37-44, 2006.
[6] V. Arkorful, and N. Abaidoo. “The Role of E-Learning, The Advantages and Disadvantages of its Adoption in Higher Education,” International Journal of Education and Research, Vol. 2, No. 12,
397-410, 2014.
[7] M. Tymczyńska. “Integrating In-Class and Online Learning Activities in a Healthcare Interpreting Course Using Moodle,” The Journal of Specialised Translation, Vol. 12,
148-164, 2009.
[8] Z. Zhang, P. Ran, Y. Peng, R. Hu, and W. Yan. “ Effectiveness of E-learning in Public Health Education: A Pilot Study,”
International Journal of Information and Education Technology, Vol. 5, No. 8,
577-581, 2015.
[9] S.K. Dhir, D. Verma, M.Batta, and D. Mishra. “E-Learning in Medical Education in India,” Indian Pediatrics, Vol. 54, 871-877,
2017.
[10] I.P.W. Ariawan, W. Simatupang, A.M. Ishak, A.A.G. Agung, Suratmin, A. Adiarta, and D.G.H. Divayana. “Development of ANEKA Evaluation Model Based on Topsis in Searching the Dominant Aspects of Computer Learning Quality Determinants,” Journal of Theoretical and Applied Information Technology, Vol. 96, No. 19, 6580-6596,
2018.
[11] J.A. Asfaroh, D. Rosana, and Supahar. “Development of CIPP Model of Evaluation Instrument on the Implementation of Project Assessment in Science Learning,”
International Journal of Environmental & Science Education, Vol. 12, No. 9, 1999-2010,
2017.
[12] S. Aziz, M. Mahmood, and Z. Rehman. “Implementation of CIPP Model for Quality Evaluation at School Level: A Case Study,”
Journal of Education and Educational Development, Vol. 5, No. 1, 189-206, 2018.
[13] Adriyendi. “Multi-Attribute Decision Making Using Simple Additive Weighting and Weighted Product in Food Choice,”
International Journal of Information Engineering and Electronic Business, Vol. 6,
8-14, 2015.
2934
Inzinerine Ekonomika-Engineering Economics, Vol. 22, No. 2, 134-146, 2011.
[15] W. F. Cascio, and H. Aguinis. “Research in Industrial and Organizational Psychology from 1963 to 2007: Changes, Choices, and Trends,” Journal of Applied Psychology, Vol.
93, No. 5, 1062-1081, 2008.
[16] A. Afshari, M. Mojahed and R.M. Yusuff. “Simple Additive Weighting Approach to Personnel Selection Problem,” International Journal of Innovation, Management and Technology, Vol. 1, No. 5, 511-515, 2010.
[17] D.B. Sanjaya, Sukadi, N. Suastika, Y.Sastrawijaya, and I.G.A.P. Kartika. “Utilization of Civic KVS-SAW Evaluation Model in Determining the Effectiveness of Tri Hita Karana in Character Education for Students on Elementary School of Bali Aga,”
Journal of Engineering and Applied Sciences,
Vol. 14, No. 8, 2572-2581, 2019.
[18] I.N. Jampel, I.W. Lasmawan, I.M. Ardana, I.P.W. Ariawan, I.M. Sugiarta, and D.G.H. Divayana. “Evaluation of Learning Programs and Computer Certification at Course Institute in Bali Using CSE-UCLA Based on SAW Simulation Model,” Journal of Theoretical and Applied Information Technology, Vol. 95, No. 24, 6934-6949,