2191
STATISTICAL ANALYSIS OF PROPAGATION
PARAMETERS FOR FADE MITIGATION
1
K. CH. SRI KAVYA, 1 SARAT K. KOTAMRAJU, 2 B. S. S. S. D CHARAN, 2 PHANINDRA K,
2BITRA SRINIVAS, 2 N. NARENDRA KUMAR
Department of Electronics and Communication Engineering, K. L. University, Green Fields, Vaddeswaram, Guntur- 522502, Andhra Pradesh, India.
E-mail:[email protected]
ABSTRACT
Signal attenuation is the major reason for the loss of signal in some regions. There are many atmospheric factors that cause degradation of the signal. In summer the attenuation is mostly due to scintillations in troposphere. Fog is the major reason for the attenuation in the winter season. Where as in monsoon it is due to rain and cloud. The depth of this attenuation purely depends on the frequency of the signal. If the signal frequency is greater than 10GHz, degradation of the signal is more. This work deals with the attenuation of the signal due to rain. This analysis is useful to implement the suitable fade mitigation technique. Fade mitigation techniques are useful in receiving the signal without any loss. However, suitability of the fade mitigation technique varies from region to region. The analysis is done for the Beacon data received at K L University, Vaddeswaram located 29.08m above sea level with Latitude - 16.46’ N and Longitude – 80.54’ E.
Keywords: Attenuation, Fade Mitigation, Beacon, Ku band, Rainfall Data.
1. INTRODUCTION
In modern days, there is more demand for high speed applications[1]. These requirements of the users cannot be met because of the congestion. This demand can only be fulfilled if we go for higher frequency bands like Ku, K, Ka etc. In this work we are dealing with Ku band signal which ranges from 12GHz to 18GHz. This signal is down converted to 11.6985GHz by a parabolic dish antenna.In high frequency bands, we have more scope to serve large number of users. The chance of signal attenuation is more for the frequencies greater than 10GHz. There may be many reasons for the signal attenuation like are tropospheric scintillation, cloud attenuation, rain attenuation etc. Signals coming from the satellite may be affected by any of these atmospheric factors. This is the main reason for the loss of signal especially when the signal frequency is greater than 10GHz [2]. Out of these, our main consideration is attenuation due to rain. Figure 1 perfectly describes the signal attenuation by atmospheric factors.
In summer season the signal gets attenuated due to scintillations. In monsoon season the signal is affected by rain. In winter, it is due to fog. However, the most predominant factor for signal attenuation is rain. All other effects are negligible. Before implementing satellite services in a region,
one must do complete analysis on the climatic conditions on that region like the maximum rainfall rate, minimum rainfall rate, average rainfall rate, how much percentage of time the signal is completely lost, etc. Only after this analysis the estimated cost of the implementation can be made. Otherwise it leads to the wastage of resources. Till date many models were developed for prediction of the rain attenuation. Out of all the most popular models are Crane model [3], International Telecommunication Union Radio Communication sector model [4], Dissanayake, Allnutt and Haidara model [5], Simple Attenuation model, Moupfouma model [6], Excell model, etc. ITU-R is treated as the best model for prediction of the rain attenuation. This model is popular because of the simple mathematical calculations and expressions. More the rain intensity, more the attenuation of the signal. The transmitted power must be increased if the attenuation is more. Thus, the cost burden on the transmitting units increases.
The intensity of the rain depends on the region and the drop size. More the drop size, more the signal gets attenuated. If the signal fading is high, the user may not be able to receive the signal [7]. This may cause serious errors in some applications. These errors can be reduced by using fade mitigation
2192 mitigation techniques, the behavior of the techniques must be assessed.
Time series must be generated for the attenuation according to the climatic conditions of the region to assess the behavior of fade mitigation techniques [1] [8]. The unavailability of link can be predicted with the analysis of rain rate and rain attenuation [9] [10]. The rainfall rate of a region is completely different when compared to the rainfall rate of another region. This is because of the climatic conditions of the region. This rainfall rate can also be calculated from the signal strength received from the satellite assuming, that the attenuation due to other parameters are minor. Mean of this attenuation says the rain fall rate of a region and this is helpful in comparing the climatic conditions of different regions.
[image:2.612.314.524.116.272.2]Standard deviation gives an idea about the maximum rain fall rate and minimum rain fall rate of the region. This analysis of rain fall rate in a region is crucial before implementing any multi-media services in that region. The complete and detailed analysis can only be done by generating the time series of the received data. Mean and standard deviation plays a crucial role in generating the time series.
Figure 1: Signal Attenuation Due To Atmospheric Factors
2. EXPERIMENTAL SETUP
For this work, we require Beacon data is received
from the GSAT 10 (830E) receiver present at KL
University, Vaddeswaram which is located 29.08m above sea level with Latitude - 16.46’ N and Longitude – 80.54’ E. It is operated at 11.6985GHz frequency. The Ku band signal is down converted to L band by the parabolic dish of 90cm in diameter. Data from September 2016 to February
[image:2.612.313.525.142.564.2]2017 is taken for the analysis. The hardware of the beacon receiver is shown in figure 2.
Figure 2: Beacon Receiver
[image:2.612.93.290.412.579.2]2193
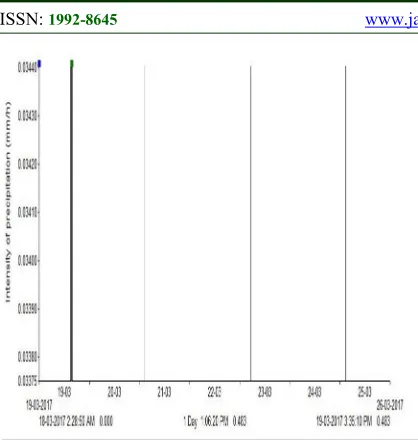
Figure 4: Precipitation Intensity Calculated On 19th March 2017
Figure 3 shows the Beacon receiver control program. Precipitation intensity of 0.483mm/h is
recorded on 19th March 2017. It is shown in figure
4. The peak indicates that there is a rainfall on that day and the respective precipitation intensity. This precipitation intensity says the rainfall depth on that day. If the amplitude of the peak is more then the attenuation of the signal is more.
3. STATISTICAL ANALYSIS
The received beacon data contains the signal strength (in millivolts). This signal strength is converted into dB for analysis purpose. Clear air condition is taken by calculating the mean strength of the mid-day in the continuous five non-rainy days. This clear air condition is used to calculate the attenuation for each sample of data. This clear air condition is calculated only for the data taken in non-rainy days of monsoon season because in winter season the signal degradation takes place due to fog and in summer season it is due to scintillation.
The attenuation for each sample of data is calculated by taking the difference of the signal strength of each sample and the clear air condition. Mean and standard deviation is calculated for each day and they are plotted against the attenuation. The plots give the variation of mean and standard deviation with respect to the attenuation.
Mean and standard deviation are important parameters in analysis the rainfall data. Mean is used to find the average rainfall rate of a region.
Standard deviation is used for the effective comparison of climatic conditions of different regions. It is a measure of uncertainty among the events.
The analysis is performed on the data set taken from September 2016 to February 2017 with a sampling interval of one second. Maximum attenuation is the maximum value of attenuation taken each day. Similarly, minimum attenuation is the minimum value of attenuation taken each day. It is found that for some days the maximum attenuation is greater than 45dB which is the result of heavy rainfall and it signifies the complete loss of signal. During cyclones, the minimum attenuation will be greater than 1dB because the sky is not clear and takes active part in the degradation of the signal. In normal days, the minimum attenuation is nearer to the zero but not absolutely zero because of the other atmospheric parameters.
These maximum and minimum attenuation are plotted against the mean and standard deviation. This is shown in figure 5, figure 6, figure 7, figure 8. Standard deviation says how the values are deviated from the mean value. If the standard deviation is greater than mean value, then it indicates the rainfall event and if the standard deviation is less than mean value then it indicates clear sky.
Maximum attenuation and minimum attenuation are very important in this analysis because they give an idea about the complete climate of the day and they give us a chance to predict the climate of the next day. If the climate of the next day is known, then proper care will be taken to avoid the signal losses.
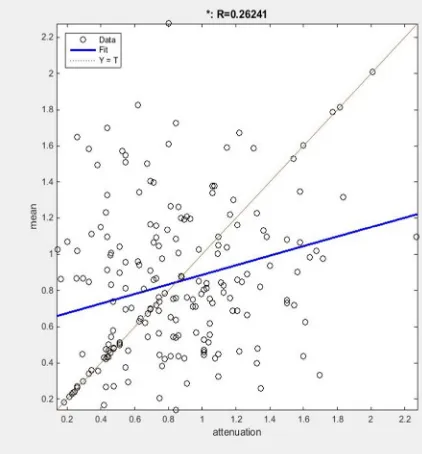
The same mean and standard deviation of attenuation are plotted against the nearest attenuation value to the mean and standard
deviation. A curve of the form y=mx+c is fitted to
these plots. If the mean values are greater than the attenuation value, then there is a rain event on that day and if the mean values are less than the attenuation value then there is no rain event on that day. This can be observed from figure 9 and figure 10.
4. EQUATIONS
2194 attenuation to the standard deviation. The equations obtained for the fitted curves are
m(x) = 0.263*x + 0.6231 (1)
s(x) = -0.049*x + 0.5304 (2)
where m(x) is the mean and s(x)is the standard deviation. These equations are useful for predicting the attenuation and in fade margin calculation.
5. RESULT
Figure 5: Variation Of Mean Of Attenuation With The Maximum Value Of Attenuation Taken Each Day.
Figure 5 says the variation of mean of attenuation with the maximum value of attenuation of each day. It is observed that 5 percent of the time the attenuation value is greater than 45dB. Even though the attenuation is greater than 45dB the mean of attenuation is less which means the heavy rainfall in this region does not last long.
Figure 6 says the variation of standard deviation of attenuation with the maximum value of attenuation of each day. If the standard deviation is greater than 1dB then it indicates that there is a rain event on that day. In many cases the standard deviation is less than 1dB and maximum attenuation is less than 5dB which says that most of the time the sky is clear.
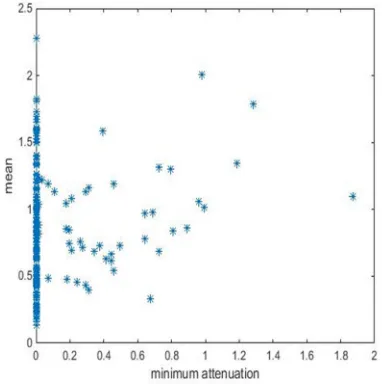
Figure 7 says the variation of mean of attenuation with the minimum value of attenuation of each day. The minimum attenuation is important because it is useful to predict the climate of the next day. If it is greater than 1dB then it means that it is raining the whole day. If the minimum attenuation is greater
[image:4.612.332.524.146.320.2]than 1dB then the next day is likely to be a rainy day. Otherwise the chance of rain on the next day is less.
Figure 6: Variation Of Standard Deviation Of Attenuation With The Maximum Value Of Attenuation
[image:4.612.111.285.253.427.2]Taken Each Day
Figure 8 says the variation of standard deviation of attenuation with the minimum value of attenuation of attenuation each day. In some cases, the standard deviation is greater than 4dB which means that there is a heavy rainfall event on that day. Since the mean of attenuation is less, the duration of that rain event is very less. During this time the satellite link is broken which causes some serious errors in some applications.
[image:4.612.325.516.507.699.2]2195
Figure 8:Variation Of Standard Deviation Of Attenuation With The Minimum Value Of Attenuation Taken Each
Day.
[image:5.612.105.333.70.322.2]Figure 9: Variation Of Mean Of Attenuation With The Maximum Value Of Attenuation Taken Each Day.
Figure 10: Variation Of Standard Deviation Of Attenuation With The Nearest Value Of Attenuation To
The Standard Deviation Taken Each Day.
Figure 9 and Figure 10 says the variation of mean and standard deviation of attenuation with the nearest value of attenuation to the mean and standard deviation of each day. A linear curve is fitted to these plots. The mean and standard deviation are calculated using the equation 1 and equation 2. These calculated values are compared with the experimental values. If the experimental values are greater than the calculated values, then it indicates that there is a rain event on that day. Is they are less than the calculated values, then it indicated the clear sky. It is found that sum of squares due to error (SSE) is 31.76, R-square value is 0.06886, Adjusted R-square is 0.06416 and root mean square error(RMSE) is 0.4005. These all parameters say about the goodness of the fit.
6. CONCLUSIONS
[image:5.612.92.303.383.610.2]2196 of 10 cases. In this region, the duration of the heavy rainfall is very less but in all such instances the signal is lost atleast for 60-300 seconds. For complete analysis, one must do the analysis for long period of data such as 5-15 years (the present analysis is performed for one summer followed by rainy season) and generate the time series for the data set. Then an accurate fade mitigation technique can be implemented to have 100% availability of the signal even in the heavy rainfall.
ACKNOWLEDGEMENTS
The authors are thankful to Department of Science and Technology (DST), Government of India for their support given through the funded project with F. No: EMR/2015/000100. The authors extend their thanks to NOTACHI Elektronik Technologies for providing technical support in carrying out this research. The authors also thankful for the management of KL University for their support and encouraging this work by providing the facilities in Centre for Applied Research in Electromagnetics (CARE) of ECE.
REFERENCES
[1] Laurent.Castanet, and Frederic. Lacoste,
“Validation of rain attenuaion time series synthesizers for temperate area - on the enhanced masengbakken model,” 2008 Int. Work. Satell. Sp. Commun. IWSSC’08, Conf. Proc., pp. 40–44, 2008.
[2] Kilaru A, Avlonitis N, Kotamraju S.K, Otung I,
“Rain integration time and percentage
probability of rain in Indian subcontinent for
satellite communications,” International
Conference on Electronics and Communication Systems, ICECS 2014, art. no. 6892541. [3] R. K. Crane, “Prediction of Attenuation by
Rain,” IEEE Transaction on Communication vol. 28, pp. 1717-1736, 1980.
[4] Cost Action 255 Final Report, “Radiowave Propagation Modelling for SatCom Services at Ku-Band and Above”, ESA Publications Division, Noordwijk, The Netherlands, 2002. [5] A. W. Dissanayake, J. E. Allnut, and
FatimHaidara, “A prediction model that combines rain attenuation and other propagation impairments along earth-satellite paths,” IEEE Trans. on Antennas and Propagation, vol. 45, no. 10, pp. 1546-1588, 1997.
[6] Moupfouma F., Martin L. “Modelling of the rainfall rate cumulative distribution for the design of satellite and terrestrial communication
systems”, International J. of Satellite Comm., 1995. Vol. 13. P. 105–115.
[7] Fernando J. A. Andrade and Luiz A. R. Da Silva Mello, “Rain attenuation time series synthesizer based on the gamma distribution,” IEEE Antennas and Wireless Propagation Letters., vol. 10, pp. 1381–1384, 2011.
[8] J. Lemorton et al., “Development and validation of time series synthesizers of rain attenuation for Ka-band and Q/Vband satellite communication
systems,” Int. Journal of Satellite
Communications and Networking, V. 25, October 2007, pp 575-601.
[9] Immadi G, Kotamraju S.K, Khan H, Venkata Narayana M, Hemavasavi K, Pooja Naga Sai K, Sirisha N, “Estimation of Ku band satellite signal propagation impairment due to rain in tropical environment using ITUR,” International Journal of Applied Engineering Research, 2014, Vol 9, Issue 20, pp. 7159-7167.