Iris Recognition based on Robust Features Matching
R. M. Farouk
Department of Mathematics, Faculty of Science, Zagazig University, P. O. Box 44519, Zagazig, Egypt
ABSTRACT
In this paper, we have proposed a new technique to select a certain point in a segmented iris so called regions of interest. A robust feature descriptor based on Gabor wavelet and Discrete Fourier Transform (DFT) is introduced. We have extracted the robust features around the inside selected iris points. The selected points are connected with each other to form a graph. This graph is afforded to handle even globally warped irises, by enhancing the robustness of node descriptors to a global warping, and introducing warping-compensated edges in graph matching cost function. The performance of the proposed approach is evaluated through the recognition simulation based on arbitrary irises. Recognition results are given for galleries of irises from CASIA and UBIRIS database. We also compare our results with previous work and we have found that, the proposed approach is an effective technique for iris matching process especially in case of noise iris.
General Terms
Pattern Recognition, Biometrics Methods, Iris Recognition, Wavelet.
Keywords
Iris recognition, iris segmentation, features extraction, wavelets, robust jet.
1.
INTRODUCTION
Biometrics are inherently a more reliable and capable technique to determine a person's identity by his or her own physiological or behavioral characteristics. The features used for personal identification by current biometric applications include facial features, fingerprint, iris, retina, hand geometry, odour/scent. voice, signature, typing rhythm, gait, DNA, handwritten and palm-print. The human iris is an annular part between pupil and sclera and its complex pattern contains many distinctive features such as arching ligaments, furrows, ridges, crypts, corona, and freckles[1,2]. Human iris is the best characteristic when we consider these attributes. In fact, it is able to provide a comparable or even higher accuracy than other biometrics. However, this is only possible by ensuring strong constraints for subject cooperation and quality of the captured image [3].
The iris recognition method delivers accurate results under varied environmental circumstances. These visible characteristics are unique for each subject. The main goal is a matching system with a sufficient robustness with respect to different kinds of distortion, such as blurring, reflections and occlusions due to eyelids or eyelashes.
In order to build a matching system able to deal with the above constraints, the feature modeling involves the representation of the unique iris texture pattern, which should be highly distinctive between iris images of different eyes while maintaining invariance between iris images of the same
eyes. The most common practice is to extract the spatial-frequency information of the iris texture based on filtering technology.
Daugman [4,5] used Gabor filters for characterizing texture pattern, where the phase information of the filtered output is encoded in binary code. Wildes [6] applied the Laplacian of Gaussian filters to an image and used the normalized correlation to quantify the goodness of match. Some other researchers also considered the application of the Gabor filter or its variant to extract texture information [7]. A modified competitive learning neural network was adopted for classification. In another approach [8], and even symmetry Gabor filters are used to capture local texture information of the iris, which are used to construct a fixed length feature vector. The changes in iris texture with time, like disease and medication are discussed in [11]. In view of the limitation of poor direction selectivity about the 2-D wavelet transform and the problem of redundancy on contour let transform, an iris texture feature extraction method based on wavelet-based contourlets transform for obtaining high quality features is proposed [12]. Iris representation based on binary features of the multi-scale Taylor expansion is discussed in [9]. A non ideal iris image segmentation approach based on graph cut is presented that uses both the appearance and eye geometry information [10]. Elastic graph matching approach for iris recognition is discussed in [13].
In this paper, we have presented a new technique to select a certain point in a segmented iris so called regions of interest. Robust features descriptors based on Gabor wavelet and Discrete Fourier Transform (DFT) is introduced. We have extracted the robust features around the inside selected iris points. The selected points are connected with each other to form a graph. This graph is afforded to handle even globally warped irises, by enhancing the robustness of node descriptors to a global warping, and introducing warping-compensated edges in graph matching cost function.
1.2 Outline
Fig. 1 shows an outline of the proposed algorithm
2. IRIS SEGMENTATION
The first step in iris localization is to detect pupil. A point interior to the pupil is located from a variance image and then a Discrete Circular Active Contour (DCAC) is created with this point as its center. The DCAC is then moved under the influence of internal and external forces until it reaches equilibrium, and the pupil is localized. The result of DCAC is shown in Fig. 2
Fig. 2: Segmentation using DCAC, the left column shows the initial pupil localization and right column display the
DCAC results.
The second step locates the center and radius of the iris in the input image by using the circular Hough transform. In the proposed method by Wildes 1997, an edge map of the image
is first obtained by thresholding the magnitude of the image intensity gradient:
( ,
)* ( ,
) ,
G x y
I x y
(1)where G(x,y)is a Gaussian filter. Firstly, an edge map is generated by calculating the first derivatives of intensity values in an eye image and then thresholding the result. From the edge map, votes are cast in Hough space to maximize the defined Hough transform for the desired contour. These
parameters are the center coordinatesxcandyc, and the radius
r, which are able to define any circle according to the equation:
2 2 2
c c
x
y
r
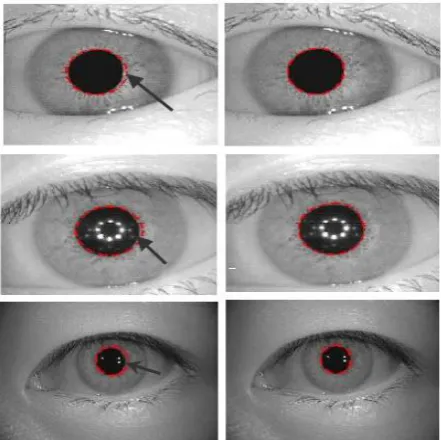
(2) [image:2.595.327.532.444.538.2]The local patterns are then used in a voting procedure using the Hough transform, in order to locate the proper pupil and limbus boundaries. In order to detect limbus, the only vertical edge information is used. The last step, detecting eyelashes and eyelids, which requires a proper choice of features and classification procedure due to complexity and randomness of the patterns. The proposed eyelash detection by Kong and Zhang (2010) consider eyelashes as two groups of separable eyelashes, which are isolated in the image, and multiple eyelashes, which are bunched together and overlap in the eye and applies two different feature extraction methods to detect eyelashes. Separable eyelashes are detected using a 1-D Gabor filter, since the convolution of a separable eyelash with the Gaussian smoothing function results in a low output value. The results of iris segmentation is given in Fig. 3
Fig. 3: The iris localization, where black regions denote detected eyelids and eyelashes regions.
3
.ROBUST GRAPH MATCHING
One of the main problems that we have met in our previous work [13, 14] is the nodes located in the boundaries of segmented iris. During the minimization of the cost, all nodes of test graph are forced to be located at the positions of most similar jets with the reference by maximizing node similarities, but the structure of test graph is forced to be preserved by minimizing edge distortions. The segmented iris
image
(
x
)
I
is presented as a features vector image; eachpoint
x
0
in the feature image is represented as a vector (jet) of Gabor wavelet coefficients calculated by convolution
between
(
x
)
I
and Gabor kernels
k(
x
)
by the followingformula:
Matching
Robust Graph Formulation
robust jet
selected points
Gabor wavelet transform
pupil inner and outer boundaries
[image:2.595.53.274.455.675.2]
)
x
x
(
*
)
x
(
)
x
,
k
(
0 0 k 0,
I
(6)
Which are parameterized by the two-dimensional vector and define by the equation:
ν+2
k cos
-ν
μ
2
k
=
, k =π2
,
νμ
k sin
ν
ν
μ
πμ
=
, ν {0,1,..., M-1}, μ {0,...,L-1}.
μ
8
(7)Gabor kernels
k(
x
)
(Fig. 5) are given by the formula:(8)
To generate a robust jet, extracted Gabor wavelet coefficients
are aligned as
L
xM
Gabor wavelets coefficients matrix eq. (9).
1
,...,
0
1
,...,
0
,
1
,1
0
,1
1
,
0
0
,
0
...
...
...
...
...
M
L
M
L
L
M
(9)Then we compute 2D Discrete Fourier Transform (DFT) of
Gabor matrix
to get the form
1 ,..., 0 1 ,..., 0 , LxM(
)
=
c
2
M LDFT
D
(10)We define our robust jet at
x
0
as a vector of aligned
magnitude parts of elements of
.
)
,...,
,
(
)
x
(
0,0 1,0 1, 10
L Mr
c
c
c
(11) Where 2 1 1 0 1 0 2 ,)
(
L Mc
[image:3.595.319.532.79.282.2]. The new jet is robust against rotation and scaling.
Fig. 4: Shows in the first row variation in orientation, second row variation in wavelength, third row variation in
phase, and last row variation on Gaussian radius.
3.1 Robust cost function
Due to phase rotation, jets taken from image points only a few pixels apart from each other have very different coefficients, although representing almost the same local feature. This can cause severe problems for matching. Using phase has two potential advantages. Firstly, phase information is required to discriminate between patterns with similar magnitudes, should they occur, and secondly, since phase varies so quickly with location, it provides a means for accurate jet localization in an
image. Assuming that two robust jets
rand
r refer toobject locations with small relative displacement
d
, the phase shifts can be approximately compensated for by the terms
j
k
d
, leading to a phase-sensitive similarity function
j j j j j j j j j j r r phS
2 2)
k
d
cos(
)
,
(
(12)To compute it, the displacement
d
has to be estimated. This
can be done by maximizing
S
ph in its Taylor expansion. It is actually a great advantage of this second similarity function that it yields this displacement information.3.2 Matching
When matching a template (the input iris graph)
M
T againstthe graphs of iris in database
M
I , replica of its set of nodepositions
{
}
T
M i
x
is placed in the image, or the
corresponding image graph
M
I creating the set of points2 2 2
2
2 2
2
( )
e
2
ikx k
k
k x
{
x
iI}
, where
I M s
i i
x
x
x
with an offset vector s
x
common to all nodes. The graph formed by theset of points
{
}
I ix
is called the image graph. The template
graph
M
T is compared to the image graphM
I with offset sx
in terms of the cost function1
(
T,
I)
ph(
Iir,
irM),
i V V
S M
M
S
N
(13)
where I rj
is the image jet taken at position
{
}
I ix
, V is the
set of visible nodes and
N
V is their number. Now, thematching cost (13) is minimized by varying
x
s
[image:4.595.52.284.74.343.2]. When an iris is occluded to a large eyelid and eyelash region, the total cost of its match is degraded by the many nodes that come to fall out the iris region and that correspondingly have low average similarity values. It is decided that this correct match cannot be outdone by a false match in some region of the image picked such that many nodes have above average similarity. The result of matching is shown in Fig. 5
Fig. 5 the matching of the template graph of an image in CASIA against 100 stored model graphs
4. RESULT AND DISCUSSION
To evaluate the effectiveness and the performance of the proposed method for iris recognition, we have used the CASIA version 3 and UBIRIS databases as the test and train dataset. The Following metrics are used to evaluate the performance of the system. Firstly, False Acceptance Rate (FAR): FAR is the measure of the likelihood that the biometric security system will incorrectly accept an access attempt by an unauthorized user. A system’s FAR typically is stated as the ratio of the number of false acceptances divided by the total number of identification attempts. Secondly, False Rejection Rate (FRR): A statistic used to measure biometric performance when operating in the verification task. The percentage of times the system produces a false reject. A false reject occurs when an individual is not matched to his/her own existing biometric template. Finally, Equal Error Rate (EER): The rates at which both accept and reject errors
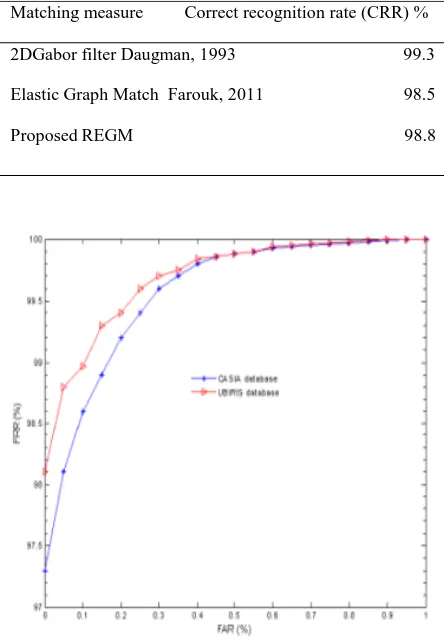
[image:4.595.323.545.325.645.2]are equal. In general, the lower the equal error rate value, the higher the accuracy of the biometric system. The EER is sometimes referred to as the "Crossover Error Rate". The above performance parameters are used and in order to assess the accuracy of the proposed algorithm, each test iris image in the database is individually matched to all the other iris images in the trained database. In the UBIRIS database, the total number of comparisons is 324351 where the numbers of intra-class and extra-class comparisons are 1792 and 322559 respectively. The proposed method was tested by using 996 and 723 iris images from the CASIA and UBIRIS database respectively. The ROC curve (see Fig. 7) for the False Match Rate (FMR) and False Non-Match Rate (FNMR) are estimated. The ERM was found to give good correct recognition rates compared to other matching methods as shown in Table 1. The result of matching is illustrated in Fig. 6. In the recognition mode, the Correct Recognition Rate (CRR) is adopted to assess the efficacy of the algorithm, as shown in Table 1.
Table 1: The correct recognition rates achieved by four matching measures using the CASIA and UBIRIS
database.
Fig. 6. Shows the ROC curves of the elastic graph matching with CASIA and UBIRIS databases.
Matching measure Correct recognition rate (CRR) %
2DGabor filter Daugman, 1993 99.3
Elastic Graph Match Farouk, 2011 98.5
[image:4.595.58.238.380.545.2]Fig. 7. The obtained ROC curves after applying different methods on UBIRIS database.
5. CONCLUSION
Here we have proposed a new and effective technique for iris recognition which operates using the robust features matching. Also, we have found that the robust jet improves matching results especially in the case of variants in scales and orientation. Our approach is tested for iris recognition. Experimental results have shown that ignoring the boundary effect still can indicate eminent performance for iris recognition. All recognition rates are more than 97%. Therefore, the proposed method has improved iris recognition system and is suitable for the matching process. In future work, we still search for a technique that uses the real iris image directly to reduce the influence of light, eyelid, and eyelash.
6. ACKNOWLEDGEMENT
The authors would like to thank the associate editor and the anonymous reviewers for their constructive comments. The author also would like to thank Prof. Dr. Christopher von der Malsburg and all members of FLAVOR to give me the opportunity to learn EGM technique during PhD study in Germany.
7. REFERENCES
[1] Jain A., Bolle R., and Kanti S. P. Biometrics: Personal Identification in a Networked Society. Kluwer, 1998.
[2] Boweyer, K. W., Hollingsworth, K., Patrick, J. F., 2008. Image understanding for iris biometrics: A survey,
Computer Vision and Image Understanding, 110, 281-307.
[3] Adler A. Physiology of Eye: Clinical Application. London, the C.V. Mosby Company, fourth edition, 1965.
[4] Daugman J. Biometric Personal Identification System Based on Iris Analysis. US Patent no. 5291560, 1994.
[5] Wildes, R. P., Iris Recognition: An Emerging Biometric Technology, Proceedings of the IEEE, Vol. 85(9), 1348-1363, 1997.
[6] Daugman, J., Demodulation by Complex-valued Wavelets for Stochastic Pattern Recognition, International Journal of Wavelets, Multiresolution and Information Processing, Vol. 1(1), 1-17, 2003.
[7] Ma, L., Tan, T., Wang, Y., Zhang, D., Efficient Iris Recognition by Characterizing Key Local Variations, IIEEE Transactions on Image Processing, 13, 739-750, 2003.
[8] Ma, L., Tan, T., Wang, Y., Zhang, D., 2004. Local intensity variation analysis for iris recognition, Pattern Recognition, 37, 1287–1298, 2004.
[9] Algrids B., Justas K. and Volker K., Iris recognition by fusing different representations of multi-scale Taylor expansion, Computer Vision and Image Understanding, 115, 6, (2011), 804-816.
[10] Pundlik S., Woodard D., and Birchfield S., Iris segmentation in non-ideal images using graph cuts, Image and Vision Computing, 28, 12, (2010), 1671-1681.
[11] Rankin D. M., Scotney B.W., Morrow P.J., and Pierscionek B.K., Iris recognition failure over time: The effects of texture, Pattern Recognition, 45, 1, (2012), 145-150.
[12] Luo Z., Iris feature extraction and recognition based on wavelet Based contourlet transform, Procedia Engineering, 29, (2012), 3578 – 3582.
[13] Farouk, R. M., 2011. Iris recognition based on elastic graph matching and Gabor wavelet, Computer Vision and Image Understanding, 115, 1239–1244.
[14] Farouk, R. M. Analytical analysis of image representation by their discrete wavelet transforms, International Journal of Computer Science 3 (4), 216– 221, 2008.