A Framework for Selecting the Most Reliable Path in a
Computer Network using Particle Swarm Optimization
(PSO) based on Fuzzy Logic
Partha Sarathi Banerjee
Kalyani Govt. Engg. College Kalyani, India
J.Paul Choudhury
Kalyani Govt. Engg College Kalyani,India
S.R.Bhadrachaudhuri
Bengal Engg. And Science University, Shibpur, India
ABSTRACT
Reliability is one of the most important factors for assessing the performance of the network. Packets should pass through the most reliable path. This paper presents a technique for selecting the most reliable path for communication between node pairs of a computer network. Reliability has been calculated based on the bandwidth utilization by the nodes. Bandwidth utilization has been calculated using throughput, latency-time, TCP segment/packet size and transmission bandwidth of the subsection of the network. Fuzzy Logic membership functions viz. Gaussian function, Bell-shaped function, PI function have been used to find out the most reliable path. Effort has also been made to find out the best fit membership function for selecting the most reliable path. The membership function which gives the minimum average error based on throughput values has been selected. Particle Swarm Optimization (PSO) combined with the best fit membership function has been applied on the same network for the similar purpose. Results have been compared with respect to average error given in the respective methods.
General Terms
Computer network, Reliability, Fuzzy logic, Membership function, Particle Swarm Optimization,
Keywords
Computer network, Reliability, Fuzzy logic, Particle Swarm Optimization
1.
INTRODUCTION
Information sharing over computer network requires a reliable, secure path for data delivery. Thus an important aspect of the data communication network is to analyze the reliability and finding out the most reliable path for data transmission so that the performance of the network can be improved. The analysis of the reliability mainly concerns two key factors as (i) Estimation of the reliability of the given network using efficient techniques (ii) Finding out the most reliable path for communication.
The objective of this paper is to calculate the reliability of all possible path for a node pair and find the most reliable path that is associated with maximum numerical value of reliability. Performance of three fuzzy Logic membership functions have been compared to find out the best fit membership function for selecting the most reliable path in a computer network. Thereafter Particle Swarm Optimization (PSO) has been applied to find out the most reliable path. The reliability has been considered as a function of transmission bandwidth, segment length of Transmission Control Protocol version 4(TCPv4) for Windows system and latency. These parameters results in percentage of bandwidth utilization for the links and that bandwidth utilization factor decides about the reliability of the link. Greater the bandwidth utilization, higher the reliability.
The section I of this paper presents the aim and objective of this paper. Related research work has been furnished in section II. Methodology has been furnished in section III. The detailed work has been discussed in section IV. Section V contains results and conclusion has been furnished in section VI.
2.
RELATED WORK
In ([1]-[4]) different algorithms for reliability has been proposed. All terminal reliability has been considered as the function of the probability of connection between all „s-t‟ pairs. Belovich and Konangi [1] have proposed an algorithm in linear-time but it has an upper bound placed upon the in-degree of all nodes, which is practically not viable. Kumar, Pathak and Gupta [5] developed a genetic algorithm considering distance, diameter and reliability to design and expand computer networks. Mou Dasgupta and G.P.Biswas [6] presented two linear time complexity algorithms for approximate assessment and the enhancement of the reliability of the given networks. L. E. Miller, J. J. Kelleher, and L. Wong [7] proposed Equivalent Links Algoithm 1(ELA 1) and Equivalent Links Algoithm 2(ELA2) for calculating the s-t reliability. They assumed the nodes to be failure free. It was the probability of success of data delivery from „source‟ to „target‟ over the links that resulted in the reliability value for the corresponding s-t pair. Gihan Nagib & Wahid G. Ali [8] discussed the applications of genetic algorithm for finding shortest path of a computer network as prescribed by Dijkstra‟s algorithm and showed that the performance of both the algorithm is the same. Q. Song and Chissom [9]explained the definition of fuzzy time series and discussed the models using fuzzy relational equations. They used a time invariant fuzzy time series model [10] and first order time variant models and utilized 3 layer back propagation neural network for defuzzification [11]. Satyendra Nath Mandal, Dr. J. Paul Choudhury, Dilip De, S. R. Bhadra Choudhury [12] compared performance of different fuzzylogic membership functions for prediction based on residual analysis. P.S.Banerjee and J.Paul choudhury [13] compared the performance of Particle Swarm Optimization (PSO) and Fuzzy Logic towards routing a computer network. They considered the result obtained by applying Dijkstra‟s algorithm as the reference.
of throughput. From the estimated value of the fuzzy logic based on each membership function, estimated reliability matrix has been formed. From the estimated reliability matrix, the estimated reliability value for the most reliable path has been found. Particle Swarm Optimization (PSO) with Constriction Factor has been applied on the reliability matrix generated by the membership function which gives minimum average error. Error analysis has been made on the basis of the minimum average error. Reliability value of the most reliable path is obtained thereafter. The particular fuzzy logic membership function which performs better can be selected for application on throughput value with an objective to find out the reliability value of the most reliable path based on PSO.
3.
METHODOLOGY
3.1
Reliability Estimation
Networks can be considered as a graph which is a collection of nodes connected with edges or „links‟ to each other. Collection of links are referred to as paths. Set of nodes are denoted by V=[v1,v2, v3,….., vn] and set of edges are defined as E=[e1, e2, e3…., en]. The reliability analysis approach opted here is that of terminal-pair / s-t reliability, which is defined as function of bandwidth utilization factor based on throughput, segment-size of TCP for Windows system and latency time. The network can be represented by its adjacency matrix,
G = [g(E)], where g(E)=n, if there exists an edge E associated with weight n, where n=1,2,3.. 0, otherwise
The reliability calculation has been done according to the ELA1 algorithm [7]. The algorithm is as follows:
1. Initialize S and F as the collection of success and failure event
2. Initialize a queue Q
3. Initialize W, the universal set, with all zero 4. Find shortest path under the condition 5. If shortest path P found
Add S=W∩P to success collection Add disjoint terms of W∩P‟ to Q Else
Add W to failure collection F 6. Get next W from the Q
7. Repeat step 4 to step 6 until Q is empty
The success and failure vectors {Si } and {Fi } represent the contents of the sets S={Si} and F={Fi} in the implementation of the Equivalent Links Algorithm(ELA1) [7]. They have the dimension 1 X M, where M is the number of links (edges). The components of a particular S vector take the values 1, if the network element is required to be working; -1, if the network element is not required to be working; or 0, if the status of the element is of no concern. Each S corresponds to a term in the polynomial expression for the reliability of the connection between the given source and terminal nodes in the case that all the nodes are perfectly reliable ( αi=1.0 for
i=1 to N; N is the number of nodes ); the (+1)'s indicate those links whose probabilities of working (reliabilities) β are factors in the term, and the (-1)‟s indicate those whose complementary probabilities 1- β are factors. The total expression for the s-t reliability when the nodes do not fail is then
Ns
R=∑Pr{Sj(s,t)} J=1
Ns
=∑∏{ βr : Sj (r;s,t)=1}∏{1- βr : Sj (r;s,t)= -1}
j=1
in which Sj ( r ; s,t) denotes the r th component of the
vector representing Sj( s,t ).
3.2
Fuzzy Logic
In fuzzy logic ([9] – [12]), unlike standard conditional logic, the truth of any statement is a matter of degree. The notion central to fuzzy systems is that the truth values (in fuzzy logic) or membership values (in fuzzy sets) are indicated by a value on the range [0.0, 1.0], with 0.0 representing absolute False and 1.0 representing absolute Truth. The minimum value is 0 and the maximum value is 1. The value in between the range can be decided by the membership function.
3.1.1 Gaussian Membership Function
A Gaussian membership function is defined by G(u:m,)=exp[-{(u-m)/2}2 ], Where the parameters m and
control the center and width of the membership function.
3.1.2 π-Membership Function
This function is defined as y = pimf(x,[a b c d]). This spline-based curve is so named because of its Π shape . The membership function is evaluated at the points determined by the vector x. The parameters a and d locate the "feet" of the curve, while b and c locate its "shoulders." The function is given by
y=0 , when x ≤a
= 2{(x-a)/(b-a)}2 when a ≤ x ≤ (a+b)/2_ =1-2{(x-a)/(b-a)}2 , when (a+b)/2 ≤ x ≤ b =1 when b ≤ x ≤c =1-2{(x-c)/(d-c)}2 when c ≤ x≤ (c+d)/2 =2{(x-d)/(d-c)}2 when (c+d)/2 ≤ x ≤ d =0 when x≥d
3.1.3 Bell shaped Membership Function
The generalized bell function depends on three parameters a, b, and c as given by
f(x;a,b,c)=1/[1+|(x-c)/a|2b]; here the parameter b is usually positive. The parameter c locates the center of the curve. The parameter vector are entered, as the vector whose entries are a, b, and c, respectively.
Particle Swarm Optimization (PSO)
Particle Swarm Optimization (PSO) applies to concept of social interaction to problem solving. It was developed in 1995 by James Kennedy and Russ. In PSO, a swarm of n individuals communicate either directly or indirectly with one another search directions (gradients).
Particles can be seen as simple agents that fly through the search space and record (and possibly communicate) the best solution that they have discovered. The particle moves from one location to other in the search space by the following way :-
1. PVid = PVid + c1r2 [Bid –Xid]+c2r2[Bnid –Xid] where
i=1,2,…n 2. Xid = Xid +PVid
Where Vid denotes the velocity of the particles and Xid
denoted the position vector of the particles. Bid denotes the
local best value and Bnid denotes the global best value.
For improved performance of PSO, one of the widely used modifications to the basic PSO algorithm is constriction factor method. This was proposed by Clerc. He used a factor „χ’, called as constriction factor.
The objective behind the use of constriction factor is to prevent the velocity from growing out of bounds, thus the velocity clamping is not required. The newer version of PSO is called Constriction Factor Method (CFM). The algorithm now becomes
2. Xid = Xid +PVid
χ=2(|2- φ-( φ2
-4φ)1/2 |)(-1) if φ=φ1+φ2>4
4. IMPLEMENTATION
Step1:
ARPANET has been taken as the network on which the work has been done.
2 3
8
5
18 12
1 9
13
5
7 9
19
14 11
8 10
5 16
12
9 5
8
10 12 2
8 21
11
5 3 Node 1
Node 2
Node 3 Node 4
Node 5
Node 6 Node 7
Node 8
Node 9
Node 10 Node 11
Node 12
Node 13 Node 14
Node 15 Node 16
Node 17 Node 18
Node 19
Node 20
Fig 1.: ARPANET graph
Step 2:
Weights associated with the link between nodes are assumed to be the number of packets delivered by the source node over the link.
Step3.
Assuming that TCPv4 segments are being sent by the nodes and transmission bandwidth is 100Mbps, the bandwidth utilization of the link is calculated. The percentage of the bandwidth utilization has been used as the parameter for calculating the reliability of the links. Nodes are assumed to be failure free.
Step 4:
Reliability of the links have been calculated by using the algorithm proposed in [7]. There are 20 number of nodes and 32 number of edges in the ARPANET graph(fig. 1.1). For the sake of avoiding complication of calculation and limited time, part of the network that consisting of node 1 to node 11 has been considered for the paper. Results corresponding to node 1 to node 5 are shown due to space constraint.
Step 5:
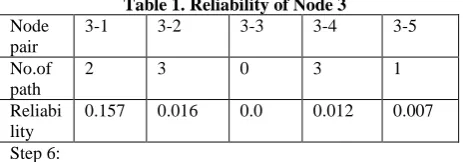
[image:3.595.306.552.212.297.2]The algorithm for reliability calculation [7] has been applied on all the nodes of the section of the ARPANET graph to get the reliability values for all the node pairs from node 1 to node 11. The s-t reliability values of node pair starting with node 3 has been furnished in table 1. Due to space constraint, result shown only up to node 5.
Table 1. Reliability of Node 3 Node
pair
3-1 3-2 3-3 3-4 3-5
No.of path
2 3 0 3 1
Reliabi lity
0.157 0.016 0.0 0.012 0.007
Step 6:
The reliability matrix has been formed using the node-pair reliability values. The reliability matrix is furnished in table 2. Node 1 is considered as source node and node 5 is the target node. The original table is a 11 X 11 matrix. Due to space constraint 5 X 5 matrix is shown.
Table 2. Reliability matrix for ARPANET
1 2 3 4 5
1 0 0.108 0.028 0.046 0.094
2 0 0 0 0.419 0.264
3 0.157 0.016 0 0.012 0.007
4 0 0.005 0 0 0.682
5 0 0.052 0 0.022 0
6 0 0.025 0.179 0.013 0.473
Step 7:
The most reliable path between node 1 and node 5 has been found and the path is 1-2-4-5. The reliability of the path is (0.108+0.419+0.682)=0.682. The „+‟ indicates here the „max‟ operator. The reliability values for the concerned node has been furnished in table 1.
Step 8:
The data related to link throughput of the network, as furnished in table 3, is fuzzified based on pi membership function [14] and the fuzzified values are furnished in table 4. 10 fuzzy sets are taken (A1 to A10). Due to space constraint only A1 to A5 are provided in both the tables.
Table 3. Link and corresponding throughput values
Link Throughput values
5-2 1
1-2, 16-19, 3-4 2
1-6, 3-1 3
3-1, 7-3, 11-9, 19-17, 14-18 5
2-3, 3-5 7
Table 4. Fuzzified data on PI function
Throu ghput
A1 (1-2)
A2 (3-4)
A3 (5-6)
A4 (7-8)
A5 (9-10)
1 1.00 0.00 0.00 0.00 0.00
2 1.00 1.00 0.00 0.00 0.00
3 0.22 1.00 0.50 0.00 0.00
5 0.00 0.06 1.00 0.50 0.00
7 0.00 0.00 0.50 1.00 0.50
Step 9:
Relational matrix (Table 6) has been formed from the fuzzy value (table 4) and fuzzy relationship matrix as shown in table 5. The original relational matrix is of dimension 11 X 11. Due to space constraint only 5 X 5 is shown.
Table 5. Fuzzy Logic Relationship
[image:3.595.326.548.465.604.2]A1 -> A1 A3 -> A4 A1 -> A2 A4 -> A4 A2 -> A3 A4 -> A5 A5 -> A5 Table 6. Relational Matrix
Step 10
The estimated fuzzy value of throughput has been calculated based on the relation Ai = Ai - 1 . R, where Ai - 1 is the fuzzy set for path cost i - 1 and Ai is the same for i in terms of fuzzy sets and ' . ' is the max - min operator.
Step 11
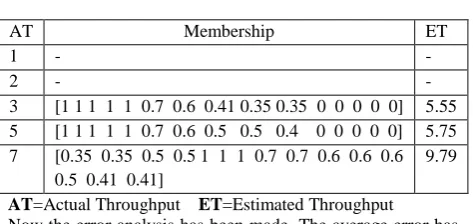
The estimated fuzzy value has been defuzzified and furnished in table 7. Only 5 values are shown in table 7. Rest are not shown due to space constraint.
1.00 1.00 1.00 1.00 0.05
1.00 1.00 1.00 1.00 1.00
0.22 0.35 0.50 1.00 1.00
0.00 0.05 0.30 0.50 1.00
[image:3.595.49.281.531.612.2]Table 7. Output membership and defuzzified value
AT Membership ET
1 - -
2 - -
3 [1 1 1 1 1 0.7 0.6 0.41 0.35 0.35 0 0 0 0 0] 5.55 5 [1 1 1 1 1 0.7 0.6 0.5 0.5 0.4 0 0 0 0 0] 5.75 7 [0.35 0.35 0.5 0.5 1 1 1 0.7 0.7 0.6 0.6 0.6
0.5 0.41 0.41]
9.79
AT=Actual Throughput ET=Estimated Throughput Now the error analysis has been made. The average error has been found to be 2.889% based on PI membership function. Step 12
Reliability matrix has been formed with this estimated data. Calculation has been done on all nodes from node 1 to node 11. Due to space constraint, values for node 1 to node 5 are shown in Table 8.
Table 8. Modified reliability matrix
Step 13
Now the reliability from node 1 to node 5 has been calculated based on the modified reliability matrix. For that purpose all possible paths from node 1 to node 5 have been traversed. The reliability values corresponding to the links of the paths are calculated using „max‟ operator. The path with maximum reliability value has been selected as the most reliable path. In this case the most reliable path from node 1 to node 5 is 1-2-4-5 and the estimated reliability value for that path is 0.111+0.431+0.702=0.702. Here „+‟ represents the „max‟ operator.
Step 14
Step 8 to step 13 are repeated to generate modified reliability matrix corresponding to Bell shaped membership function(table 9) and Guassian membership function (table 10). Table 11 shows the values of the most reliable paths found from node 1 to node 5 for the three membership functions used. Average error in the three membership functions are shown in table 12. Table 13 shows the estimated error with respect to each link of the most reliable path for all three membership functions.
In all the cases, calculation is done on 11 nodes of the ARPANET but data in the tables are shown only of node 1 to node 5. This has been done due to space constraint.
Table 9. Modified reliability matrix based on Bell shaped function
nodes 1 2 3 4 5
1 0.000 0.104 0.027 0.044 0.091 2 0.000 0.000 0.000 0.405 0.255 3 0.152 0.015 0.000 0.012 0.007 4 0.000 0.005 0.000 0.000 0.659 5 0.000 0.050 0.000 0.021 0.000
Table 10. Modified reliability matrix based on Guassian membership function.
Table 11. Total reliability of the most reliable path from node 1 to node 5using ELA 1 the fuzzy membership
functions
Actual reliability (ELA 1)
Total reliability (Pi function)
Total reliability (Gaussian function)
Total reliability (Bell function)
0.682 0.702 0.711 0.659
Table 12. Method Versus Average Error (fuzzy membership function)
Method Average Error Pi membership function 2.889% Bell membership function 3.3631% Gauss membership
function
4.283%
Table 13. Estimated error on each link for three membership functions
Pa th
Actua l reliabi lity (ELA 1)
Estimated reliability (pi )function
Estimated reliability (Bell function)
Estimated reliability (Gaussian function) Valu
e
Error (%)
Val ue
Erro r(% )
Valu e
Error (%)
1-2
0.108 0.111 2.78 0.1 04
-3.84
0.113 4.62
2-4
0.419 0.431 2.87 0.4 05
-3.34
0.437 4.29
4-5
0.682 0.702 2.93 0.6 59
-3.81
0.711 4.25
Step 15
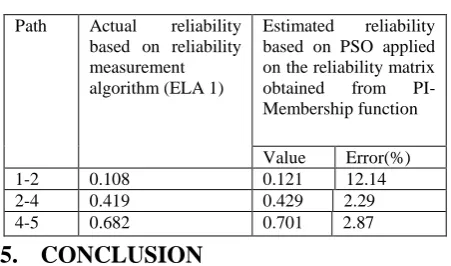
Particle Swarm Optimization (PSO) with Constriction Factor (Constriction Factor Method) is applied on the reliability matrix obtained by applying the PI-membership function. The result is compared with respect to the links on the most reliable path from node 1 to node 5. Table 14 shows the comparison values. Total reliability of the most reliable path is 0.121+0.429+0.701=0.701. Here „+‟ represents the „max‟ operator. Average error calculated is 0.4%.
node 1 2 3 4 5
1 0.000 0.111 0.029 0.047 0.097 2 0.000 0.000 0.000 0.431 0.272 3 0.162 0.016 0.000 0.012 0.007 4 0.000 0.005 0.000 0.000 0.702 5 0.000 0.054 0.000 0.023 0.000
nodes 1 2 3 4 5
1 0.000 0.113 0.029 0.048 0.098
2 0.000 0.000 0.000 0.437 0.275 3 0.164 0.017 0.000 0.013 0.007
Table 14. Error analysis of PSO-PI membership combination
Path Actual reliability based on reliability measurement algorithm (ELA 1)
Estimated reliability based on PSO applied on the reliability matrix obtained from PI-Membership function
Value Error(%)
1-2 0.108 0.121 12.14
2-4 0.419 0.429 2.29
4-5 0.682 0.701 2.87
5.
CONCLUSION
Comparing the three fuzzy membership functions, it has been observed that reliability calculation based on Particle Swarm Optimization (PSO) with constriction Factor shows better performance when combined with PI membership function than that of Bell and Gauss membership functions, considering average error. Therefore Pi membership function can be used for routing any type of network to find out the most reliable path and when combined with PSO, it will give even better result. In this paper, a section of the example network ARPANET has been considered. Performance of three membership functions as well as PSO has been tested. Reliability has been considered as a function of throughput, transmission bandwidth and latency. As a future work the same steps may be executed on the rest of the ARPANET network. Other QoS parameters of network may be considered to find out the most suitable path for any network application towards routing.
6. REFERENCES
[1] S.G. Belovich, V.K. Konangi, “A Linear-time Approximation for Computing the Reliability of a Network”, Computer Networks and ISDN Systems, Vol. 21, pp 121-127, 1991.
[2] W.P. Dotson, J.O. Gobien, “A New Analysis Technique for Probabilistic Graphs”, IEEE Transactions on Circuits & Systems, Vol. CAS-26, No. 10, pp 855-865, 1979.
[3] Y.B. Yoo, N. Deo, “A Comparison of Algorithms for Terminal-Pair Reliability”, IEEE Transaction on Reliability, Vol. 37, No. 2, pp 210-215, 1988.
[4] A.R. Majeed, J.A. Hussein, “Weighted Network Reliability and Modeling”, IEEE 5th IMCSSD, 2008.
[5] A. Kumar, R. M. Pathak and Y.P. Gupta, “Genetic- Algorithm Based Reliability Optimization for Computer Network Expansion”, IEEE Transaction on Reliability, Vol. 44, No. 1 pp 63-72, 1995.
[6] Mou Dasgupta, G. P. Biswas,”Reliability Measurement and Enhancement of the Communication Networks”, International Journal of Computer Applications (0975 – 8887),Volume 1 – No. 9,pp 18-25,2010
[7] EVALUATION OF NETWORK RELIABILITY CALCULATION METHODS (White Paper) L. E. Miller, December 2004 Extracted from L. E. Miller, J. J. Kelleher, and L. Wong, "Assessment of Network Reliability Calculation Methods," J. S. Lee Associates, Inc. report JC-2097-FF under contract DAAL02-92-C-0045, January 1993.
[8] Gian Nagib & Wahied G. Ali, “Network Routing Protocol using GA”, International Journal of Electrical Engineering & Computer Sciences, IJECS-IJENS-Vol :10 No:2, pp40-44.
[9] Q. Song and B. S. Chissom, “Forecasting enrollments with fuzzy time series part I”, Fuzzy Sets and Systems 54(1993) 1 - 9.
[10] Q. Song and B. S. Chissom, “Fuzzy Time Series and its Models”, Fuzzy Sets and Systems 54(1993) 269-277. [11] Q. Song and B. S. Chissom, “Forecasting enrollments
with fuzzy time series - part II”, Fuzzy Sets and Systems 62(1994) 1-8.
[12] Satyendra Nath Mandal, Dr. J. Paul Choudhury, Dilip De, S. R. Bhadra Choudhury, “Role of Membership functions in Fuzzy Logic for Prediction of Shoot Length of Mustard Plant based on Residual Analysis”, Proceedings of World Academy of Science, Engineering and Technology, volume 28, Rome, Italy, pp 378-384, April 2008,
[13] P.S Banerjee, Dr. J. Paul Choudhury, “A Compartive Studu on the performance of Particle Swarm Optimization (PSO) and Fuzzy Logic Towards Routing”, International Journal of Applied Engineering Research (0973-4562) Vol. 6 No. 5 (2011) pp 605-609