De-noising of ECG Waveforms based on Multi-resolution
Wavelet Transform
Hari Mohan Rai
Department of Electrical Engineering
Jabalpur Engineering College, Jabalpur, M.P., India
Anurag Trivedi
Department of Electrical Engineering
Jabalpur Engineering College, Jabalpur, M.P., India
ABSTRACT
Wavelet transform is a powerful tool to analyze the non-stationary biomedical signals. This paper deals with the noise removal of ECG signal using three different wavelet families (haar, Daubechies and Symlets). The different noise structure (unscaled white noise, scaled white noise and non white noise) have been selected for ECG signals and compared their statistical parameter to find out the best result. The wavelet families used for De-noising are Haar, Daubechies and Symlets. Experimental result shows that the Daubechies4 (Db4) for scaled white noise structure gives the best result as compared to other wavelet family. The database has been collected from MIT-BIH arrhythmias database of the lead II (ML II) signal. The ECG signals to be De-noised is decomposed to the Level 5 using the selected wavelet family. MATLAB 7.10 wavelet tool box is used for De-Noising the ECG data.
Keywords
ECG, De-noising, MIT-BIH, Multiresolution, Haar, Symlets Daubechies.
1.
INTRODUCTION
Electrocardiography is the recording of the electrical activity of the heart, and it monitored by placing sensors at limb. Electrocardiogram (ECG) is considered as a representative waveform of cardiac physiology, useful in diagnosing heart arrhythmias [1]. The arrhythmia of the heart is determined by the shape of the ECG waveform, which contains important information to different types of disease arises in the heart. However, the ECG signals are not regular in nature and it arises randomly at different time intervals during a day. Sensor data mainly contain noise and distortion and hence before processing these data, the sensor electrocardiogram (ECG) data we need to remove as much noise, distortion present. Thus there is a need of continuous monitoring of the ECG waveform, which can be very important in determining the nature of the diseases.
Noise reduction plays an important role in ECG signals processing, which has to be done before the analysis of electrical activity of the heart [2]. The most noise sources contain frequency components within ECG spectrum, Such as electrical activity of muscles (EMG) and movement of electrode-skin contact. These noises are very difficult to remove by using simple filtering operations. Efficient analytical tool which use to increase signal to noise ratio (SNR) is a method of averaging of cardiac cycles. The effectiveness of this technique depends on stable sinus rhythm. In such type of signals noise reduction is only possible by using more advanced signal De-noising or signal processing method, as wavelet De-Noising technique [2].Wavelet transform is being used effectively in De-nosing and data compression of signal, which are affected by the serious noise structure.
In this paper, the De-Noising of ECG signal has been done with different wavelet function based on multilevel decomposition. The statistical parameter such as mean, mode, median, maximum and minimum of the signal, range, standard deviation, Median absolute deviation and Mean absolute deviation of original ECG is calculated and compared with the statistical parameter of De-noised ECG signal for various noise structures.
2.
BACKGROUND
2.1
Origin of heartbeat
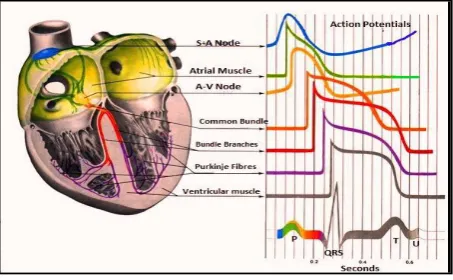
[image:1.595.317.544.411.551.2]Heart beat originates from muscle of the heart, and it is regulated by nerves cells. Electrical impulses of the heart muscle cause the heart to beat. The impulse is an electrical signal which begins in the sinoatrial node (SA), it is located at the top of the right atrium. An electrical impulse is released from SA, and it causes the atria to contract. The electrical signal then passes through the atrioventricular (AV) node [3]-[4].fig 1 shows the electrical conduction path through heart.
Fig. 1: Electrical Conduction Path through the heart
The AV node verifies the signal and sends it through the muscle fibers of the ventricles, causing them to contract. The SA node sends electrical impulses at a constant rate, but the heart rate changes depending on physical demands, stress, or hormonal factors. The ECG waveform contains information about the electric rhythm, electric conduction, muscular mass, presence of arrhythmia (irregular heart beat), ischemia (lack of blood flow) and infraction [3].
2.2
The Electrocardiogram
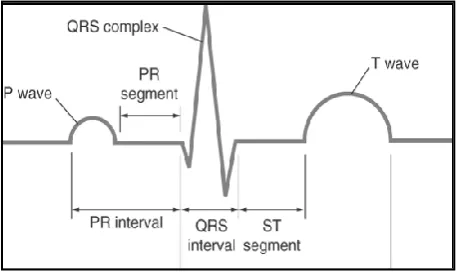
muscle "depolarizes" during each heartbeat. The ECG is a measurement of the effect of depolarization and repolarization for the entire heart on the skin surface. [5]. The depolarization and repolarization of atria and ventricle are detected as small rises and falls in the voltage between two electrodes placed either side of the heart which displays a waveforms. A typical ECG waveform [6] consists of P, Q, R, S, T and sometimes U wave, shown in fig 2.
Fig 2: Typical ECG Waveform
3.
MATERIAL
3.1
Wavelet Transform
The first step of De-noising procedure using wavelet transform is selection of mother wavelet – ψm,n (t) which
forms set of functions (family of wavelets), by compression or stretching or translation. For further analysis the following mother wavelet was used [1]-[2].
ψm,n (t) = 2−m2ѱ(2−m𝑡 − 𝑛) (1)
Where
n = coefficient of time translation,
m = coefficient of scale (compression).
The next step is the selection of decomposition levels of signal xi(t). In this analysis the discrete wavelet transform is
used at 5 level of decomposition. First decomposition level is obtained by combination of complementary high-pass and low-pass filters and then half of samples are removed as shown in the fig 3 .The Wavelet Toolbox provides several numbers of functions for the estimation of an unknown function (signal or image) in noise [7]. The most general 1-D model for this is
s(n) = f(n) + σe(n) (2) where n = 0,1,2, . . . N − 1.
The e n are Gaussian random variables distributed as N(0,1). The variance of the σe(n) isσ2. In practice, s(n) is often a discrete-time signal with equal time steps corrupted by additive noise and we are trying to recover that corrupted signal. In wavelet analysis the approximations and details are the high-scale, low-frequency components and the low-scale, high-frequency components of the Signal respectively. The filtering process using wavelet transform, at its most basic level is the combination of high pass and low pass filtering operation [7].
Fig 3: Basic Filtering, Approximations and Details
The discrete wavelets transform (DWT) use to analyze the signal at different band of frequency and with different resolutions by decomposing the signal into an approximation and detail coefficients. The selection of analyzing function i.e. mother wavelet in wavelet transforms is very important task, but there is no universal method is present to select a particular type of wavelet function. The selection of mother wavelet depends upon the type of signal which has to be analyzed [1]. The wavelet function which have similar look as the signal being analyzed is usually selected. There are several types of wavelet families like Haar, Daubechies, Biorthogonal, Coiflets, Symlets, Morlet, Mexican Hat, Meyer etc. and several other Real and Complex wavelets [8]. Daubechies4 and symlet6 have been used in this work for De-Noising purpose because these wavelets show similarity with QRS complexes and energy spectrum is concentrated around low frequencies [9].
3.2
ECG Database
The database collection is the one of the most important part of signal processing. We have selected MIT-BIH Arrhythmia Database directory of ECG signals from physionet. The source of the ECGs of MIT-BIH Arrhythmia was obtained by the Beth Israel Hospital Arrhythmia Laboratory. The database contains 48 records divided into two parts first one is of 23 records (numbered from 100 to 124 with some numbers missing), and another one is contains 25 records (numbered from 200 to 234, again with some numbers missing). [10]-[11].
The database contains approximately 109,000 beat labels. ECG signals MIT-BIH Database are described by- a text header file (.hea), a binary file (.dat) and a binary annotation file (.atr). Header file describe the detailed information such as number of samples, sampling frequency, format of ECG signal, type of ECG leads and number of ECG leads, patients history and the detailed clinical information. In binary data signal file, the signal is stored in 212 format which means each sample requires number of leads times 12 bits to be stored and the binary annotation file consists of beat annotations [11].
4.
METHODS
The ECG signals collected from MIT-BIH database is in .dat (example 100.dat,101.dat) format has to be first converted into readable format (.mat file) format by using a MATLAB program and then the number of samples are selected for further processing. As mentioned above the database contains two signals in a single record, we need only the upper signal
Signal(S)
Low-pass
High-pass
A
D
which is modified limb lead II (ML II). In this work only one record (101.dat) is selected record from MIT-BIH arrhythmia Database for De-Noising the ECG signal. The 3000 sample of ECG signal is selected and calculated the various statistical parameter of the noisy ECG signal. Then the noisy ECG signals are decomposed at level five using various wavelet families. De-noising of the signal have been performed for various noise structure and their statistical parameters are compared with the noisy ECG waveform
4.1
De-Noising Procedure
The details of the signals are influenced by high frequencies at the first level, while the low frequencies influence the deepest levels and the associated approximations of one dimension discrete signals [3].The De-noising procedure proceeds in three steps:
Decompose
Choose a wavelet function; choose a level N. Compute the wavelet decomposition of the signals at level N.
Threshold detail coefficients
For each level from 1 to N, select a threshold and apply soft thresholding to the detail coefficients.
Reconstruct
Reconstruct the signal based on the original approximation coefficients of level N and the modified detail coefficients of levels from 1 to N.
5.
RESULT AND DISCUSSION
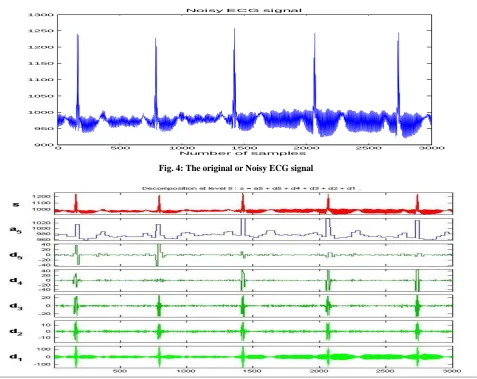
[image:3.595.61.539.359.738.2]In this section we have discussed the De-noising of ECG signal of record number 101.dat from MIT-BIH Database by using haar, daubechies4 and symlet6 wavelet families. The ECG signal first of all converted into .mat file format and the 3000 of samples is selected from it to draw a Raw ECG. In the De-noising procedure as described above, we have taken the noisy ECG signal and decomposed it up to N level according to the noise content present in it, in our experiment the value of N=5. In this paper the soft thresholding method is used for each level of signal decomposition. Soft thresholding has nice mathematical properties and the corresponding theoretical results are also available [12]. The Reconstruction ECG signal is free from noise. But the Scaled White Noise, Unscaled White Noise and Non-White noise content are still present which has been removed by De-noising of signal using various wavelet families in MATLAB wavelet toolbox. The statistical values of noisy ECG is always more as compared to the De-noised Signal. The ECG waveforms, its decomposition level, De-noised waveforms, histogram plot for Unscaled White Noise and Non-White noise using different wavelet families is shown in the figures below.
Fig. 4: The original or Noisy ECG signal
Fig. 5: The Decomposition ECG signal at level 5 using Haar wavelet
0 500 1000 1500 2000 2500 3000
900 950 1000 1050 1100 1150 1200 1250 1300
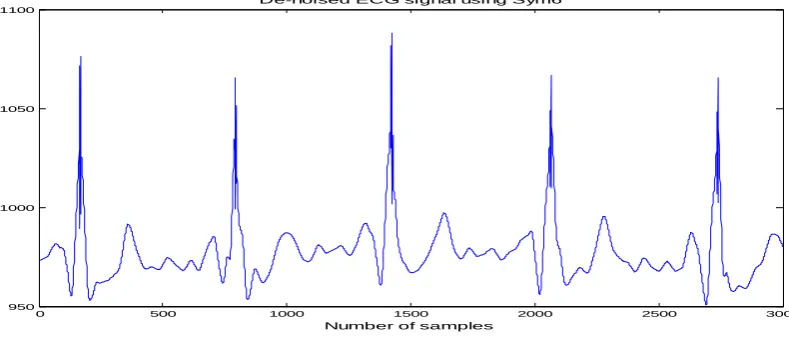
Fig. 6:De-noised ECG signal for nonwhite noise structure using Haar wavelet
Fig. 7: De-noised signal, Histogram and cumulative Histogram plot of ECG signal for scaled white noise structure using db4 wavelet
Fig.8: De-noised ECG waveform for nonwhite noise structure using sym6 wavelet
0 500 1000 1500 2000 2500 3000
940 960 980 1000 1020 1040 1060 1080 1100 1120 1140
De-Noised ECG Signal using Haar W avelet
Number of sample
0 500 1000 1500 2000 2500 3000
950 1000 1050 1100
De-noised ECG signal using Sym6
[image:4.595.100.495.514.683.2]Table-1. Comparison of statistical values of noisy ECG with De-nosed ECG using haar wavelet for different noise structures Level 5 decomposition of ECG signal using Haar wavelet
Statistical parameter Original or noisy ECG
De-noised ECG signal
Unscaled white noise Scaled white noise Nonwhite noise
Mean 977.2 977.2 977.2 977.2
Mode 980 979.3 975.2 975.3
Median 992.2 983.6 977.7 979
Max 1257 1250 1087 1134
Min 919 923.9 958.5 958.5
Range 338 325.7 128.3 175.6
Standard deviation 31.41 29.51 14.58 16.83
Median absolute deviation 16 14.24 5.125 5.156
[image:5.595.72.524.287.442.2]Mean absolute deviation 20.41 18.1 8.74 8.791
Table-2. Comparison of statistical values of noisy ECG with De-nosed ECG using Db4 wavelet for different noise structures Level 5 decomposition of ECG signal using Daubechies4 wavelet
Statistical parameter Original or noisy ECG
De-noised ECG signal
Unscaled white noise Scaled white noise Nonwhite noise
Mean 977.2 977.2 977.2 977.2
Mode 980 979.2 974.7 974.6
Median 992.2 984.6 970.7 974.8
Max 1257 1252 1091 1145
Min 919 924.6 949.2 952.3
Range 338 327.8 141.9 192.5
Standard deviation 31.41 29.56 14.25 17.35
Median absolute deviation 16 14.23 6.019 5.653
Mean absolute deviation 20.41 18.13 9.749 9.384
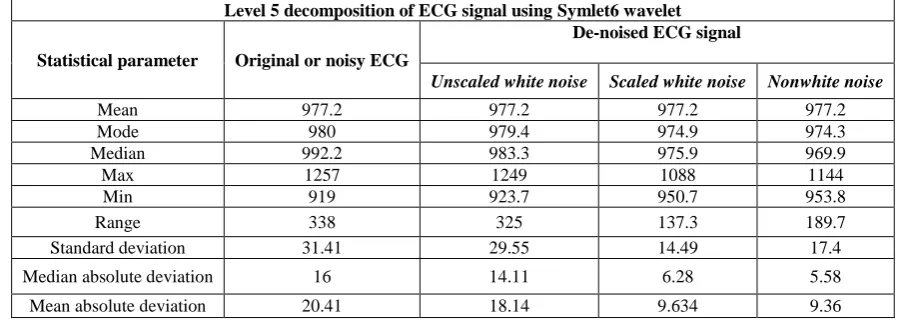
Table-3. Comparison of statistical values of noisy ECG with De-nosed ECG using Sym6 wavelet for different noise structures Level 5 decomposition of ECG signal using Symlet6 wavelet
Statistical parameter Original or noisy ECG
De-noised ECG signal
Unscaled white noise Scaled white noise Nonwhite noise
Mean 977.2 977.2 977.2 977.2
Mode 980 979.4 974.9 974.3
Median 992.2 983.3 975.9 969.9
Max 1257 1249 1088 1144
Min 919 923.7 950.7 953.8
Range 338 325 137.3 189.7
Standard deviation 31.41 29.55 14.49 17.4
Median absolute deviation 16 14.11 6.28 5.58
Mean absolute deviation 20.41 18.14 9.634 9.36
The De-noising results obtained with various wavelets families for several different noise structures (unscaled white noise, scaled white noise and non-white noise) of the ECG signal are presented in 1, 2, 3.From Table-1 it is observed that the statistical parameters values of de-noised ECG signal using haar wavelet are less compare to original ECG signal values and it is also clear that the De-noising of ECG signal using haar wavelet for scaled white noise structure gives better result compare to unscaled white noise and nonwhite noise structures.Table-2 gives the result of
[image:5.595.71.523.482.642.2]unscaled white noise and scaled white noise structure, but it also reduces the peaks of the original ECG signals. The term Db4 and Sym6 is used for Daubechies wavelet of order 4 and Symlet wavelet of order 6 respectively.
6.
CONCLUSION
In this paper De-noising of ECG waveform for different noise structure using multiresolution wavelet transform is addressed. . We have decomposed the ECG signal into 5 levels and chosen the fourth co-efficient for Daubechies and sixth co-efficient for Symlet wavelet and calculated their statistical parameter values for noisy ECG signals and De-noised waveform using wavelet families. the experiment shows that the Daubechies4(Db4) of level 5 for scaled white noise structure gives the best result as compared to other wavelet family and haar wavelet gives the worst result for Unscaled white noise structure For the future research De-noise ECG, EEG, EMG and different biosignal by using Various De-noising methods will be done.
7.
REFERENCES
[1] V. Vijaya, K. Kishan Rao, V. Rama, “Arrhythmia Detection through ECG Feature Extraction using Wavelet Analysis”, European Journal of Scientific Research, Vol. 66, pp. 441-448, 2011.
[2] M. Kania, M. Fereniec, R. Maniewski, “Wavelet Denoising for Multi-lead High Resolution ECG Signals”, Measurement Science Review, Vol. 7, Section 2, No. 4, 2007
[3] “ECG Learning Center”, Dr. Frank G. Yanowitz, M.D., University of Utah School of Medicine http://medlib.med.utah.edu/kw/ecg
[4] "How Your Heart Works", HowStuffWorks (http://www.howstuffworks.com), by Dr. Carl Bianco, M.D. HowStuffWorks, Inc., 2001. (http://howstuffworks.com/heart.htm)
[5] A.Pachauri, and M. Bhuyan, “Robust Detection of R-Wave Using R-Wavelet Technique”, World Academy of Science, Engineering and Technology, vol. 56, 2009. [6] Malcolm S. Thaler M.D., “The Only EKG Book You’ll
Ever Need”, fifth edition, 2007.
[7] Michel Misiti, Yves Misiti, Georges Oppenheim, Jean-Michel Poggi, “ Wavelet Toolbox For Use with MATLAB” , vol. 1, march 1996
[8] Daubechies, I., “Ten Lectures on Wavelets”, SIAM, Philadelphia, 1992.
[9] S.Z.Mahmoodabadi, A.Ahmadian, and M.D.Abolhasani, “ECG Feature Extraction based on multiresolution wavelet transforms”, Proceedings of the 2005 IEEE Engineering in Medicine and Biology 27th Annual Conference Shanghai, China, September 1-4, 2005 [10]“The MIT-BIH Arrhythmia Database,”
http://physionet.ph.biu.ac.il/physiobank/database/mitdb/ [11]R. Mark and G. Moody, “MIT-BIH Arrhythmia Database
Directory”. Available: http://ecg.mit.edu/dbinfo.html [12]Samsul Ariffin, Abdul Karim, Bakri Abdul Karim, Mohd
Tahir Ismail, Mohammad Khatim hasan & Jumat Sulaiman “Compression of Temperature Data by using Daubechies Wavelets”, Proc. 2nd International Conference on Mathematical Sciences, 2010.