Munich Personal RePEc Archive
Operationalising Senian capability
approach by modelling human
development
Canova, Luciano and Grasso, Marco and Vaglio, Alessandro
and Di Giulio, Enzo and Migliavacca, Stefania and Lelli,
Sara and Pareglio, Stefano
2005
Online at
https://mpra.ub.uni-muenchen.de/251/
Università Cattolica del Sacro Cuore
CRASL - CENTRO DI RICERCHE PER L’AMBIENTE
E LO SVILUPPO SOSTENIBILE DELLA LOMBARDIA
Operationalising Senian
capability approach by modelling
human development
Luciano Canova, Enzo Di Giulio,
Marco Grasso, Sara Lelli, Stefania Migliavacca,
Stefano Pareglio, Alessandro Vaglio
www.vitaepensiero.it
Fotocopie per uso personale del lettore possono essere effettuate nei limiti del 15% di ciascun volume dietro pagamento alla SIAE del compenso previsto dall’art. 68, comma 4, della legge 22 aprile 1941 n. 633 ovvero dall’accordo stipulato tra Siae, Aie, Sns e Cna, Confartigianato, Casa, Claai, Confcommercio, Confesercenti il 18 dicembre 2000.
Le riproduzioni ad uso differente da quello personale potranno avvenire, per un numero di pagine non superiore al 15% del presente volume, solo a seguito di specifica autorizzazione rilasciata da AIDRO, via delle Erbe, n. 2, 20121 Milano, e-mail: [email protected]
© 2005 Luciano Canova, Enzo Di Giulio, Marco Grasso, Sara Lelli, Stefania Migliavacca, Stefano Pareglio, Alessandro Vaglio ISBN 88-343-1299-6
I quaderni del Centro di Ricerche per l’Ambiente e lo Sviluppo Sostenibile della Lombardia (CRASL) sono rapporti che documentano studi e ricerche del Centro, nonché testi presentati in occasione di convegni, seminari, conferenze e workshop organizzati presso la sede di Brescia dell’Università Cattolica del Sacro Cuore.
CRASL – Comitato direttivo:Antonio Ballarin Denti (Direttore), Dante Marco De Faveri, Luigi Campiglio, Renzo Capra, Luigi Morgano, Giuseppe Volta.
CRASL – Comitato scientifico:Corrado Clini, Silvio Funtowicz, Sergio Garibba, Renato Pieri, Gualtiero Ricciardi.
Quaderni CRASL – Comitato di redazione:Stefano Pareglio (Responsabile), Francesca Pozzi, Paolo Seminati, Giuseppe Triacchini, Maria Luisa Venuta.
I Quaderni del CRASL possono essere richiesti a [email protected]. Università Cattolica del Sacro Cuore - CRASL, Via Musei 41, 25121 Brescia.
Luciano Canova, Enzo Di Giulio, Marco Grasso, Sara Lelli,
Stefania Migliavacca, Stefano Pareglio, Alessandro Vaglio
Operationalising Senian capability approach by modelling human development
1. Introduction 7
2. Sustainable human development 8
3. The operationalization of capability approach 11
4. The MiSS as an economic model: generalities 15
4.1. Introduction 15
4.2. Tastes, needs and reduced forms 16
4.3. Equilibrium notions in MiSS 19
5. The MiSS model: from theory to practice 21
5.1. The MiSS model consistence with the Senian approach 21
5.2. Public Finance Modelling 23
5.3. Governance Box 25
6. The architecture of MiSS model 28
6.1. The income box 28
6.1.1. Technology 29
6.1.2. The accumulation of human capital 31
6.2. The employment box 32
6.3. The environment box 33
6.4. The transportation box 35
6.5. The shelter box 36
6.6. The education box 37
6.7. The health box 38
6.8. The security box 41
6.9. The R&D box 44
7. Results 46
7.1. Employment 46
7.2. Environment 47
7.3. Transportation 50
7.4 Shelter 51
7.5. Education 52
7.6. Health 53
7.7. Security 55
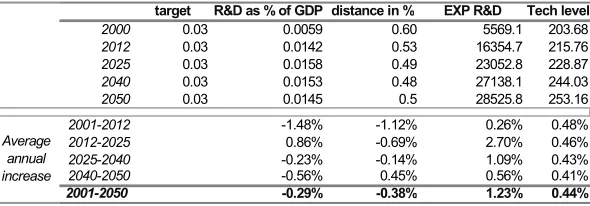
7.8. R&D 56
8. Conclusions 57
Sommario: Questo modello rappresenta un tentativo di operazionalizzazione del capability approach di Amartya Sen attraverso l’impiego dell’analisi su sistemi dinamici. Il nostro obiettivo è quello di studiare le variazioni nel corso del tempo di alcuni funzionamenti considerati come proxy delle capabilities.
Il modello è composto di due sezioni: la prima, denominata ‘Left Side’ rappresenta la ‘domanda’ dei funzionamenti stessi in una situazione ideale; la seconda, denominata ‘Right side’, indica invece l’‘offerta’ di un certo livello di funzionamenti che il sistema socio-economico è in grado di garantire agli individui.
Il modello è specificato per il caso italiano è può essere simulato su orizzonti temporali prestabiliti: su ogni periodo, si tiene conto della differenza tra situazione ideale e reale che innesta un meccanismo di risposta a livello di policy e determina la dinamica di quello che, in ultima analisi, consideriamo sviluppo umano.
Abstract: In this paper we model sustainable human development as intended in Sen’s capability approach in a system dynamic framework. Our purpose is to verify the variations over time of some achieved functionings, due to structural dynamics and to variations of the institutional setting and instrumental freedoms (IF Vortex).
The model is composed of two sections. The ‘Left Side’ one points out the ‘demand’ for functionings in an ideal world situation. The real world one, on the ‘Right Side’ indicates the ‘supply’ of functionings that the socio-economic system is able to provide individuals with.
The general model, specifically tailored for Italy, can be simulated over desired time horizons: for each time period, we carry out a comparison between ideal world and real world functionings. On the basis of their distances, the model simulates some responses of decision makers. These responses, in turn influenced by institutions and instrumental freedoms, ultimately affect the dynamics of real world functionings, i.e. of sustainable human development.
1.
Introduction
The notion of welfare highlighted by the utilitarian framework that forms the basis of mainstream economics offers only a limited perspective of human well-being. In fact this notion reflects only the class of differences captured by money metric, under the economic rationality of self-interested utility maximization. Moreover, the income approach to well-being doesn’t account for the diversity in human beings and for the heterogeneities of contingent circumstances1.
It is preferable therefore to enlarge the notion of well-being in order to encompass other important dimensions – social, environmental, institutional, intergenerational – for the flourishing of human beings that utility metric does not account for. This perspective can be intended as a model of development which advances economic and social justice, protects the environment, strengthens institutional capacities and protect the freedoms of future generations. In brief, this is the notion of sustainable human development, as intended in Sen’s capability approach.
The ultimate goal of this paper is to point out a possible a way of modelling and simulating the evolution of sustainable human development over time through system dynamic analysis. In doing so, we monitor the variations over time of some achieved functionings, due to structural dynamics and to variations in the institutional setting and in instrumental freedoms (IF Nexus).
Section 2 defines the notion of sustainable human development according to the capability approach. Section 3 deals with the operationalization of the capability approach. Section 4 highlights the generalities of the simulation model, focusing on the relationships between MiSS and the notion of equilibrium in economic theory. Section 5 sets its underpinnings and main strengths and weaknesses. Section 6 depicts specifically the architecture of the proposed framework. Section 7 and section 8 conclude the report by presenting the most relevant findings, analysing and discussing the different scenarios obtained through the running of the model.
1
2.
Sustainable human development
Sen’s conception of sustainable human development departs from the traditional Bruntland’s one2 insofar its focus is on the broadening of human freedoms on a sustainable basis, rather than on needs. In fact he has continuously underlined the importance of entitlements, opportunities, and freedoms as conceptual foundations of social choice.
In the latest thirty years Sen has been developing an approach based on individuals’ possibilities to pursue their own project of life in terms of doing valuable acts and of reaching valuable states of being. This perspective is the core of the capability approach, whose main novelty lies in the definition of a broader theoretical framework of well-being, stressing the importance of enjoying enduring essential freedoms to reach a specific project of life, dependent at the same time «on a number of contingent circumstances, both personal and social» (Sen, 1999:70).
In spite of the fact that Sen’s interest seems to be mainly focused on the role played by the capability approach as a framework of thought aiming at highlighting the drawbacks of other social choices approaches, this approach can also be considered a method for making interpersonal comparison of well-being. In fact Sen himself, though acknowledging the empirical difficulties, ascribes significant importance to the practical usability of the theory he has put forward: «the approach must nevertheless be practical in the sense of being usable for actual assessment» (Sen, 1987(b): 20). In this sense we intend to rely on the capability perspective, used for exploring a number of social issues such as well-being and poverty, liberty and freedom, living standards and development, gender bias and sexual division, justice and social ethics (Sen, 1993: 30, note 1), to analyse the evolution of sustainable human development.
In the capability approach human development implies the broadening of individuals’ potential, being individuals the very ends of developments, rather than its mere means. Actually, in Sen’s vocabulary sustainable human development is closer to the notion of
2 In the Bruntland Report (1987) sustainable development is intended as a form of
agency than to the narrower one of well-being: the latter in fact refers to a personal situation in term of achieved functionings and includes also sympathy, a concern for others’ achieved functionings (or others’ well-being); while the former taking into account commitment, is more inclusive insofar it relates also to the willingness to actually support other individuals in pursuing their projects of life regardless of
the impacts on one’s own well-being3. Hence sustainable human
development considers in its agency notion a real social commitment, stronger than the sort of proximity to other individuals put forward by the notion of well-being. So, basically, we use the term well-being interchangeably with sustainable human development, instead of the more appropriate agency to keep on with the traditional vocabulary of the literature on the argument.
This Senian approach has profound roots in philosophy and classic economic theory. Both in fact take extensive note of the issue of human development: «The approach [to human development] reclaims an old and established heritage, rather then importing or implanting a new diversion» (Anand and Sen, 1994b: 3). More specifically, Sen’s work has evident relations with Aristotle’s human flourishing and «strong connections with Adam Smith’s analysis of ‘necessities’ and conditions of living» (Sen, 1999: 24), concerning the ability of people to choose a reasonable life. Furthermore, Sen in the critic of utilitarianism is also close to the Marxian approach. In fact the latter seems to valuate goods themselves as intrinsically good in what is called ‘commodity fetishism’. What he tries to establish is a sort of ethic foundationalism not rooted in a metaphysical principle, rather in ethical concepts intrinsically important for human lives: «We must ask which things are so important that we will not count a life as a human life without them? Such an evaluative inquiry into what is deepest and most essential in our lives…can be a way of looking at ourselves, asking what we really think about ourselves and what olds our history together» (Sen, 1992: 210).
In Sen’s view of human development individuals are not simply people with needs, but they are «agents of change who can -given the
3
opportunity- think, assess, evaluate, resolve, inspire, agitate, and through these means reshape the world» (Sen, 2000: 1). The enlargement of substantive human freedoms is at the core of Sen’s perspective. In brief, the capability approach requires «a broader informational base, focusing particularly on people’s capability to choose the life they have reason to value» (Sen,1999: 63), to highlight the social and economic factors which give people the opportunity to achieve such a valuable project of life. Thus the capability approach concentrates directly on substantive freedoms of individuals involved. In this sense, Sen suggests that well-being be considered in terms of human functionings and capabilities. Functionings relate to what a person may value doing or being: they are the living conditions achieved by an individual and represent a set of interrelated activities and states (‘doings’ and ‘beings’) that form her life. Capabilities concern the ability of an individual to achieve different combinations of functionings, and define the freedom to choose the life that she prefers. These two categories are complementary but however distinct: «A functioning is an achievement, whereas a capability is the ability to achieve. Functionings are, in a sense, more directly related to living conditions, since they are different aspects of living conditions. Capabilities, in contrast, are notions of freedom, in the positive sense: what real opportunities you have regarding the life you may lead» (Sen, 1987: 36). It is not the aim of this paper to reconsider all the theoretical issues concerning this approach, since they have been thoroughly analysed in the literature. Rather, here we intend to define a model for monitoring the evolution of sustainable human development according to Sen’s view.
Sustainable human development, as pointed out, can be generally intended as an increases in the quality of life, both equitable and durable. In this sense «[the human development approach] applies …to the freedom to lead lives that people today and in the future value» (Anand and Sen, 1994b: 6). Accordingly Sen himself defines sustainable development «as development that promotes the capabilities of present generation without compromising capabilities of future generations» (Sen, 2000: 5). It is in fact a point of view strictly consistent with the extension from the fulfilment of needs to the enhancement of human freedoms on a sustainability basis.
includes consideration on the quality of life of each future generation, combined with concerns of intragenerational equity, and pays attention to the ability of meeting ones’ own goals. The very difference between the two approaches lies in the evaluative conception. The Bruntland’s approach views human beings only in terms of needs and fulfilment, Sen’s one underlines the importance of freedom to enhance human capabilities: «[So. That is,] if you broaden sustainable development as sustaining the freedoms that people have, expanding freedoms and sustaining the freedoms that we have, I think we can get an adequately broad view of it. And that is the direction I would like to push the sustainable development literature to go. And it is an important distinction because quite often on the ground that ends justify the means - a very bewildering sentiment - people do things, recommend policies in the name of sustainable development, that begin by obliterating something very worth sustaining, namely human freedom.» (Massarenti, interview with A.K. Sen, 2000).
To sum up, Sen suggests that human development coincides with the expansion of capabilities («..[a] development that promotes the capabilities of present people…», Sen, 2000: 5). If this enlargement of the space of choices is expected to hold in the future («…without compromising capabilities of future generations», ibid: 5) it is possible to refer to it as sustainable (human) development. Finally, in a practical perspective, Sen recommends that «In detailed application, a general idea of this kind [i.e. sustainable development] can, of course, be combined with more precise articulation (taking contingent note of the availability of data and information», ibid: 3). On this ground, therefore, in the following sections we outline a possible model for measuring through system dynamics analysis sustainable human development as intended in the capability approach.
3.
The operationalization of capability approach
We consider the capability approach primarily as a method for making interpersonal comparison of well-being. Indeed, in Sen’s intention it has far wider implications: it is first of all a framework of thought, which aims to highlight the drawbacks of other approaches in identifying and defining well-being and human development. Since Sen’s interest seems to be mainly concerned with this foundational level, he has never provided a formula or path to carry out welfare and
development measurements and comparisons4. Actually, vagueness is
a distinctive character of the capability approach, for it depends on the context, which is as ambiguous and complex as human life and values are.
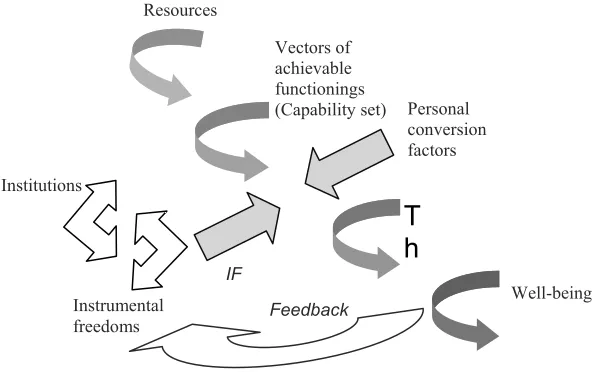
In general, Sen’s approach requires the translation of resources into valuable beings and doings (i.e. functionings), from which the various combinations of achievable functionings may be chosen (this possibility of choice forms the space of capabilities). In other words, resources, sifted by personal and social conversion factors, allow the attainment of a number of beings and doings, which may be represented by the vectors of achieved functionings5 (or the capability set). Moreover, the conversion of resources into functionings is supported by a set of instrumental freedoms, which promote and enhance institutional efficiency and effectiveness and thus uphold the success of the translation process (we call this complex connection ‘the Institutions-Freedoms – or IF – vortex’6). Finally, the choice of a specific subset (a vector) of functionings generates a given level of well-being, which in turn can eventually ‘tune-back’ institutions and their responses.
4
With great disappointment of those who have looked into Sen’s writings for these ‘recipes’.
5
Achieved functionings could be alternatively seen as an elementary valuation of the capability set. In this sense – only in this sense – functionings and capabilities coincide.
6
Resources
Vectors of achievable functionings (Capability set)
T
h
Well-being Personal
conversion factors
Instrumental freedoms Institutions
[image:14.425.59.360.86.272.2]Feedback IF
Figure 1 – The capability approach: a general view
We consider this schematic, and intrinsically dynamic representation as the capability approach itself, quite consistent with Sen’s view of well-being: «We use incomes and commodities as the material basis of our well-being. But what use we can respectively make of a given bundle of commodities, or more generally of a given level of income, depends crucially on a number of contingent circumstances, both personal and social» (Sen, 1999: 70). These different contingent circumstances «make opulence … a limited guide to welfare and the quality of life» (ibid: 71).
In order to operationalize the capability approach we must introduce a major simplification7: we restrict the model to the space of the chosen vector of functionings. In doing so we avoid the issue of the measurement of capabilities, and bypass the problem of their
7 We are aware of other areas of incompleteness with respect to the foundational
unobservability8. Therefore, we too stick to Basu’s suggestion
reported in Brandolini and D’Alessio (1998:15) : «…to go along
with Sen and evaluate well-being on the basis of functionings, but be content with achievements, instead of capabilities». Sen himself suggests that at a practical level the most appropriate focus of attention should not always lie in the measure of capabilities: «Some capabilities are harder to measure than others and attempts to putting them on a ‘metric’ may sometimes hide more than they reveal» (Sen, 1999: 81). Furthermore, the chosen vector of functionings could be seen as an elementary valuation of the capability set, which depending on the appropriate choice of the elements of the vector (e.g. assuming a maximizing behaviour), can in turn be considered as the maximally
valued one9: «the focusing on a chosen functioning vector coincides
with concentration on the capability set, since the latter is judged, ultimately, by the former.» (Sen, 1999: 76 – emphasis in the original). In fact, although Sen claims the necessity of specifying deprivation or achievements in terms of capability, he provides no definitive argument for this point. So we can say that a universal need for A can be a proxy for a universal capability to A, considering A sufficiently general in order to permit different specifications in different contexts (as we try to do in our model).
From a theoretical point of view the reference unit of the capability approach is the individual, functionings and capabilities being in fact properties of individuals. More specifically, Sen moves in the space of moral individualism and considers the individual as the only unit that counts when evaluating social states, avoiding at the same time to reduce society to the mere sum of individuals and their properties, as set by ontological individualism. In other words, the use of different units of analysis (groups based on age, gender, administrative boundaries or other elements) in the empirical work points out intergroup variations, but according to Sen (1992: 117, n.1) the focal point of the analysis remains the individual, since the interest in group
8
In fact their potential nature can become actual only after an individual’s process of choice.
9
is only derivative (i.e. regarding the differences among individuals placed in different groups) and not intrinsic (i.e. regarding the differences between groups seen as unique bodies). Nonetheless, Sen’s moral individualism does not forget that the human being is a zoon politikon, insofar her evaluative process is shaped by a number of social elements, such as the social conversion factors and, mainly, the IF vortex. Indeed in Sen’s words, as pointed out by some observers, there is a deep interest for the institutional basis of human life, and his concern for the individual seems rather formal, or at least instrumental, insofar individuals are member of a community (Comim 2001: 9). For these reasons it is possible to use the capability approach to assess social well-being, that is some form of aggregation of
individuals’ well-being10. In other words, focusing the capability
approach at a macro level indeed implies the loosing of the keener in-depth perspective of individual analysis. But this is the price we have to pay to obtain a policy tool, which hopefully could be useful for a keener comprehension of sustainability dynamics over time.
Sen himself in applying the capability approach refers to regional, national, sub-national, or group data. For instance, when examining poverty and deprivation in India and Sub-Saharan Africa (Sen, 1999: 99-104), he draws on national and sub-national level data. Or, when dealing with gender inequality, he works both with different territorial level and group data (Sen, ibid: 104-107).
4.
The MiSS as an economic model: generalities
4.1. Introduction
The purpose of this sub-section is to discuss some general properties of MISS as an economic model. Such a discussion is needed since MISS cannot be considered as a conventional model of the economic system. There are two reasons for this: first, to some extent MISS goes beyond the customarily set boundaries of economic models, in that it attempts at modelling variables and phenomena which are usually attributed to the broader realm of social science;
10
secondly, even its purely economic component is rather eclectic as far as theory is concerned. The latter feature is not unrelated to the first one.
The model of the economic relations among agents and
institutions which MISS embeds will be discussed with
reference to two main issues: the role of individual preferences
and the equilibrium notion in use.
4.2. Tastes, needs and reduced forms
There are three basic ways of approaching the consumption11
behaviour of groups and individuals in economics: the taste-based view; the need-based view; the reduced-form view.
The taste-based view builds on:
- the notion of preference ordering on some set of alternatives;
- a set of axioms conveniently restricting the set of admissible
orderings;
- a definition of the subset of admissible alternatives.
Finally, the agent is assumed to select the preferred alternative out of those included in the admissible subset.
This approach has a much broader scope than it is suggested by its highly abstract setting; on the contrary, its power lies in its abstractness. The greatest intellectual success of this approach is represented by general equilibrium models where alternatives are represented by bundles of contingent commodities, admissible sets are budget sets and the individual choices are coordinated by a proper set
of prices12. The outcome of the coordination process depends
crucially on whether or not markets are available for each commodity, no matter how large the space of commodity is, on market power and on the distribution of information. It is important to
remark that the celebrated Welfare Theorems do not represent per se
to an apologetic of real world ‘free’ markets; they rather represent a key to understand what happens when the above requirements (completeness of markets, perfect competition, symmetry of
11 Including consumption of future goods, or even consumption by future generations,
which brings under the same heading consumption, saving and bequest behaviour.
information) fail and what policy responses may be. For a strict follower of this approach, the procedure should then be the following: 1. Determine for a given set of initial endowments the
Pareto-Optimal (paths of) resource allocation.
2. After defining the set of markets, tastes, technology, market power and distribution of information, determine the equilibrium allocation.
3. Define the optimal (least distortionary, second best) policies to bridge the gap (if any) between Pareto optimal and equilibrium allocation.
As a matter of fact, this approach plays a minor role in the MISS model (and given the aspiration to generality and the self-consistency of this approach, this more or less amounts to say that it plays no role). Only in the production-accumulation section of the model (see below) some notion of equilibrium is implicitly used.
What are the reasons for this neglect of such an important theoretical basis in MISS model? The main reason lies in the treatment of equity and ethical issues.
Within the general equilibrium approach we are able to distinguish between efficient and inefficient allocations, not between ‘just’ or "fair" allocations and allocations which are not. To make an example, a certain degree and spread of drug addiction can be socially optimal (in the sense that at least one agent would be strictly worse off at an alternative allocation) but this is different from judging that degree and spread socially desirable from an ethical or philosophical point of view.
jail system). Te be sure, the need-based approach requires a statement of ‘preferences’ on the part of the researcher, who can no longer simply take given individual ‘demand’ as the only guiding line.
In the MISS model the need-based approach represents the essential ingredient. The reasons have been exposed in Section 2 (see Di Giulio-Grasso, 2003 on Sen). The very basis of the MISS model is population, and population is seen (in principle) as a collection of individuals, each carrying a set of age-, gender-, and nationality-specific needs (although in the present version MISS features one ‘average’ population. Then as population grows and changes in structure, a whole set of needs increases and is modified as regards both the range and the amount of goods required.
The structure of needs represents what we call the ‘left-hand side’ of the model. It is important to notice that needs are not derived by individual preferences. Different principles apply to different types of needs (tentative list)
1. Politically set targets (example: Kyoto Target);
2. International comparisons (example: the European average for the R&D expenditure/GDP rate);
3. Maintenance or ‘reasonable’ improvement of achieved levels (example: one-third reduction in crime rate).
Leaving aside for the moment the theoretical reasons for not resorting to a general equilibrium approach, there are also some practical issues coming to the fore. General equilibrium models specify and analyse full set of market interactions between individual agents. Since however the focus of the MISS project is on the relationships among subsystems (economic-institutional-social) rather than on the interactions among agents within the economic subsystem, a full general equilibrium modelling would add too much complexity to an already complex setting. Even a static, certain, standard-preference and complete-market general equilibrium model would do so, let alone a slightly extended one.
work: observation is never neutral, since it is theory (not necessarily a full-fledged theory, some broad a priori view is sufficient) which tells us what to observe and how to observe it. Nevertheless, it is sometimes reasonable to incorporate in a model some empirical ‘law’ without enquiring whether available theoretical explanations of that regularity are consistent with the general theoretical ‘mood’ of the model itself. In MISS we make a large use of these reduced forms especially in the so-called right-hand side of the model. One example for all is the mechanism determining schooling levels. Reinterpreting Checchi-Brunello (2003) we assume there that difference between the schooling levels of two individuals corresponds to one half of the difference between the schooling levels of their parents. Obviously, a complex theoretical story lies behind this empirical relationship (and indeed, more than one sensible story could be told about it ): however we do not discuss the theoretical explanation and simply ‘use’ the relationship. Similarly, the introduction of a constant marginal propensity to save skips all theoretical modelling of intertemporal choices.
4.3. Equilibrium notions in MiSS
When in Section 2 we described the taste-based approach to consumption decisions, we also briefly mentioned the role of prices in the coordination of decisions in a general equilibrium setting. As a matter of fact, equilibrium within that approach means market equilibrium, and the assumption is that prices adjust to clear all markets. In MISS, the notion of market equilibrium and of price adjustment play a minor role, consistently with the almost nil weight that the taste-based approach has in our work.
details). Then implicitly we assume that the wage and the rental rates of physical/human capital adjust so as to equate demand and supply for labour and productive stocks. On the other hand, these prices have no influence on current and even future supply of factors, so that we can disregard them in our analysis.
The other is the market for private consumption/savings. However, consumption is the residual left after deducting taxes and capital accumulation from income, so that equilibrium in this market is warranted.
There is however in MISS another important non-market equilibrium mechanism. By equilibrium here we mean a situation where the left-hand side of the model coincides with the right-hand side, i.e. where the needs of the individuals are satisfied on a permanent basis.
Three important features distinguish the role which this equilibrium plays in our model.
First, the adjustment mechanism does not rely on prices. It is instead a political adjustment: the government is assumed to react to
disequilibria by changing both the level of the taxation and the
composition of public expenditure, according to a fiscal rule which can be summarized as follows (for a more precise description, see Paragraph 4.2 below). Public Funds are raised by means of income taxation. They are allocated to different type of expenditures according to the weight that different functionings have in the political agenda. Such weights depend in turn on a (fixed) basic budget share, which expresses the general policy attitude of the government, and on an index of the distance between the actual and the target level for the functioning. The latter element may be seen as an indicator of the ‘pressure’ from public opinion, opposition, citizen’s mobilisation, etc., to meet that specific need.
Secondly, private consumption and investment in physical and
human capital do not react to this kind of disequilibria, that is to
implicitly say that markets do not provide the goods required to satisfy these needs.
Third, there is no ex ante reason to expect the adjustment
First, in spite of a great ‘pressure’ for solving, say, environmental needs (i.e. in the presence of a large difference between actual and target level of GHG emissions), government may place a very low basic budget share on such a target, thereby allocating a small share of the budget to environmental policies;
Second, if all ‘pressures’ (differences between actual and target levels) simultaneously grow on all functionings, the budget weight of , say, environmental policies may remain small.
[image:22.425.61.359.262.508.2]Third, policies may be poorly effective. Then, if a large effort is spent on a specific functioning (say, again environment) where policies have little impact, this may lead in the long run to increases in the differences between actual and target levels for other functionings. This increased pressure for spending on these functionings may lead in the long run to a squeeze on resources for environmental policies.
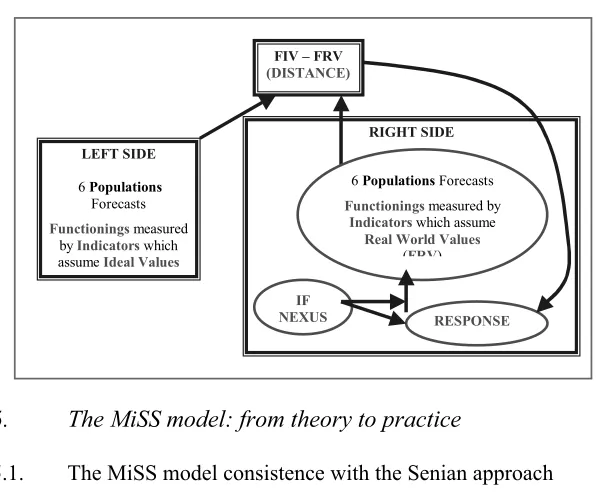
Figure 2 – An overview of the MiSS Model
LEFT SIDE
6Populations
Forecasts
Functionings measured by Indicators which assume Ideal Values
RIGHT SIDE FIV – FRV
(DISTANCE)
RESPONSE
6Populations Forecasts
Functionings measured by
Indicators which assume
Real World Values
(FRV)
IF NEXUS
5.
The MiSS model: from theory to practice
5.1. The MiSS model consistence with the Senian approach
not under any illusion that the capability approach to the standard of living would be very easy to use. It is particularly difficult to get an idea of a person’s positive freedom of choice – what he or she could not have done or been. What we observe are the actual choices and realizations. But the case for using the capability approach is not, of course, logistic convenience but relevance» (Sen, 1984: 87).
The MISS project structure, briefly outlined in the previous section, is based on the definition of a set of functionings used as proxies for capabilities.
On the left side (‘should be’) achievable functionings are measured by an ideal value that people could try to achieve. This choice could seem problematic: is not the case of a Basic Need Approach operationalization? This section tries to answer this all important question, focusing primarily on the MiSS strength points and on their consistence with the Senian theory.
First of all, the measurement of distances between ideal and real values of considered functionings that determine the institutional response, reproduces the mechanism through which instrumental freedoms turn into achieved functionings.
The dynamic interaction between each single part of the model is another peculiarity of the MiSS model. According to a systemic approach, each functioning is not an island, rather it is a constellation of interdependent elements continually interacting over time through feedback loops. This feature reminds to the Senian ‘social interdependence’ and justifies the choice of considering income as a functioning, while generally in the capability approach it is used only as an instrumental variable, a mean to reach a certain level of well-being.
The use of a systemic, aggregate, perspective could be somehow considered conflicting with the capability framework, which is basically individualistic. Nonetheless, as mentioned before, the MiSS model is run for six different populations. It considers gender differences and three age cohorts (0-18, 18-64, over 64 years), allowing the choice of the population for which the simulations are run. In doing this, we can grasp how the IF vortex actually works and include in a scenario analysis those variations that, to stay with Sen, «give us unequal powers to build freedom in our lives even when we have the same bundle of goods» (Sen, 1990: 121).
5.2. Public Finance Modelling
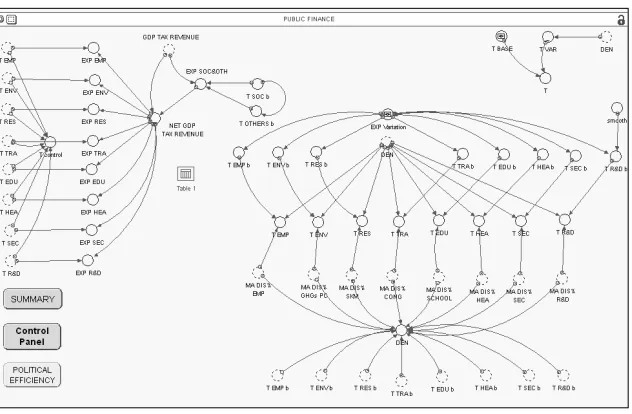
[image:24.425.58.374.285.492.2]In the MiSS Model the Public Finance box (see Fig. 3) plays a crucial role, insofar it describes the mechanism through which institutional response tries to reduce the distances between ideal and real values for each functioning.
Figure 3 – The Public Finance box
achievable functionings so that, for each of them, it is possible to calculate a specific tax rate. This tax rate is made of two components: a base value (controlled by a slider in order to make it possible to conduct a sensitivity analysis) and a variable component linked to ‘DEN’ (a synthetic index of distances). As distances grow, the tax rate increases in order to provide more revenue for political actions.
The variable labelled DEN is the strategic key of the model: it is the synthetic index of all the distances between left and right side functionings.
An example can prove useful to explain how it works.
In the Environment functioning the variable named ‘DIS% GHG PC’ represents the distance between the target level (should be side)
of per capita greenhouse gases emissions (GHG) and the real level
(will be side), of per capita GHG expressed in percentage (a number
between 0 and 1). The variable ‘T ENV b’ calculates, instead, the weight of public expenditures on environment in the base year with respect to total public expenditures.
‘DIS %’ and ‘T base’ values are derived in the same way for each functioning of the system, so that the final DEN index is the weighted average of the distances expressed in relative terms (e.g. DIS% GHG’s PC) and the weight of each public expenditure component in the base year (e.g. T ENV b).
If we still consider environment functioning (but the mechanism is the same for the other ones ) the real expenditures in different subsequent years are derived as follows:
(DIS% GHG’s PC * T ENV b)/ DEN index (1)
The variable expressed in (1) is labelled T ENV. In other words, given the weight in terms of expenditures, the more the distance of the environmental real functioning from the ideal one, the larger T ENV.
DEN index construction catches a particular aspect of the policy making process. Matter-of-factly institutional response does not automatically take place when a particular need emerges in one or more elements of the system, rather it is a process in which past trends and traditions in the political regulation of a particular issue have to be taken in consideration.
For instance, if in the environmental box there is a great distance
reasonable to foresee an adequate level of public expenditure to reduce the gap. In Italy, in fact, environmental issues have traditionally been neglected in favour of other aspects of the socioeconomic system, more politically rewarding. Moreover, given the absence of a deep-rooted ecologist consciousness, we can understand the reasons why public expenditure on environmental issues has never been larger than 3% of total public expenditure. So our expectations on tax revenue distribution must pay attention to this features, and the use of DEN index in the MISS model accomplishes this task.
In other words, DEN index can point out the cultural
dimension of political systems and its capacity of implementing
specific reforms, according to the relative weight attributed to
each issue in the control room, that is surely an element of
consistence with the Senian approach in its effort of considering
conversion factors and their impact on substantive freedoms.
5.3. Governance Box
The MiSS framework intends also to model the policy level, reproducing the context in which policy making takes place and describing the impact of institutional activity on the socio-economic system. This feature certainly represents one of the most important and challenging elements of consistence with the Senian approach. In fact it aimed to include in the resulting simulations the role played by the IF Vortex, specifically the transformation of instrumental freedoms in achieved functioning, and in the end the possibility for individuals to effectively define their project of life.
The governance box is based on the distinction between formal and informal institutional efficiency: the latter includes public opinion impact on the social environment, while the former depicts governmental action. Actually, both dimensions have a considerable impact on policy efficiency.
of veto players acting in the political system and can be represented by the number of significant laws passed in a political system.
A problem could rise in the definition of the significance of a law: Tsebelis considers significant only laws that lie at the intersection of
two international sources13. Taking Tsebelis’ dataset as a reference,
we have built an index, labelled POLICY CHANGE.
For instance, if we want to calculate the value of this index for country A, the formula to be used is:
POLICY CHANGE A = (Country A’s number of laws x years – min value of the sample/max value of the sample – min of the sample)
Where country A’s number of laws per years, min and max values of the sample are taken from Tsebelis’ dataset.
The numerator highlights the distance, in terms of number of laws per year, between country A and the minimum value of the sample, while denominator expresses the maximum possible measurable distance.
[image:27.425.55.373.343.448.2]POLICY CHANGE A represents the relative position of country A in the entire sample: it ranges from 0 to 1. The closer to 1, the more it is probable to foresee a policy change in country A. In the end, we can consider POLICY CHANGE as the probability of a policy change to take place in a specific context14.
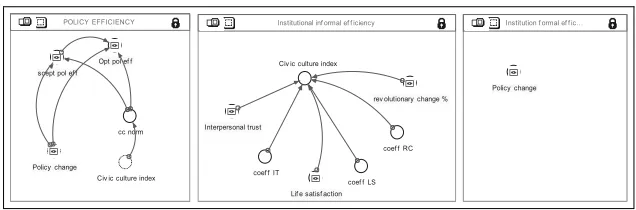
Figure 4 – The Governance box
Policy change
Civ ic culture index cc norm
Opt pol ef f Civ ic culture index
Interpersonal trust
coef f IT Lif e satisf action
coef f LS coef f RC rev olutionary change % scept pol ef f
Policy change
POLICY EFFICIENCY Institutional inf ormal ef f iciency Institution f ormal ef f ic…
13
Specifically, NATLEX, an ILO database of legislative systems, and Encyclopedia of Labour Law, edited by Blanpain and written for those lawyers from a country who want to practice law in another.
14
Informal institutional efficiency refers, on the other hand, to a Ronald Inglehart’s work (Inglehart, 1988: 1203-1230) which is in turn based on Almond and Verba classical study (Almond and Verba, 1963) and on Putnam survey on the impact of Italian regional reform (Putnam, 1983: 55-74).
‘Civic Culture’ (CC) index is a variable whose value is always positive and determined by three elements: interpersonal trust, life satisfaction and will of revolutionary change expressed in percentage values.
Interpersonal trust is measured by three Eurobarometers surveys (Eurobarometers Surveys, 1976-86) and refers to the specific question: “Now I would like to ask about how much you would trust people from various countries. For each country please say whether, in your opinion they are generally trustworthy, fairly trustworthy or not at all trustworthy”.
‘Life satisfaction’ (LS) refers again to Eurobarometers Surveys (Eurobarometers Surveys, 1973-1987) and to the specific question: “Generally speaking, how satisfied are you with your life as a whole? Would you say you are very satisfied, fairly satisfied, not very satisfied, or not at all satisfied?”.
Finally, ‘will of revolutionary change’ (RC) value is taken from World Values Surveys (World Values Surveys, 1981) and refers to the following question: “Please choose, between the following attitudes, the one which best describes your own opinion: a) the entire way our society is organized must be radically changed by revolutionary action; b) our society must be gradually improved by reforms; c) our present society must be valiantly defended against all subversive forces”.
The values of these three dimensions are all modifiable in a sensitivity analysis through the use of specific slider instruments.
In order to build an average weight between formal institutions efficiency and informal one, CC INDEX has to be normalised and divided by its maximum achievable value, so that the final variable, labelled as ‘CC NORM’, spans from 0 to 1.
CC NORM can be interpreted as the probability of a positive social environment, defined as an ideal context to implement specific political reforms.
noticed that both POLICY CHANGE and CIVIC CULTURE NORM values can be thought as probability values, so that final ‘POLICY EFFICIENCY’ gives the joint probability of the two factors. More specifically, POLICY EFFICIENCY value is a number between 0 and 1 and is the product of POLICY CHANGE and CIVIC CULTURE NORM: the final value is then linked to each functioning of the system as a multiplier coefficient having an impact on the effective response stimulated by the distance between ideal and real measured values.
We have also introduced another element of complexity in order to give the final user a great degree of autonomy in the simulations. As a matter of fact, it is possible to choose between two options: an optimistic and a sceptical one. In the former situation, political efficiency is assumed to occur when at least one of the two dimensions (formal or informal) exists in the socio-economic environment. In the latter, instead, political efficiency requires the simultaneous action of both formal and informal efficiency. In the control panel, through the use of apposite switches, the final user can choose whether to conduce the simulations in the optimistic or in the sceptical scenario.
The inclusion of governance dimension has a remarkable important role because, like in the public finance domain, political response to a specific problem does not arise automatically as a certain distance between target value and real functioning is experimented. Rather, factors such as Senian ‘social interdependence’ and governments failures may cause time lags between political decisions and their implementations. In order to be consistent with Senian approach, we have necessarily to catch these dimensions and this is the very scope of the governance box.
6.
The architecture of MiSS model
6.1. The income box
development. These statements do not imply that the economic system (and its representation) are unimportant. On the contrary, within the MiSS model, the economic system represents one of the most important ‘blocks’ of what we called the right-hand side or the ‘will be’ side, the other being the political-institutional block. The (bad or smooth) operation of the economic system results, at the end of the day, in the size and structure of the flow of goods (consumption/investment, durable/non-durable, material/immaterial, public/ private goods) which are , to say the least, complements to the functionings (and the ill-functionings) on which the MISS model focuses.
As a consequence, the issue of how to represent the economic system in the model can be hardly regarded as a trivial one. Let us begin by stating two desirable properties which this representation should have:
1. Long–run: the general setting of the MISS model is a long-run one, so that the economic ‘side’ also should allow for growth and accumulation;
2. Policy-sensitiveness: a policy-insensitive economic system would imply that public policies just redistribute resources to different uses, rather than also affecting the production of resources. A very simple, but flexible and manageable tool which satisfies both previous requirement is Solow’s model.
6.1.1. Technology
Solow’s one-sector model (1956) rests on the representation of the technology by means of a constant-returns-to-scale, decreasing-marginal-returns production function and on a the simple behavioural assumption that individuals devote a fixed share of their income to savings, which are entirely transformed into new physical capital.
The production function then is:
)
,
,
(
t t t tt
t
A
F
K
L
A
H
Y
where K is physical capital, L is raw labour, H is human capital
and A is the level of technology. K, H, and A are stocks and the
'
t , where ' is the unit of measurement of time (1 year in our
model). Lt is a the average flow of raw labour during the period
between
t
and t'. More precisely, we adopt a Cobb-Douglasform for the production function:
E E D D t t t t
t
A
K
L
H
Y
1 1Capital changes over time according to the equation:
t t t
t
K
s
Y
K
K
1(
1
W
)
G
where:s is the marginal propensity to save out of net-of-tax
income, W is the average tax rate on income, G is the rate of
depreciation of physical capital. The expression for the rate of growth of GDP becomes:
1 1
) 1 ( ) 1 ( 1 1 1 1 1 1 1 » » ¼ º « « ¬ ª ¸¸ ¹ · ¨¨ © § ¸¸ ¹ · ¨¨ © § W G E E D E D H t t t t t t t t t g n L H n L K s n A A Y Y Y
where
t t t L L L n{ 1and
tt t H H H H
g { 1
. These two growth
rates, together with
t tA A1
, are determined endogenously to the
model. In the next paragraph we discuss human capital
accumulation, while the growth of raw labour force is discussed
in the employment box and
t tA A1
6.1.2. The accumulation of human capital
Let us for the moment leave aside the rate of growth of labour and concentrate on the growth rate of human capital. The model embeds the idea that the accumulation of human capital by an individual depends on his/her family background. Checchi and Brunello (2001) find, in large cross section of individuals, that one additional year of schooling of parents translates into one-half additional year of education for the sons. More precisely, if we take two individuals, the difference between their numbers of years in school is estimated to be half the difference between the numbers of school-years of their
parents. If we take son s and son s', with parents p and p', we have:
''
5
,
0
p ps S
H
H
H
H
Since we work in time and not with a cross-section, we translated
the above result as follows. The stock of individuals living at time
t
are supposed to have parents who, on the average, had the same age of theirs 25 years before. Then the difference in schooling between
individuals living at time t1 and individuals living at time
t
isdeemed to be half the difference between the school-years of the
individuals living at time t24 and individuals living at time
25
t :
24 251
0
,
5
t t t
t
H
H
H
H
and t t t t t t t t H H H H H H H H H g 25 25 25 241 0,5
6.2. The employment box
MiSS is a long-run model, so that short-run phenomena such as unemployment due to lack of effective demand is absent. It is the employed labour force which contributes to determining the level of GDP, and not the other way around. The employed labour force depends on population through the employment rate. The target rate of employment is set to 0.47. There are three possible sources of structural unemployment, which may prevent the actual employment rate to equal the target employment rate.
1) Unemployment due to malfunction of the labour market;
2) Technological unemployment;
3) “Complementarity” unemployment, due to lack of fixed
capital.
Then the equation from employment is the following one:
t t t A t t t k t t t t t L A A c L K K c N N r L L ¸¸ ¹ · ¨¨ © § ¸¸ ¹ · ¨¨ © §1 1 1 1 1 1
where
r
t is the rate of employment of the last period andN
t ispopulation at time t. The term t
t t k L K K c ¸¸ ¹ · ¨¨ © § 1 1 means that
employment grows to keep the capital/labour ratio constant, to an extent which depends on the
c
k coefficient. Thec
k coefficient is set to equal 0.1 which means that an increase of ten percentage points in the growth rate of capital causes an increase in the labour force of one percentage point.Finally
c
A is the technical progress coefficient, which is set equal to 0,2, meaning that an increase of total factor productivity by ten percentage points implies a decrease of two percentage points in employment.Unemployment is then given by the difference between actual employed and the target level of employment, i.e. 47% of population.
6.3. The environment box
forests. On the basis of the government climate change policies, we assume that they can give rise to a global reduction of emissions equal to a 25 Mton GHGs/year. As the distance between the right and the left side approaches zero, policies slow down.
6.4. The transportation box
solve the problem of congestion, in so far the kilometres travelled by vehicles tend to increase and adapt to the road network, it is not possible to propose policies that lower our indicator acting on its denominator by increasing it. For this reason, we thought of policies which affect the numerator (kilometres travelled by vehicles) and reduce it through a shift of mobility from road to railways. This shift is encouraged by public expenditure: money should be invested in increasing railway network to easy the shift from road to rail, both for passengers and freight. In particular, we assumed the following cost for shifting a passenger-km and a ton-KM: 0.7 Euro and 0.2 Euro. Due to the fact that shifting freight from road to railway is cheaper than shifting passengers, we combined the two indicator by giving them weight 0.2 (vh-km/road net) and 0.8 (tr-km/road net). Both these values can be changed by any user. As the distance between the right and the left side approaches zero, policies slow down. We also considered road accidents per traffic as a ‘dys-functioning’ related to safety, even if this distance is not relevant in our model.
6.5. The shelter box
to 3.5%. The right side value in year 2000 is 36 square meter per capita, while the target is 50 square meter per capita.
6.6. The education box
In a Senian perspective, educational issues perform a key role in the empowerment of human instrumental freedoms and in the transformation of capabilities in achieved functionings: for this reason the importance of such a box in the MiSS model is straightforward.
As already mentioned in paragraph 5.1.2, in the left side, we use an indicator taken from a study of Brunello and Checchi (2001): the average years of school attended by population.
The relevant literature on the matter often uses other indicators for human capital, such as enrolment rates or ISCED (level of education and training), specific for different educational programmes: the use of ‘average years’ of school in this model, instead, has the advantage of catching distributional effects of educational attainment among population.
In the regression cited above (Brunello and Checchi, 2001), the dependent variable (average years of school) is explained by two different factors: school quality, proxied by the pupil/teacher ratio (the lower is the indicator, the higher is school quality) and family background, that measures the impact of parents’ level of education on their children one.
To estimate the impact of family background and school quality on returns to education, we use a two-steps model. In the first step we use the following equation:
H
J
E
D
X EY
where Y is log annual earnings, D represents region of birth, X is a
vector of individual controls, E the years of education and J the
returns to education.
In the second step, we retrieve the estimated values of J and
estimate the relation:
H
V
\
I
O
where O catches the control variables, Q represents school quality calculated through the pupil-teacher ratio W represents family background.
The data used in the MiSS model are taken from the ‘Survey on the Income and Wealth of Italian Households’ (SHIW – Banca d’Italia) and from OECD online database.
Pupil-teacher ratio is then computed endogenously as follows: the number of pupils attending different educational programmes is considered as a decreasing function of Italian Population (with a decrease rate calculated on the basis of historical series) while teachers number is obtained dividing the total amount of public expenditures on education for the average wage level taken from OECD (on which the policy efficiency switches have their impacts).
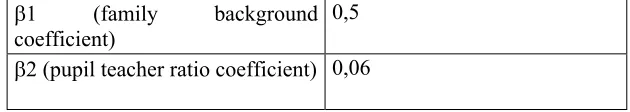
[image:39.425.54.369.286.342.2]The empirical study (Brunello and Checchi, 2001), gives also the values of regressions coefficient used in the MiSS simulations. Here are the values:
Table 1 – Education coefficients
E1 (family background
coefficient)
0,5
E2 (pupil teacher ratio coefficient) 0,06
Another important feature of the education box is represented by the existence of a connection with the security box, that we will describe in the specific subsection: we assume that part of the disposable public budget on security issue is addressed to finance educational programmes, because educational attainment is assumed to be the most important element capable of reducing crime ratio.
6.7. The health box
Again as in the previous subsection we have to stress the importance of those elements, in the capability approach, capable of enhancing human freedoms: health level is certainly one of the most important, so that, within the MiSS model, the health box is crucial.
the level of health plays an important role in the income box (healthy people are supposed to earn more than unhealthy ones) but it is strictly linked also with educational attainment.
Literature on health policy is really extensive but we focused our attention on the analysis of health policy efficiency.
In particular, we refer to WHO World Report, because WHO is the organization with the most precise studies about health issues, with datasets covering 191 countries.
It is not simple to define in what sense an health system can be considered efficient: the WHO Report of 2000 introduced an indicator, the overall goal attainment, trying to capture five dimensions: health level and its distribution among population; responsiveness of health system (the non-health components of a health system, such as waiting lists and other elements) and its distribution among population; the way of financing a health system.
The overall goal attainment is then measured by an index ranging from 0 to 1 (Italy is one of the most efficient countries with 0,991) and comprehending all the above variables. WHO the same underlines the risk of overestimating efficiency. The fact that the countries ranked in the first positions have efficiency index above 0.97 does not mean that they could only improve their systems by 3%. It means that, compared to the most efficient country in the sample, they could improve by 3%. According to these reasons, in the MiSS model we use the results of an empirical study (Evans, 1999) in which the efficiency of health system is compared throughout 191 countries for the period 1993-1997.
In terms of output, it is generally agreed that one important goal of the health system is to improve population health. We measure health taking into account both mortality and ill health rather than using an indicator such as life expectancy at birth which relates solely to mortality. Our approach is based on an indicator of healthy life expectancy (DALE), whose measured are constantly updated by WHO.
It is well recognised that health is not solely a function of services provided by the health system, however broadly the system is defined. Identifying relevant variables that are available for all countries, but which are not highly correlated with health expenditure per capita, is difficult. For example, income per capita – one of the most obvious indicators of general development – is highly collinear with health expenditure per capita. While it would be possible to add income per capita directly into the estimated equations, income is not a direct determinant of the production of health. It works through other inputs such as education and housing, and it is better to capture these inputs directly. The most widely available information on non-health-system inputs to production is for education, and the most sensitive indicator of the relevant kind of educational attainment is average years of schooling in the adult population, the same variable used in the education box, making it possible to exploiting a feedback loop.
Thus, three data series are used in our model: DALE, health expenditure and average educational attainment in the adult population. Our panel covers the years from 1993 to 1997 and variables are expressed in logarithm.
With regards to the target level, we consider as an optimum for DALE 90 years of healthy life expectancy, as a desirable but feasible goal for the future.
Here is the estimated equation:
H
E
X Y
where Y is DALE, X is the matrix of regression variables, and Hҏis
the coefficient vector.
The table of coefficients is the following:
Table 2 – Health coefficient
The cited study concludes saying that «efficiency is positively related to the level of health expenditure per capita. Indeed, the
E1 (health expenditures coefficient 0,008
results suggests that it is very difficult for countries to be good performers below an expenditure per capita of approximately $60 in 1997 international dollars. This implies that there is an apparent minimum level of health expenditure below which the system simply cannot work well…There is still enough variation in efficiency at all levels of expenditure to suggest there are two critical ways of improving health outcomes. The first is to increase the efficiency of the health sector; the second is to increase health expenditures» (GPE Paper n.6).
This feature stresses the importance of public intervention in a delicate issue such as health and focuses on one of the strength point of MISS: public finance box and the public response determined by distance between target value and real one represents for sure an element of consistence with Senian approach in describing the way of transforming capabilities in achieved functionings.
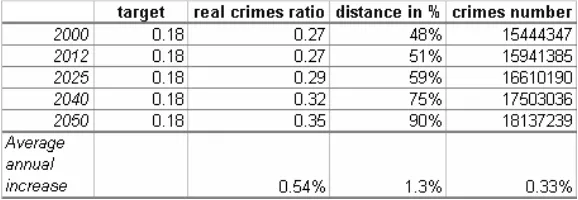
6.8. The security box
Another important block in the MiSS model is represented by the security box, in which, as in the environment section, a ‘dis-functioning’ is measured.
The choice of an indicator is particularly difficult here, because the security functioning is characterised by a lot of dimensions: the prevalent typologies of crime, the efficiency of judiciary system, the nature of security public policies.
Within the MiSS model, we have chosen as a proxy for security level the property crimes ratio (number of property crimes pro-capite), due to the following reasons:
1. conceptual reason: being Italy an industrialized country, it is probably more effective in representing the incidence of crime the reference to property crimes, which are the most widespread in a rich developed nation;
2. operative reason: we can refer to a very precise dataset taken from International Crime Victims Survey (1996), containing crimes statistics of 19 industrialized countries.
expenditures on security are made essentially of two components: a first one referring to the functions of criminality control and repression (not considered in our model) and a second one that contributes to support education programmes, since education is thought to be an important deterrence variable against criminality. So the model tries to calculate the additional number of pupils attending high schools and universities thanks to educational programmes financed by public security budget.
Another point to be discussed, before describing the equations of the box, is the choice of a target value: who can point out objectively which is the optimum for the number of property crimes?
We assume that the target is equal to 0,18 which is 2/3 of the current value in Italy (0.27). Just to give an idea of the meaning of these numbers, the International Crime Victim Survey (1996) tells us that the best score, i.e. the country with the lowest crime rate in the sample is Finland (0,11).
On the right side, instead, the theoretical model is an individual’s choice model between education, work and crime and is inspired by different econometric studies (Buonanno, 2003 – Marselli Vannini, 1997).
As we said before we want to represent the relationship between the number of property crimes and two variables: the level of education (defined as the number of high school and university students), and the level of employment. In particular, we assume that an increase in higher education and employment reduces the criminality index. We defined a simple equation
Crimes_edu_emp=(EMP^(ȕ1))*(High_Pupils^(ȕ2))
Where ȕ1ȕ2are negative and represent the employment elasticity of
Table 3 – Security coefficients
ȕ1 (“EMP” exponent) -0,2
ȕ2 (“High Pupils” exponent) -0,05
That is to say that if the number of employed increases by 10%, criminality decreases by 2%, and similarly if the public educational programme increases by 10% the number of students in high schools and universities, criminality decreases by 0.5%.
This equation gives us the effect of education and labour policies on security. Actually since we want to match the crimes ratio with its real value, we calculate the growth rate of ‘Crimes_edu_emp’ and apply it to a stock variable ‘crimes number’. The initial value of this stock is exactly the total number of property crimes registered in 2000. Then dividing it by ‘population’ we get ‘crimes ratio R’ and we can calculate the distance from the target.
In the Public Finance box, exactly as for the other functionings, the level of security public expenditures is calculated as a response to the distance between target value and real one. We only consider the percentage of public expenditure that is invested in high education (around 5‰ of the total, excluding the expenditure in police forces, crime control, repression and so on) and this percentage is multiplied for the institutional coefficients that measure the efficiency of formal and informal institutions. This money is used to increase the number of students attending high school and university (in the base scenario, in 2050 educational programmes financed by public security budget should involve around 420000 students).
But also the public expenditure in labour policies (see Employment Box) could have a positive feedback on security, increasing the number of employed people. At the same time, a bad situation on the labour market generates an increase in property crimes ratio. Those interconnections are a point of strength of the MiSS Model.