http://dx.doi.org/10.4236/msce.2015.35011
Influence of Silicate Structure on the Low
Temperature Synthesis of Belite Cement
from Different Siliceous Raw Materials
Ma Tantawy
Chemistry Department, Faculty of Science, Minia University, Minia, Egypt Email: [email protected]
Received 15 April 2015; accepted 23 May 2015; published 27 May 2015
Copyright © 2015 by author and Scientific Research Publishing Inc.
This work is licensed under the Creative Commons Attribution International License (CC BY). http://creativecommons.org/licenses/by/4.0/
Abstract
This paper studies the low temperature synthesis of β-C2Sfrom mixture of lime, BaCl2 and sili-ceous raw material (white sand, metakaolin and dealuminated kaolin) with the ratio (Ca + Ba)/Si = 2. The Mixtures were hydrothermally treated in stainless steel capsule at 180˚C for 5 hours and calcined at 750˚C for 3 hours. Raw materials, hydrothermally treated and calcined mixtures were analyzed by FTIR, XRD, TGA/DTA and SEM techniques. The reactivity siliceous raw materials to-wards lime under hydrothermal treatment increase in the following order: sand, metakaolin, dea- luminated kaolin. Because sand composes of quartz crystals, metakaolin composes of amorphous metakaolin structure while dealuminated kaolin composes from enriched amorphous silicate. Calcium aluminate and aluminosilicate hydrate were observed in case of metakaolin which con-tains appreciable amount of Al2O3. Dicalcium silicate crystallizes into β-C2S in the temperature range 590˚C - 760˚C. Finally, β-C2S transforms to α’-C2S in the temperature range 790˚C - 860˚C. There is no sign for the formation of γ-C2S. This proves that Ba2+ ions stabilized β-C2S and retards its transformation to γ-C2S because Ba2+ ions replace some of calcium atoms in the structure of
β-C2S.
Keywords
White Sand, Metakaolin, Dealumiated Kaolin, Hydrothermal Treatment, Calcination
1. Introduction
Dicalcium silicate (belite, C2S) is the major components of Portland cement as same as tricalcium silicate (alite,
much slower than alite. Whatever, belite shows about the same physical and mechanical properties as alite after complete hydration [1].The synthesis of low-energy reactive belite cement is one of the most important chal-lenges. Production of Portland cement consumes much of the fossil fuels (coke, petroleum and natural gas) [2] [3], releasing about 5% of the total CO2 emission [2] [4] and the whole process needs high temperature for
pro-duction (i.e. about 1450˚C). Recently, β-C2S was prepared from different siliceous raw materials such as silica
fume, white sand, rice husk ash, silica, amorphous silica, oil well drilling mud and hydraulic dam sludge under various hydrothermal conditions with lime in presence in stabilizer such as BaCl2 or B2O3 followed by
calcina-tion of the product at 650˚C - 1000˚C [5]-[9]. The hydrothermal method used by previous researchers for syn-thesizing belite cement was modified to optimize the synthesis parameters [10] [11]. The hydrothermal treat-ment temperature was reduced to 100˚C and atmospheric pressure was used in presence of alkaline 0.6 M KOH solution using mixture of aluminosilicate waste. The aim of this work is to investigate the influence of silicate structure on the preparation of belite cement from different siliceous raw materials hydrothermally treated with lime and calcined at low temperatures.
2. Materials and Experimental Techniques
Lime was produced by calcination of limestone powder (purity > 99%) in an electrical muffle furnace at 950˚C for 3 hours. Lime was cooled to room temperature in desiccator, milled and stored in tightly closed plastic bag to avoid carbonation. White sand, metakaolin and dealuminated kaolin were used for preparation of belite. White sand and dealuminated kaolin were provided from Royal cement company, Minia Egypt and Egyptian Shaba company respectively. Metakaolin was prepared from high grade kaolin by calcination in muffle furnace at 750˚C for 3 hours. Distilled water and analytical grade barium chloride (BaCl2∙2H2O) were used without further
purification. Mixtures of lime, BaCl2 with white sand, metakaolin or dealuminated [(Ca + Ba)/Si = 2] and
dis-tilled water (water/solid ratio of 5/1 by weight) placed in stainless steel capsule keeping the occupied volume equals 0.67 of total volume capacity. The capsule was tightly closed, shacked vigorously and hydrothermally treated at 180˚C for 5 hours in electric oven. The capsule was removed from oven and cooled to room tempera-ture. The hydrothermally treated product was filtered, washed with distilled water, dried in an electric oven and calcined in an electric muffle furnace at 750˚C for 3 hours. The calcined product was cooled to room tempera-ture in desiccator, milled and stored in tightly closed plastic bags. Mixtempera-tures of lime/BaCl2/white sand, lime/
BaCl2/metakaolin and lime/BaCl2/dealuminated kaolin were symbolized S, M and D respectively. X-ray
diffrac-tion (XRD) analysis were carried out by Philips x-ray diffractometer PW 1370, Co. with Ni filtered CuKα radia-tion (1.5406 Å). The Fourier transform infrared FTIR analysis was measured by spectrometer Perkin Elmer FTIR System Spectrum X in the range 400 - 4000 cm−1 with spectral resolution of 1 cm−1. Scanning electron microscopy SEM was investigated by Jeol-Dsm 5400 LG apparatus. The thermogravimetric TGA and differen-tial thermogravimetric analyses DTG were carried out with the aid of Shimadzu Corporation thermo analyzer with DTG-60H detector with 10˚C/min heating rate from room temperature up to 1000˚C, under nitrogen at-mosphere at 40 ml/min flow rate, the hold time at the appropriate temperature is zero.
3. Results and Discussion
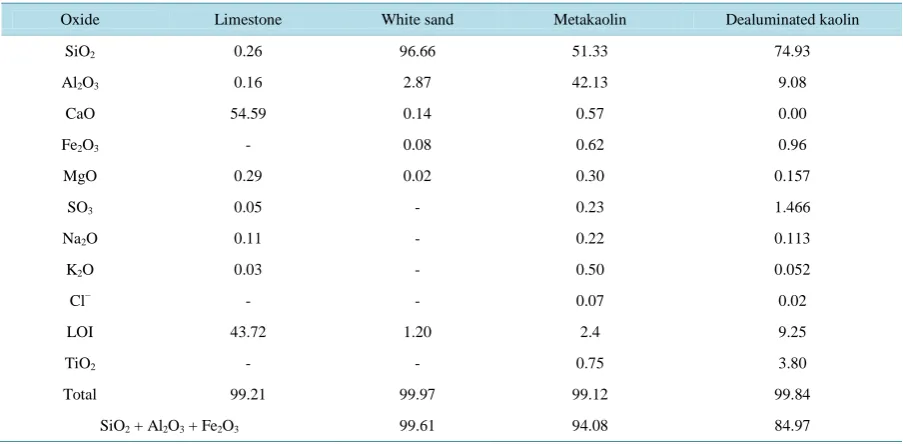
Table 1 illustrates the chemical composition of limestone, sand, metakaolin, and dealuminated kaolin
deter-mined by XRF. The chemical composition results illustrate that; limestone composes of CaCO3, white sand
composes of SiO2 while metakaolin was prepared from high grade kaolin. Dealuminated kaolin has higher (SiO2
+ Al2O3 + Fe2O3) content compared to metakaolin and sand.
Figure 1 illustrates the XRD patterns of lime, sand, metakaolin and dealuminated kaolin. Lime composes of
calcium oxide (CaO) in addition to small amount of portlandite (Ca(OH)2) that arises as a result of partial
hydra-tion of lime. White sand composes of quartz (SiO2) in addition to small amount of kaolinite (Al2O3.2SiO2.2H2O).
The halo in the range 15 - 35 2θ, indicated that metakaolin has amorphous structure except that it contains resi-dues of quartz. Dealuminated kaolin has amorphous structure except that it contains resiresi-dues of quartz, kaolinite and wollastonite (CaO.SiO2). It is evident that studied siliceous materials have not only different content of SiO2
and chemical composition but also different phase composition and crystallinity of SiO2.
Figure 2 illustrates the FTIR spectra of lime, white sand, metakaolin and dealuminated kaolin. In case of lime
(Figure 2a), the absorption band at 3640 cm−1 is due to OH-associated with portlandite (hydrated lime). The
K K
Q Q
Q Q Q Q Q Q
P L P
L
L
K K
Q W
Q (a)
[image:3.595.208.434.80.239.2](b) (c) (d)
Figure 1. XRD patterns of (a) metakaolin, (b) dealuminated kaolin, (c) lime
and (d) white sand (K kaolinite, L lime, P portlandite, Q quartz, W wollas-
tonite).
(b) (c)
(a) (d)
cm−1
Figure 2. FTIR spectra of (a) lime, (b) white sand, (c) metakaolin and (d)
[image:3.595.212.418.281.451.2]dealuminated kaolin.
Table 1. The chemical composition of limestone, white sand, metakaolin, and dealuminated kaolin determined by XRF.
Oxide Limestone White sand Metakaolin Dealuminated kaolin
SiO2 0.26 96.66 51.33 74.93
Al2O3 0.16 2.87 42.13 9.08
CaO 54.59 0.14 0.57 0.00
Fe2O3 - 0.08 0.62 0.96
MgO 0.29 0.02 0.30 0.157
SO3 0.05 - 0.23 1.466
Na2O 0.11 - 0.22 0.113
K2O 0.03 - 0.50 0.052
Cl− - - 0.07 0.02
LOI 43.72 1.20 2.4 9.25
TiO2 - - 0.75 3.80
Total 99.21 99.97 99.12 99.84
[image:3.595.86.538.500.722.2]lime [12] [13]. The absorption band at 452 cm is due to Ca-O stretching vibration [14]. In case of white sand,
(Figure 2b), the absorption bands at 1084, 795 and 464 cm−1 are corresponding to Si-O-Si asymmetric
stret-ching vibration, Si-O-Si symmetric stretstret-ching vibration and O-Si-O bending vibration respectively [15]-[17]. In case of metakaolin (Figure 2c), the band at 1632 and 3444 cm−1 corresponds to bending vibrations of free water molecules adsorbed to amorphous metakaolin surface. The broad band at 807 cm−1 corresponds to Si-O-Al vi-brations and is characteristic of the degree of disorder in metakaolin structure [16] [17]. In case of dealuminated kaolin (Figure 2d), the bands at 3694 and 3620 cm−1 corresponds to stretching vibrations of hydroxyl groups which are sitting at the edges of the residual kaolin platelets as well as internal hydroxyl groups. The band at 917 cm−1 corresponds to the Al-O-H bending vibrations (hydroxyl groups sitting on the alumina faces). The band at 693 cm−1 correspond to Si-O-Si symmetric stretching vibration [17]. The band at 542 cm−1 correspond to Al4+-O-Si vibrations, where Al4+ is in octahedral coordination [16].
Figure 3 illustrates the FTIR spectra of S, M and D mixtures hydrothermally treated at 180˚C for 5 hours.
There is a significant change in the shape, position or intensity of the absorption bands at 1084, 795 and 464 cm−1 which are corresponding to Si-O-Si asymmetric stretching, Si-O-Si symmetric stretching and O-Si-O bending vibration respectively. The absorption band at 1084 cm−1 was shifted to lower wavenumber value at 1029 cm−1 whereas the intensity of absorption bands at 794 and 464 cm−1 were significantly reduced. The ab-sorption band at 3449 cm−1 corresponds to vibration of combined water. Silica reacts with lime under hydro-thermal conditions and forms dicalcium silicate hydrate. Accordingly, the degree of polymerization of silicate structure is lowered. Absorption bands at 3640, 452, 875 and 1441 cm−1 indicate the presence of unreacted lime,
i.e. the hydrothermal treatment of the lime/silica mixture (Ca/Si = 2/1) at 180˚C for 5 hours does not drive the reaction to completion. The absorption band at 3640 cm−1 that corresponds to vibration of OH− groups asso-ciated with portlandite was significantly lowered in case of D mixture. This proves that dealuminated kaolin reacts with higher amount of lime compared to white sand and metakaolin because dealuminated kaolin enriched with amorphous silicate as confirmed by XRD results (Figure 1b).
Figure 4 illustrates the XRD patterns of S, M and D mixtures hydrothermally treated at 180˚C for 5 hours.
The intensity of residual quartz SiO2 and portlandite Ca(OH)2 in hydrothermally treated mixtures decreases in
[image:4.595.207.421.545.695.2]the following descending order; sand ˃ metakaolin ˃ dealuminated kaolin. This indicates that the reactivity of silica rich material towards lime increases in the following ascending order; sand ˂ metakaolin ˂ dealuminated kaolin. Because sand composes of quartz crystals, metakaolin composes of amorphous metakaolin structure while dealuminated kaolin composes from enriched amorphous silicate. At the same time, S mixture show no sign for the existence of dicalcium silicate hydrate due to its amorphous nature. In contrast, M and D mixtures contain crystalline dicalcium silicate hydrate with lower degree of ordering due to its high content.
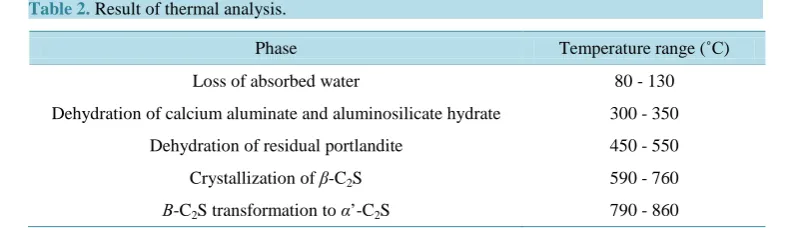
Figure 5 illustrates TGA/DTA thermograms of S, M and D mixtures hydrothermally treated at 180˚C for 5
hours. Result of thermal analysis was illustrated in Table 2. TGA/DTA thermograms illustrated the in situ se-quence of thermal reactions and phase transformations that occur when hydrothermally treated mixtures were calcined up to 900˚C. Absorbed water was lost in the temperature range 80˚C - 130˚C [18]. Calcium aluminate and aluminosilicate hydrate dehydrates in the temperature range 300˚C - 350˚C [19]. Calcium aluminate and
Figure 3. FTIR spectra of (a) S, (b) M and (c) D mixtures hydrothermally
treated at 180˚C for 5 hours. 400
800 1200 1600 2000 2400 2800 3200 3600 4000
Wav enumber, cm-1
Re
la
tiv
e
Tr
an
smi
tta
nc
e,
%
(b) (c)
(a)
Figure 4. XRD patterns of (a) S, (b) M and (c) D mixtures hydrothermally treated at 180˚C for 5 hours (K kaolinite, P portlandite, Q quartz, W wollastonite, D dicalcium silicate hydrate).
Figure 5. TGA and DTA thermograms of (a) S, (b) M and (c) D mixtures
hydrothermally treated at 180˚C for 5 hours.
10 20 30 40 50 60
2θ Re la tiv e In te ns ity , % (b) (c) (a) P Q P P P P Q Q
Q Q P
P P P P P P P P P P P D D
D D D D
D D D W K 80 85 90 95 100
0 100 200 300 400 500 600 700 800 900
Temperature, C
TG A, % -20 -15 -10 -5 0 5 10 DT A, Uv 78 82 86 90 94 98
0 100 200 300 400 500 600 700 800 900
Temperature, C
TG A, % -8 -6 -4 -2 0 2 4 D TA, u V TGA DTA (a) (b) Temperature, C (c) 78 82 86 90 94 98
0 100 200 300 400 500 600 700 800 900
Temperature, C
[image:5.595.219.406.87.240.2] [image:5.595.178.451.286.697.2]Table 2. Result of thermal analysis.
Phase Temperature range (˚C)
Loss of absorbed water 80 - 130
Dehydration of calcium aluminate and aluminosilicate hydrate 300 - 350
Dehydration of residual portlandite 450 - 550
Crystallization of β-C2S 590 - 760
Β-C2S transformation to α’-C2S 790 - 860
aluminosilicate hydrate only was observed in case of M mixture because metakaolin contains high amount of Al2O3 (42.13%) in contrast to white sand and dealuminated kaolin as illustrated by XRF analysis. Residual
por-tlandite Ca(OH)2 dehydrates in the temperature range 450˚C - 550˚C [20] [21]. Dicalcium silicate crystallizes
into β-C2S in the temperature range 590˚C - 760˚C. Finally, β-C2S transforms to α’-C2S in the temperature range
790˚C - 860˚C. The relative amount of residual portlandite in hydrothermally treated mixtures which detected from the weight loss in the temperature range 450˚C - 550˚C is in the following descending order; sand ˃ meta-kaolin ˃ dealuminated meta-kaolin. This indicates that the reactivity of silica rich material towards lime increases in the same order as confirmed by FTIR and XRD results.
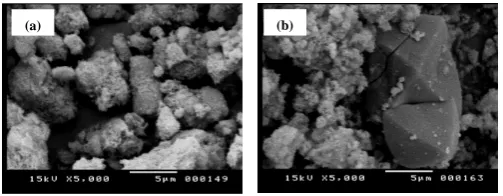
Figure 6 illustrates the SEM micrographs of S, M and D mixtures hydrothermally treated at 180˚C for 5 hours.
Hydrothermally treated mixtures have different morphologies. S and M mixtures have small cube-like grains whereas D mixture enriched with large grains with rough surfaces. This observation agrees with the following predicted descending order of reactivity; dealuminated kaolin ˃ metakaolin ˃ white sand.
Figure 7 illustrates the FTIR spectra of S, M and D mixtures hydrothermally treated at 180˚C for 5 hours and
calcined at 750˚C for 3 hours. The absorption band located at 1029 cm−1 was shifted to lower wavenumber value at 955 cm−1 and the absorption bands appearing at 876 and 520 cm−1 are characteristic to β-C2S [22]. The
ab-sorption bands at 1632 and 3433 cm−1 correspond to bending H-O-H vibration and O-H group stretching vibra-tion of adsorbed free water molecules. The absorpvibra-tion bands at 3640 and 1429 cm−1 related to unreacted lime. The absorption band at 781 and 691 cm−1 related to Si-O-Si stretching vibration. Figure 8 illustrates XRD pat-terns of S, M and D mixtures hydrothermally treated at 180˚C for 5 hours and calcined at 750˚C for 3 hours.
β-C2S formed due to dehydration of dicalcium silicate hydrate. There is no sign for the formation of γ-C2S. This
proves that Ba2+ ions stabilized β-C2S and retards its transformation to γ-C2S because Ba2+ ions replace some of
calcium atoms in the structure of β-C2S [23]. Figure 9 illustrates the SEM micrographs of S and D mixtures
hy-drothermally treated at 180˚C for 5 hours and calcined at 750˚C for 3 hours. It was observed that studied sili-ceous materials produce belite cement with different microstructure and phase composition as a result of its dif-ferent SiO2, chemical composition and crystallinity of SiO2.
4. Conclusions
The main conclusions of this investigation are:
1) XRF, XRD and FTIR results of white sand, metakaolin and dealuminated kaolin prove that these siliceous materials have different proportions of SiO2 with different phase composition and crystallinity.
2) XRD, FTIR and SEM results of white sand, metakaolin and dealuminated kaolin hydrothermally treated with lime at 180˚C for 5 hours prove the formation of dicalcium silicate hydrate. Otherwise the hydrothermal treatment does not drive the reaction to completion. It is worth mentioning that dealuminated kaolin reacts with higher amount of lime compared to white sand and metakaolin and then form higher amount of dicalcium sili-cate hydrate.
3) TGA results give a picture of the thermal decomposition of white sand, metakaolin and dealuminated kao-lin hydrothermally treated with lime at 180˚C for 5 hours. TGA results prove that β-C2S crystallizes in the
tem-perature range 590˚C - 760˚C and transforms to α’-C2S in the temperature range 790˚C - 860˚C.
4) XRD, FTIR and SEM results of white sand, metakaolin and dealuminated kaolin hydrothermally treated with lime at 180˚C for 5 hours and calcined at 750˚C for 3 hours prove the formation of β-C2S. Ba2+ ions
stabi-lized β-C2S and retarded its transformation to γ-C2S.
Figure 6. SEM micrographs of (a) S, (b) M and (c) D mixtures hydrothermally treated at 180˚C for 5 hours.
(b) (c)
(a)
[image:7.595.207.416.215.396.2]cm−1
Figure 7. FTIR spectra of (a) S, (b) M and (c) D mixtures hydrothermally treated at 180˚C for 5 hours and
calcined at 750˚C for 3 hours.
Figure 8. XRD patterns of (a) S, (b) M and (c) D mixtures hydrothermally treated at 180˚C for 5 hours and
calcined at 750˚C for 3 hours (P: portlandite, Q: quartz, β: belite, L: lime).
drothermal treatment. Dealuminated kaolin is more reactive compared to sand and metakaolin because of its amorphous silicate structure.
6) Based on current results, new studies in the future must be conducted to clarify the parameters which affect
(b) (c)
(a)
10 20 30 40 50 60
2θ
Re
la
ti
v
e
I
n
te
n
si
ty
,
%
(b) (c)
(a)
P P
P P
P
Q β P
P P
P P
P Q
Q
β
P P
P L
β
β
β
P L
[image:7.595.203.424.433.648.2](b) (a)
Figure 9. SEM micrographs of (a) S and (b) D mixtures hydrot-
hermally treated at 180˚C for 5 hours and calcined at 750˚C for 3 hours.
the reactivity of siliceous raw materials under hydrothermal treatment with lime in order to prepare low temper-ature belite cement.
References
[1] Young, J.F. and Mindess, S. (1981) Concrete. Prentice-Hall, New Jersey.
[2] European Commission (2010) Reference Document on Best Available Techniques in Cement, Lime and Magnesium Oxide Manufacturing Industries. ftp://ftp.jrc.es/pub/eippcb/doc/clm_bref_0510.pdf.
[3] Johansen, V. and Kouznetsova, T.V. (1992) Clinker Formation and New Processes. 9th Int cong chem cem, 49.
[4] Van Oss, H. and Padovani, A.C. (2003) Cement Manufacture and the Environment, Part II: Environmental Challenges and Opportunities. Journal of Industrial Ecology, 7, 93. http://dx.doi.org/10.1162/108819803766729212
[5] Tantawy, M.A., Shatat, M.R., El-Roudi, A.M., Taher, M.A. and Abd-El-Hamed, M. (2012) Low Temperature Synthe-sis of Belite Cement Based on Silica Fume and Lime. International Scholarly Research Notices, 2014, Article ID: 873215.
[6] Tantawy, M.A. (2014) Low Temperature Synthesis of Belite Cement from White Sand and Lime. Int J Eng Res Tech, 3, 1351.
[7] Singh, N.B. (2006) Hydrothermal Synthesis of β-Dicalcium Silicate (β-Ca2SiO4). Progress in Crystal Growth and
Characterization of Materials, 52, 77-83. http://dx.doi.org/10.1016/j.pcrysgrow.2006.03.011
[8] Georgescu, M., Tipan, J., Badanoiu, A., Crisan, D. and Dragan, I. (2000) Highly Reactive Dicalcium Silicate Synthe-sised by Hydrothermal Processing. Cement and Concrete Composites, 22, 315.
http://dx.doi.org/10.1016/S0958-9465(00)00017-2
[9] Rodrigues, F.A. and Monteiro, P.J.M. (1999) Hydrothermal Synthesis of Cements from Rice Hull Ash. Journal of Ma-terials Science Letters, 18, 1551. http://dx.doi.org/10.1023/A:1006639711393
[10] Kacimi, L., Cyr, M. and Clastres, P. (2010) Synthesis of α’L-C2S Cement from Fly-Ash Using the Hydrothermal
Me-thod at Low Temperature and Atmospheric Pressure. Journal of Hazardous Materials, 181, 593.
http://dx.doi.org/10.1016/j.jhazmat.2010.05.054
[11] Mazouzi, W., Kacimi, L., Cyr, M. and Clastres, P. (2014) Properties of Low Temperature Belite Cements Made from Aluminosilicate Wastes by Hydrothermal Method. Cement and Concrete Composites, 53, 170-177.
http://dx.doi.org/10.1016/j.cemconcomp.2014.07.001
[12] Shen, Y.H., Li, C.H., Zhu, X.M., Xie, A.J., Qiu, L.G. and Zhu, J.M. (2007) Study on the Preparation and Formation Mechanism of Barium Sulphate Nanoparticles Modified by Different Organic Acids. Journal of Chemical Sciences,
119, 319-324. http://dx.doi.org/10.1007/s12039-007-0043-3
[13] Gupta, A., Singh, P. and Shivakumara, C. (2010) Synthesis of BaSO4 Nanoparticles by Precipitation Method Using So-
dium Hexametaphosphate as a Stabilizer. Solid State Communications, 150, 386-388.
http://dx.doi.org/10.1016/j.ssc.2009.11.039
[14] Rodrigues, F.A. (1999) Synthesis of Cements from Rice Hull. Symposia Papers Presented before the Division of Envi-ronmental Chemistry, American Chemical Society, New Orleans, Vol. 39, 30-31.
[15] Baltakys, K., Jauberthie, R., Siauciunas, R. and Kaminskas, R. (2007) Influence of Modification of SiO2 on the
Forma-tion of Calcium Silicate Hydrate. J Mater Sci Pol, 25, 663.
[image:8.595.187.439.84.182.2][17] Galan, E., Aparicio, P., Miras, A., Michailidis, K. and Tsirambides, A. (1996) Technical Properties of Compounded Kaolin Sample from Griva (Macedonia, Greece). Applied Clay Science, 10, 477-490.
http://dx.doi.org/10.1016/0169-1317(95)00041-0
[18] Garbev, K. (2004) Structure, Properties and Quantitative Rietveld Analysis of Calcium Silicate Hydrates (C-S-H Phas-es) Crystallised under Hydrothermal Conditions, Ph.D. Thesis, Institut fur Technische Chemie von der Fakultat fur Chemie und Geowissenschaften der Ruprecht-Karls-Universitat Hiedelberg, Germany.
[19] Taylor, H.F.W. (1998) Cement Chemistry. 2th Edition, Thomas Telford Publication, London.
[20] Lea, F.M. (1998) The Chemistry of Cement and Concrete. In: Hewlett, P.C., Ed., 4th Edition, Edward Arnold, London.
[21] Heikal, M., El-Didamony, H. and Morsy, M.S. (2000) Limestone-Filled Pozzolanic Cement. Cement and Concrete Re- search, 30, 1827-1834. http://dx.doi.org/10.1016/S0008-8846(00)00402-6
[22] Fernandez, L., Alonso, C., Hidalgo, A. and Andrade, C. (2005) The Role of Magnesium during the Hydration of C3S and C-S-H Formation. Scanning Electron Microscopy and Mid-Infrared Studies. Advances in Cement Research, 17, 9- 21. http://dx.doi.org/10.1680/adcr.2005.17.1.9
[23] Chan, C.J., Kriven, W.M. and Francis Young, J. (1992) Physical Stabilization of the β-γ Transformation in Dicalcium Silicate. Journal of the American Ceramic Society, 75, 1621-1627.