Pattern Recognition of Process Mean Shift using
Combined ANN Recognizer
Olatunde A. Adeoti
Department of Mathematics and Statistics Bowen University, Iwo
Osun state, Nigeria
Rotimi F. Afolabi
Department of Mathematics and Statistics Bowen University, Iwo
Osun state, Nigeria
ABSTRACT
Artificial Neural Network (ANN) based model has been proposed for diagnosis of process mean shift. These are mainly generalized-based where only a single classifier was applied in the diagnosis of abnormal pattern. In this paper, we analyze the performance of a combined recognizer consisting of small-sized artificial neural networks on varying number of nodes in the hidden layer trained with Levenberg Marquardt and Quasi-Newton Algorithm. The results of our study illustrate the effectiveness of the combined recognizer and showed that combined recognizer performed better when number of hidden nodes is small, say, less than 15 in terms of recognition accuracies and mean square error as compared to the single recognizer.
.
Key words: : Bivariate Statistical Process Control; Combined ANN Recognizer; Pattern Recognition; Recognition Accuracy; Mean Square Error
1.
INTRODUCTION
In many quality control environments, the process seldom involves several quality characteristics which are usually correlated and require an appropriate technique to monitor these characteristics. The use of multiple univariate control charts would be ineffective for controlling the process as it ignores the correlation between the variables and thus required the use of multivariate statistical methods. Several multivariate control charts have been developed to monitor and control multivariate process. These include the multivariate Shewhart chart based on the Hotelling’s T2 statistic [8], MEWMA charts [10, 19], MCUSUM charts [4, 7and 22] and Minimax control charts [20].
Monitoring and detecting mean shifts of multivariate process, though, can be achieved using multivariate control charts, the complexity of the control charts and the cross-correlation among variables make it difficult for analysis of out-of-control signal as they always have difficulties in determining which variable or set of variables is (are) responsible for the signal when the process is out of control.
Different approaches have been developed by many researchers towards the detection and identification of abnormal process patterns. [1] proposed the univariate control chart with Bonferroni limits. [15] developed a method based on discriminant analysis to identify the out-of-control variables. He divided the complete set of variables into two
subsets to determine which of the subsets is responsible for the out-of-control signal, but discriminating and knowing the subset suspected to be directly related to the cause of out-of-control is subjective and depends on the practitioner. [13, 14] proposed the decomposition of T2 statistic and showed that the interpretation of a signal from a T2 statistic is greatly aided if the corresponding value is partitioned into independent parts. [5] used the multivariate control chart to detect the aberrant variables. The main idea of this method is the use of the univariate t ranking procedure and it is based on p unconditional T2 terms. [9] used the T2 control chart and principal components to detect the multivariate process by reducing the dimensionality of the process variables. But the identification of out-of-control variable with this method demands further knowledge of the process itself as the principal components do not always lead themselves to physical interpretation. [12] proposed a new method based on principal component analysis. These approaches to identify the abnormal patterns have several drawbacks as some of them are not easily interpretable in many cases and some contain extensive computation and sensitive to the number of variables.
Advances in computing technology have motivated many researchers to explore the use of artificial intelligence tools in statistical process control. One of such artificial intelligence tool is the Artificial Neural Network (ANN). Artificial Neural Network consists of a set of computational units called cells, neurons or nodes and a set of weighted, directed connections between these units. It is an adaptive, most often nonlinear system that learns to perform a function from data and has the ability to learn, recall and generalize knowledge. It is regarded as an important and emerging technique in pattern recognition of process patterns. [16] applied ANN recognizer for fault diagnosis of multivariate statistical process control where T2 charts and ANN model was utilized for monitoring process mean shift and identifying the variable(s) that is responsible for the mean shifts.
the combined recognizer towards pattern recognition is encouraged.
In this paper, we analyze the performance of a combined recognizer consisting of small-sized artificial neural networks on varying number of nodes in the hidden layer trained with Levenberg- Marquardt and Quasi-Newton Algorithm. The number of nodes was chosen empirically between 10 and 20 since there is no exact rule for chosen the number of nodes.
The paper is organized as follows: Section 2 presents the combined ANN recognition scheme. Section 3 describes the patterns and method of dataset generation. Section 4 to section 5 discusses combined ANN design, training, validation and testing. Section 6 is the results of study and discussions. Section 7 gives the conclusion
2.
COMBINED ANN RECOGNITION
SCHEME
A conceptual diagram of intended pattern recognition scheme is shown in figure 1 which consists of two phases. In Phase I, the multivariate statistical process control chart, precisely the Hotelling’s T2
statistic was utilized to perform process monitoring i.e. to detect an out-of-control signal. When the chart gives an out-of-control signal, the combined neural network was applied for performance diagnosis of the ANN recognizer in phase II. Raw data-based are employed in the ANN pattern recognition
3.
MODELLING OF BIVARIATE
PROCESS PATTERNS
Bivariate process is the simplest case of multivariate statistical process control where only two process variables are
monitored dependently. In a statistically in-control state, samples for both process variables are i.i.d with mean zero and standard deviation one. However, as employed in this
work, let and
represent data streams for
process variable 1 and variable 2 based on observation window of 450 samples (150 for each pattern) generated from the process patterns. Three bivariate process upward mean shifts with a moderate positive correlation are investigated. These are (1, 0) - shift in first variable while second variable remain stable; (0, 1) – First variable remain stable while second variable shifted and (1, 1) - shift in first and second variable.
3.1
Data Generator
The type of dataset available for training, validation and testing of ANN in the detection and identification of process patterns has a strong influence on the performance of the
available, there is need for the generation of process data through simulation. The common approach adopted by previous researchers to generate shift dataset is based on predefined model of [3, 6]. However, we simulate our dataset from bivariate normal distribution when the variables are correlated.
The simulation was implemented using MATLAB software. The in-control mean is assumed to be a zero vector. The variance-covariance matrix is assumed to be scaled so as to have unit variance for all components. We restrict our work to the shift in process mean vector only. Let
denotes the bivariate normal distribution with mean and
variance where , for all i and
for all where is the correlation value
between the two variables in each pattern. The in-control mean is assumed to be a zero vector. A moderate correlation coefficient of 0.5 is used and the mean vector is shifted from zero to 1.5
4.
DESIGN OF COMBINED ANN
RECOGNIZER
Process Monitoring (Phase I) Process Diagnosis (Phase II)
Observation
Fig 1: A conceptual diagram of MSPC-Combined ANN model
5.
ANN TRAINING, VALIDATION AND
TESTING
[image:3.595.88.474.70.207.2]MATLAB 7.10 Neural network toolbox software was used for the training of the network. The network uses an epoch number of 5000. The number of nodes in the hidden layer of ANN architecture for the training algorithms is varied between 10 and 20. The performance error goal was set at 1E-008. Maximum number of validation failure was 25. The learning rate was 0.001. The single ANN model was trained as MLP using the Levenberg-Marquardt and Quasi-Newton algorithm separately.
Table 1. Recognition Accuracy of cases in Percentages
Hidden Nodes
ANN 1
ANN 2
Combined ANN
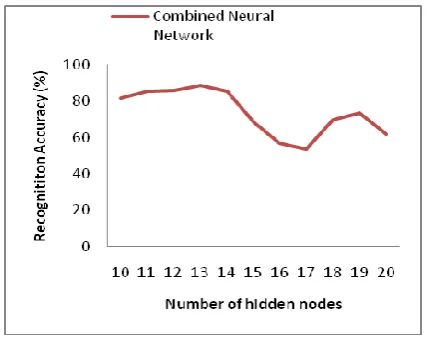
10 80.7 78.2 81.6
11 80.4 80.0 85.6
12 81.3 79.6 85.8
13 81.3 80.7 88.7
14 81.6 78.4 85.3
15 76.7 81.6 68.2
16 72.2 82.0 56.7
17 75.8 81.8 53.6
18 80.7 78.4 69.6
19 80.0 77.3 73.6
20 80.2 80.9 61.9
[image:3.595.320.534.254.425.2]The network is adjusted based on a comparison of the output and the target until the network output marches the target and the outputs were combined using the averaging method. The dataset were randomly allocated into training (80%), validation (10%) and testing (10%). Monitoring and diagnosis performance of the combined pattern recognizer is based on the recognition accuracy and mean square error of the individual and combined accuracies
[image:3.595.315.534.451.621.2]Fig. 1. Recognition Accuracy of combined ANN
Fig. 2. Recognition Accuracy of ANN trained with Levenberg-Marquardt Algorithm
MSPC process Is
out of control?
NN1
NN2
Combined
6.
RESULTS AND DISCUSSION
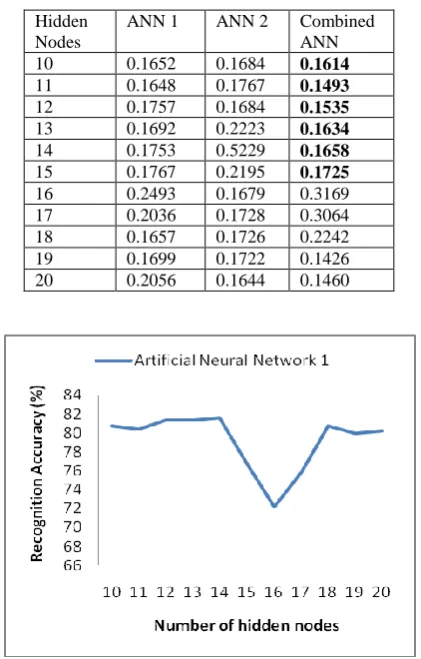
[image:4.595.64.275.331.661.2]The diagnosis performance of the combined ANN is summarized in Table 1and Table 2 using the idea of [11]. Upon examining Table 1, it was observed that recognition accuracy of ANN 1 trained with Levenberg (trainlm) is high when the number of nodes is small, however, for a moderate number of nodes the performance is low, for ANN 2 trained with scaled conjugate gradient (trainscg), the performance is almost the same for the varying number of nodes in the hidden layer. For the combined ANN, the performance is high for small hidden nodes, say less than 15. Similarly from Table 2, the combined ANN gives the least mean square error for smaller hidden nodes compared with the individual ANN model for pattern recognition. Improvement in recognition accuracy of combined ANN for hidden nodes less than or equal to 15 indicates that pattern recognition using combined ANN exhibits a better diagnosis capability to accurately identify source of process mean shift especially for smaller number of nodes in the hidden layer.
Table 2. Mean square error performance of individual and combined recognizer
Hidden Nodes
ANN 1 ANN 2 Combined ANN 10 0.1652 0.1684 0.1614
11 0.1648 0.1767 0.1493
12 0.1757 0.1684 0.1535
13 0.1692 0.2223 0.1634
14 0.1753 0.5229 0.1658
15 0.1767 0.2195 0.1725
16 0.2493 0.1679 0.3169 17 0.2036 0.1728 0.3064 18 0.1657 0.1726 0.2242 19 0.1699 0.1722 0.1426 20 0.2056 0.1644 0.1460
Fig. 3. Recognition Accuracy of ANN trained with Quasi-Newton Algorithm
number of nodes in the hidden layer and reveals that for small number of hidden nodes, the combined ANN model performed better compared to individual model when trained with the same dataset. In the future, this work can be extended to investigate the effect of different dataset allocation in percentages and sample observations on the combined ANN for pattern recognition.
8.
REFERENCES
[1] Alt, F. B. 1985 “Multivariate Quality Control,” Encyclopedia of the Statistical Science (Kotz, S., Johnson, N. L., and Read, C. R. eds.) 6, 110-122
[2] Anagun, A.S. 1998. A neural network applied to pattern Recognition in Statistical Process Contro. Computers and Industrial Engineering 35, 185-188
[3] Chen L.H and Wang T.Y 2004. Artificial Neural Networks to classify mean shifts from multivariate chart signals. Computers and Industrial Engineering 47, 195-205.
[4] Crosier R. B. 1988. Multivariate Generalizations of cumulative sum quality control schemes. Technometrics 30, 291–303.
[5] Doganaksoy N, Faltin F.W and Tucker W.T 1991, Identification of Out of Control Quality Characteristics in a Multivariate Manufacturing Environment,” Communication in Statistics-Theory and Method, 20(9), 2775-2790.
[6] Guh, R.S 2007. Online Identification and Quantification of Mean Shifts in Bivariate Process using a Neural Network-based Approach. Quality and Reliability Engineering International 23, 367-385.
[7] Healy J.D 1987 A note on multivariate CUSUM procedures Technometrics 29,409- 412
[8] Hotelling, H., 1947. Multivariate Quality Control-Illustrated by the Air Testing of Sample Bombsights,” Techniques of Statistical Analysis (Eisenhart, C., Hastay, M. W., and Wallis, W. A. eds.), McGraw Hill, New York.
[9] Jackson, J. E. 1985 Multivariate quality control. Communications in Statistics– Theory and Methods 14,
2657–2688.
[10]Lowry, C. A., Woodall, W. H., Champ, C. W. and Rigdon, S. E. 1992. A multivariate exponentially weighted moving average control chart. Technometrics 34, 46–53
[11]Maqsood, I., Khan, M.R., and Abraham, A. 2004. An ensemble of neural networks for weather forecasting. Neural Computing and Application 13, 112-122.
[15]Murphy, B. J. 1987. Selecting out of control variables with the T2 multivariate quality control procedure. The Statistician, 36: 571–583.
[16]Niaki S.T.A and Abbasi B. 2005. Fault diagnosis in multivariate control chart using artificial neural networks. Quality Reliability Engineering International 21,825–840
[17]Pham, D.T and Oztemel, E 1992. Control Chart pattern Recognition using neural networks. Journal of system Engineering. 2, 256-262
[18]Pham, D.T and Wani, M.A.1999. Feature-based control chart pattern recognition. International Journal of Production Research 35(7),1875-1890
[19]Pignatiello, J. J. Jr and Runger, G. C. 1990. Comparisons of multivariate CUSUM charts. Journal of Quality Technology, 22, 173–186
[20]Sepulveda A and Nachlas J.A. 1997. A simulation approach to multivariate control. Computers and Industrial Engineering 33,113–116
[21]Wani ,M.A and Pham, D.T.1999. Efficient control chart pattern recognition through synergestic and distributed artificial neural network. Proc. Instn Mech Engrs 213 Part B, 157-169