Single Image Super-Resolution via Non Sub-sample
Contourlet Transform based Learning and a Gabor Prior
Amisha J Shah
Assistant Professor C.K.P.C.E.T.,
Suart.
Rujul Makwana
PG student GEC, Surat.
Suryakant B.Gupta,
PhD.FCIPT
Institute for Plasma Research, Gandhinagar.
ABSTRACT
Enhancing the quality of image is a continuous process in image processing related research activities. For some applications it becomes essential to have best quality of image such as in forensic department, where in order to retrieve maximum possible information, image has to be enlarged in terms of size, with higher resolution and other features associated with it. Such obtained high quality images have also a concern in satellite imaging, medical science, High Definition Television (HDTV), etc. In this paper a novel approach of getting high resolution image from a single low resolution image is discussed. The Non Sub-sampled Contourlet Transform (NSCT) based learning is used to learn the NSCT coefficients at the finer scale of the unknown high-resolution image from a dataset of high resolution images. The cost function consisting of a data fitting term and a Gabor prior term is optimized using an Iterative Back Projection (IBP). By making use of directional decomposition property of the NSCT and the Gabor filter bank with various orientations, the proposed method is capable to reconstruct an image with less edge artifacts. The validity of the proposed approach is proven through simulation on severalimages. RMS measures, PSNR measures and illustrations show the success of the proposed method.General Term
Image processingKeywords
Super-resolution, Non Sub-Sampled Contourlet Transform, Gabor filter bank.
1.
INTRODUCTION
Super resolution is a process of achieving the best image quality through the single low-resolution (LR) image or multiple low-resolution images of the same scene. The Super resolution approach offers benefit of utilization of the existing available low resolution imaging system.
Image super resolution techniques can be mainly categorized as reconstruction based techniques and learning based techniques. In learning based approach, the relationship between an LR image and its corresponding high resolution (HR) image is examined via a pair of LR and HR patches. The training data is used to predict the higher-resolution image. The performance of learning based super-resolution depends on the quality of the HR patch (s) retrieved from thetraining data for an input LR patch. The reconstruction based SR approach estimate a high-resolution (HR) image from several low high-resolution images using a regularizing parameter calledprior.
If a prior probability distribution on the super-resolution image is available then this information may be used to “regularize”
priors offer gradient field with lower magnitude which limits the magnification factor.
In this paper, we proposed a novel approach to retrieve a high resolution image from single low resolution image. Here, in order to obtain high quality smoothness over sharp edges, the Non Sub-sampled Contourlet Transform (NSCT) based learning approach is framed together with Gabor prior. The learning approach starts from preparing the training dataset. This is done by performing three level pyramid decomposition of each image in the training set. The benefit of directionality offered by NSCT is obtained through the two level directional decomposition at each pyramid level. This training dataset is used to learn the NSCT coefficients of the unknown high resolution image. The Gabor prior is applied to the image obtained after inverse transform of the learned high resolution image and then via Iterative Back Projection, optimization is done. The proposed approach yields better results considering both smoother regions as well as texture regions.
The rest of the paper is organised as follow: Section II describes the Non Sub-Sampled Contourlet Transform (NSCT). How the NSCT coefficients at the finer scale of the unknown high resolution image are learned is discussed in section III. The Gabor prior used in the final cost function is explained in section IV. The validity of the proposed algorithm is proven in section V through simulation on variety of images.
2.
NON
SUB-SAMPLED
CONTOURLET
TRANSFORM
(NSCT)
The reconstructed HR image may not have smoothness at discontinuities, mainly at edge points in the image. Wavelet offers good smoothness at discontinuities but not along the contours present in the image. Also the Wavelet is limited to capture the information along the horizontal direction, vertical direction and the diagonal direction (the direction at an orientation of 450). Curve let overcomes this limitation but it is implemented using a rotation operation and a 2-D frequency partition based on the polar coordinates. Therefore it is simple to implement in frequency domain but difficult in discrete domain [7].The contourlet transform offers high directionality. Due to up-sampling and down-sampling, contourlet transform is shift-variant which provides better result in image denoising and texture retrieval like applications. However, image analysis applications such as edge detection, image enhancement requires a transform that is shift-invariant. Non Sub-sampled Contourlet Transform (NSCT) fulfils this requirement [8]. NSCT is implemented using non sub-sampled pyramid and non sub-sampled filter bank (NSFB). The building block of non sub-sampled pyramid is shown in the Figure1. Here H0 and H1
are analysis filters and G0 and G1 are synthesis filters.
Volume 64– No.18, February 2013
H0( )z G z0( )H z G z1( ) 1( ) 1 (1)
After decomposition of the first layer, the succeeding layers of the non sub-sampled pyramid are constructed by iterated non sub-sampled filter banks on low-pass filtered image [8].
H0(z)
H1(z)
G0(z)
G1(z)
image
Low pass image
High pass image
[image:2.595.320.542.78.181.2]image
Fig 1: Building block of two channel NSCT pyramid decomposition
The equivalent filters of l-level non sub-sampled pyramid are represented as [9]:
1
2 2 2
( ) ( ) 1 n<2
1 0 0
( )
1 ( 2 ) n=2 0 0
j
n n l
H z j H z
eq
Hn z
j
n H z l
j
(2)
Where, 2 2 2
[1 , 2 ]
j j j
z z z . This means that the corresponding
filters are up-sampled in both row and column directions with
2j [8]. A two level- two channel non sub-sampled pyramidal
decomposition is shown in Figure 2. Two dimensional frequency division is achieved by using NSFB which combines two channels quincunx sampling filters and a re-sampling operation [10]. Frequency division for three levels directional decomposition is shown in Figure 3. Here the frequency space is divided into two directions:
image
1 2 H0(z)
H1(z)
H0(z2)
[image:2.595.66.274.125.268.2]H1(z2)
Fig 2: Filter bank of two channel NSCT directional decomposition
vertical direction which considers the directions between 450 to
1350 and horizontal direction which consider the directions between -450 to 450 [9] as shown in Figure 3(b, c).
1 2 3 4
5 6 7 8
1 2 3 4 5 6 7 8
8 8
7 7
6 6
5 5
1 1
2
2 3
3 4
4
(a) (b) (c)
ɷ2 ɷ2 ɷ2
ɷ1 ɷ1
ɷ1
(π, π) (π, π) (π, π)
(-π, -π) (-π, -π)
(-π, -π)
Fig 3: (a) Frequency space partition for three level directional decomposition, (b) and (c) is HDFB and VDFB
response for three level directional decomposition
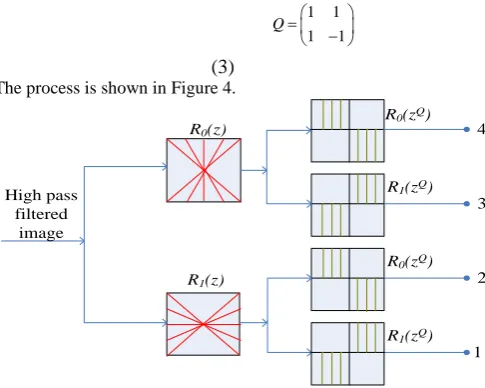
After directional decomposition of the first layer, the finer directional decomposition is obtained by up-sampling all filters using quincunx matrix Q given by [9]:
1 1 1 1
Q
(3)
The process is shown in Figure 4.
R0(z)
R1(z)
R0(zQ)
R1(zQ)
R0(zQ)
R1(zQ)
1 2 3 4
High pass filtered
image
Fig 4: Filter bank for two level direction decomposition in NSCT
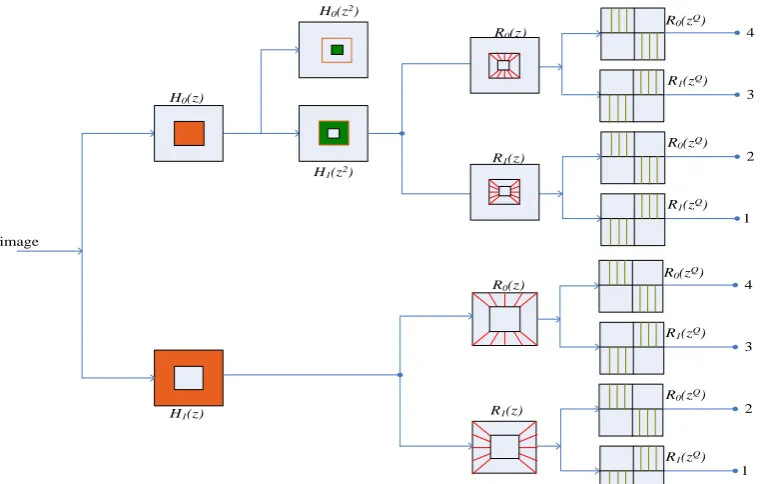
The non sub-sampled contourlet transform with two level pyramid decomposition and two level direction decomposition at each pyramid level is shown in Figure 5.
3.
LEARNING
THE
NSCT
COEFFICIENTS
Single image super-resolution via Non sub-sampled Contourlet based learning is based on the concept that, in a non sub-sample pyramid, every coefficient at the finer level can be related to the coefficient at the next coarser level for the similar orientation [11].
The learning based approach requires training data. Here the training data is constructed by considering the NSCT coefficients of all the high resolution database images, which consist of three levels non sub-sample pyramidal
[image:2.595.315.558.282.476.2] [image:2.595.67.268.491.636.2]H0(z)
H1(z)
H0(z2)
H1(z2)
R0(z)
R1(z)
R0(zQ)
R1(zQ)
R0(zQ)
R1(zQ)
1 2 3 4 R0(z)
R1(z)
R0(zQ)
R1(zQ)
R0(zQ)
R1(zQ)
1 2 3 4
[image:3.595.60.442.73.315.2]image
Fig 5: The NSCT with two level pyramid decomposition and each pyramid level is decomposed with four direction sub-bands.
image. At each pyramidal level, two levels directional decomposition is performed which results in four sub-bands. Two levels non sub-sampled contourlet transform is performed on the given low resolution test image which consist of two levels pyramidal decomposition and two levels directional decomposition at each pyramidal level. The schematic diagram of non sub-sampled contourlet transform of test image and one of the training images is shown in Figure 6.
The NSCT coefficients of the four directional sub-bands corresponding to the third pyramidal level of the test image are to be learned. The learning is done by searching the best match for the two coarser pyramidal levels of the given test image from the training database (consider the two coarser pyramidal levels of each training image) by considering minimum absolute difference criterion (MAD).From the best matching training image, copy the NSCT coefficients of finer level to the finer level of the test image [11].
I II
III IV
I II
III IV
V VI
VII VIII
V VI
VII VIII
IX X
XI VIII
To be estimated
First level with four directional
subbands Second level with
four directional subbands
Third level with four directional
subbands
a b
Fig 6: (a) two level NSCT decomposition of a test image (b) three level NSCT decomposition of one of the training image.
The learning algorithm is explained below:
i). Obtain two level NSCT decomposition with four directional sub-bands for the up-sampled test image and three level NSCT decomposition with four directional sub-bands for all the high resolution database images.
ii). Consider 4×4 blocks of NSCT coefficients in I-VIII
sub-iii). For the patches, obtained through the previous step, calculate the sum of difference between the NSCT coefficients of the test image and the NSCT coefficients of all the training images and obtain the best match as follow:
ˆ argmin[ .... ]
k d d d
I II VIII
k
(4)
Where, k=1,2,3….N training images. dl is the absolute
difference at lth sub-band calculated as
4 4
( , )
( , )
1
1
k
d
S i j
T
i j
l
i
j
l
l
(5)
Here Sl represents lth sub-band of test image and Tl k represents lth
sub-band of kth training image.
iv). From the training image offering the best match, obtain the unknown NSCT coefficients (4×4 block corresponding to the patch defined in step ii) in the sub-bands IX-XII as follow:
ˆ , ˆ
, ˆ
, ˆ
,
k
S T
IX IX
k
S T
X X
k
S T
XI XI
k
S T
XII XII
v). Repeat the steps ii-iv for every NSCT coefficients of the entire sub-band.
vi). Obtain the high resolution image by taking inverse NSCT. Finally, given a LR image, the SR image is reconstructed using the following iterative cost function:
( 1)
t
t
(
t
)
( )
( (
t
))
I
I
u I
d I
h
u G I
G d I
h
H
H
l
H
l
H
[image:3.595.95.264.539.646.2]Volume 64– No.18, February 2013
Here,
Ht
I is the SR image obtained after tth iteration. u(∙) and d(∙) is up sampling and down sampling operator respectively. h is the Gaussian filter with standard deviation equals to 0.8. G(∙) is the Gabor filter operator used to overcome the edge artifacts.
4.
GABOR
FILTER-
A
PRIOR
Gabor filter response is successfully used in many computer vision applications like texture segmentation, face detection, iris recognition etc. The Gabor filter is constructed via filter bank, consisting of filters tuned to different orientations and frequencies. The Gabor filters can also be viewed as band-pass filters whose Fourier Transform is a Gaussian shifted in frequency.
The 1-D Gabor filter was proposed by Dennis Gabor in 1946 [13]. A complex sinusoidal wave is modulated by a Gaussian function to generate a complex Gabor function as defined in equation (7).
2
(2 ( )) 1 2 2 0 ( , , , )
2
x
j f x
G x f
e
e
(7)
Where, f0 is the centre frequency and is the spread of the Gaussian function. defines the orientation of the Gabor function. The filter bandwidth is related to, where is the wavelength. The sharpness of the filter depends on the filter bandwidth. The bandwidth is narrower, the filter is sharper. Daugman [15] had extended the concepts of 1-D Gabor filter [13] to the two dimensional complex Gabor filter. The real and complex parts of the complex 2-D Gabor function are defined as [14]: 2 2 2 2 2 2 1
( , ) cos(2 2 )
2 2 2 2 2 2 2 1
( , ) sin(2 2 )
2
y x
x y
G x yr e ux vy
x y
y x
x y
G x yr e ux vy
x y (8)
Where, xxcosysin , y xsinycos
Here, ( x, y) defines spread of Gaussian and (u,v) defines the
centre frequency. The aspect ratio of the Gaussian of the Gabor is defined as x/ y . The aspect ratio specifies the support of the Gabor function. For the aspect ratio equals to one means the support is circular. defines the orientation of the Gabor functions. If the value of orientation is N then N convolutions will be computed. The orientations of the respective Gabor function are equidistantly distributed between 0 to 360 degrees in increments of 360/N, starting from the value of N.
The complex Gabor function in two dimensions can be represented as:
2 2
2 2
2 2 2 ( )
1
( , , ,
,
, )
2
x y
x y
j f ux vy
x y
x y
G x y f
e
e
[image:4.595.311.563.69.598.2]
(9) 0 20 40 60 80 0 20 40 60 80 -1 -0.5 0 0.5 1 (a) 0 20 40 60 80 0 20 40 60 80 -1 -0.5 0 0.5 1 (b) 0 20 40 60 80 0 20 40 60 80 0 0.2 0.4 0.6 0.8 1 (c)Fig 7: Gabor filter: = 20, = 0, aspect ratio=0.5 (a) real component of Gabor function (b) complex component Gabor
function (c) Gabor function
The complex Gabor filter in two dimensions is represented in Figure 7. In the proposed approach, the Gabor filter is designed with λ equals to 8. The aspect ratio is set to 0.5. σx is considered
5. RESULTS AND DISCUSSION
The state-of-the-art results are obtained through the proposed algorithm. The colour images are transformed into YCbCr colour space, and image super resolution is performed on luminance channel (Y) only as human are more sensitive to brightness information. The Cb-Cr channels are up-sampled by Bicubic interpolation.
The algorithm starts with the construction of the training database which needs to calculate the NSCT coefficients of each training image for three levels pyramid decomposition with four directional sub-bands at each level. A Gabor filter with 20 orientations is used as a prior. An iterative cost function with 12 iterations is used to achieve satisfactory results.
The proposed method is tested on different types of images like natural images (Figure 8, Figure 11(a, b), Figure 13), face images (Figure 10 (a, b), Figure 14), texture images (Figure 10(c, d), Figure 12) with different zooming factor. The proposed approach also gives satisfactory result for an image of a Satellite solar coupon exposed to a permanent sustained arc as shown in Figure 11(c, d). The results obtained by our approach are compared with Bicubic interpolation, IBP and SR via sparse representation [16] via visually as well as qualitatively.
With a glance on visual comparison, our approach shows minimum edge artefacts and ringing effect.The quantitative measurement is done using PSNR and RMS. The qualitative comparison for various images with zooming factor 2 is done in Table 1 and Table 2. With a glance on comparative table, our approach results in higher PSNR value and minimum RMS error.
Table 1. PSNR COMPARISON
Table 2. RMS COMPARISON
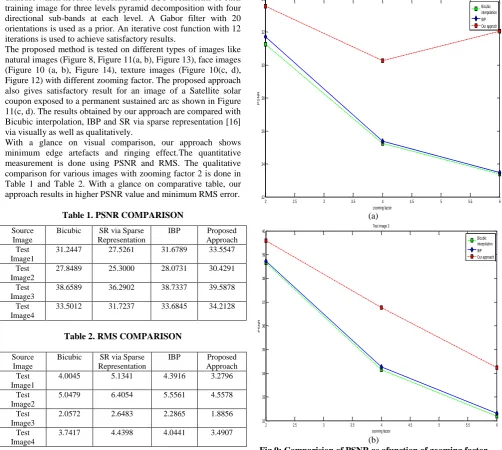
Results for x4 and x6 zooming factor are shown in Figure 10 and 11 respectively. The results of our approach are compared with Bicubic interpolation. The qualitative comparison in terms of PSNR is also displayed. The PSNR value as a function of zooming factor fortestimage 1 and test image 3 is shown in the Figure 9. This graphical comparison proves validity of the proposed approach.
2 2.5 3 3.5 4 4.5 5 5.5 6
22 24 26 28 30 32 34
zooming factor
P
S
N
R
Test image 1
Bicubic interpolation IBP Our approch
(a)
2 2.5 3 3.5 4 4.5 5 5.5 6
32 33 34 35 36 37 38 39 40
zooming factor
P
S
N
R
Test image 3
Bicubic interpolation IBP Our approach
(b)
Our method
[image:5.595.73.530.77.181.2](a) (b) (c) (d) (e)
Fig 8: SR image reconstruction (x2): (a) test image1 (b) Bicubic interpolation (c) SR via Sparse Representation [16] (d) IBP (e) proposed approach
Source Image
Bicubic SR via Sparse Representation
IBP Proposed Approach Test
Image1
31.2447 27.5261 31.6789 33.5547
Test Image2
27.8489 25.3000 28.0731 30.4291
Test Image3
38.6589 36.2902 38.7337 39.5878
Test Image4
33.5012 31.7237 33.6845 34.2128
Source Image
Bicubic SR via Sparse Representation
IBP Proposed Approach Test
Image1
4.0045 5.1341 4.3916 3.2796
Test Image2
5.0479 6.4054 5.5561 4.5578
Test Image3
2.0572 2.6483 2.2865 1.8856
Test Image4
[image:5.595.49.552.300.750.2]Volume 64– No.18, February 2013
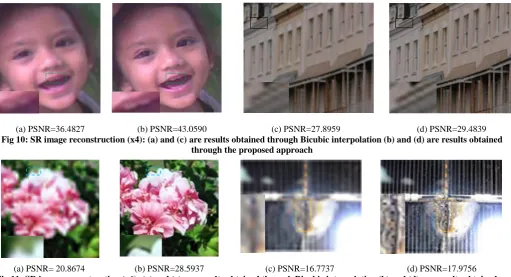
[image:6.595.64.576.46.323.2](a) PSNR=36.4827 (b) PSNR=43.0590 (c) PSNR=27.8959 (d) PSNR=29.4839
Fig 10: SR image reconstruction (x4): (a) and (c) are results obtained through Bicubic interpolation (b) and (d) are results obtained through the proposed approach
[image:6.595.47.576.365.460.2](a) PSNR= 20.8674 (b) PSNR=28.5937 (c) PSNR=16.7737 (d) PSNR=17.9756
Fig 11: SR image reconstruction (x6): (a) and (c) are results obtained through Bicubic interpolation (b) and (d) are results obtained through the proposed approach
Our method
(a) (b) (c) (d) (e)
Fig 12: SR image reconstruction (x2): (a) test image 2 (b) Bicubic interpolation (c) SR via Sparse Representation [16] (d) IBP (e)proposed approach
Our method
[image:6.595.29.571.503.569.2](a) (b) (c) (d) (e)
Fig 13: SR image reconstruction (x2): (a) test image 3 (b) Bicubic interpolation (c) SR via Sparse Representation [16] (d) IBP (e)proposed approach
Our method
[image:6.595.43.568.599.712.2](a) (b) (c) (d) (e)
Fig 14: SR image reconstruction (x2): (a)test image 4 (b) Bicubic interpolation (c) SR via Sparse Representation [16] (d) IBP (e)proposed approach
Our method
Our method
6. CONCLUSION
The proposed method is useful when one has to use single observed image to improve its resolution. The results obtained for different types of images with different magnification factors show improvements over other approaches. In the proposed method, the unknown high resolution image is learned through the Non-Subsample Contourlet Transform based learning approach. The proposed method also uses a Gabor filter family as a prior to analyze the image at different orientations. The learned image is optimized via Iterative Back Projection. The quality of the resultant image depends on the number of orientations uses in the Gabor filter family. The quality of the resultant image improves as the number of orientations increases at the cost of complexity. The resolution of the SR image also depends on the number of iterations carry out during optimization. As the number of iterations increases quality of the SR image also increases but no significant improvement is observed after few iterations. The proposed approach results in noticeable perceptual as well as quantifiable improvement within 12 iterations only.
7. REFERENCES
[1] Sina Farsiu, M. Dirk Robinson, Michael Elad, and Peyman Milanfar, 2004, “Fast and Robust Multiframe Super Resolution”, IEEE transactions on image processing, VOL. 13, NO. 10, pp 1327-1344.
[2] David Capel and Andrew Zisserman, 2000, “Super-resolution Enhancement of Text Image Sequences”, IEEE Comput. Soc, Proceedings 15th International Conference on Pattern Recognition ICPR, VOL. 1, No. 1, pp-600-605.
[3] Xueting Liu, Daojin Song, Chuandai Dong and Hongkui Li, 2008, “MAP-Based Image Super-resolution Reconstruction”, World Academy of Science, Engineering and Technology 37, pp 208-211.
[4] Shengyang Dai, Mei Han, YingWu, Yihong Gong, 2007, “bilateral back-projection for single image super resolution”, IEEE Proceedings of ICME, pp. 1039-1042.
[5] Shengyang Dai, Mei Han, Wei Xu, Ying Wu, Yihong Gong, 2007, “Soft Edge Smoothness Prior for Alpha channel super resolution”, IEEE Computer Society Conference on Computer Vision and Pattern Recognition (CVPR), pp 1-8, June.
[6] Taeg Sang Cho, Neel Joshi, C. Lawrence Zitnick, Sing Bing Kang, Richard Szeliski, William T. Freeman, 2010, “A Content-Aware Image Prior”, IEEE Computer Society Conference on Computer Vision and Pattern Recognition (CVPR), pp 169 - 176 , June.
[7] Minh N. Do, Martin Vetterli, 2005, “The Contourlet Transform: An Efficient Directional Multi resolution Image Representation”, IEEE transactions on image processing, VOL.14, NO.12, pp 2091-2106.
[8] Yue Lu and Minh N. Do, 2006, “A New Contourlet Transform With Sharp Frequency Localization”, IEEE Proceedings of International Conference on Image Processing, pp 1629-1632.
[9] Jianping Zhou, Arthur L. Cunha, and Minh N. Do, 2006, “Nonsubsampled Contourlet Transform: Construction And Application In Enhancement”, IEEE transactions on image processing, VOL. 15, NO. 10, pp 469-472, OCTOBER.
[10]Pengcheng Han, Junping Du, 2012, “Spatial Images Feature Extraction Based on Bayesian Non-local Means Filter and Improved Contourlet Transform”, Journal of Applied Mathematics, VOL. 2012, Article ID 467412, 16 pages, doi:10.1155/2012/467412.
[11]C. V. Jiji and Subhasis Chaudhuri, 2006, “Single-Frame Image Super-resolution through Contourlet Learning”, EURASIP Journal on Applied Signal Processing, VOL.2006, Article ID 73767, pp 1-11.
[12]Jianchao Yang, John Wright, Thomas Huang and Yi Ma, 2008, “Image Super-Resolution via Sparse Representation”,cvpr08.
[13]D. J. Gabor, 1946, “Theory of communication”, Journal of the Institute of Electrical, Engineers IEE, VOL. 93, NO. 26, pp 429-457.
[14]Konstantinos G. Derpanis, 2007 “Gabor filters”, York university, Version 1.3, April 23.
[15]Daugman J., 1985, “Uncertainty relation for resolution in space, spatial frequency, and orientation optimized by two-dimensional visual cortical filters”. Journal of the Optical Society of America-A, VOL.2, NO.7, pp 1160-1169.