1
Faulty Slice Distribution using Complexity Estimation for
Debugging in Parallel
Maneesha Srivastav
Jaypee Institute of Information
Technology, A-10, Sector-62
Noida, U.P. - 201 307, India
Yogesh Singh
University School of Information
Technology, Guru Gobind Singh
Indraprastha University, Kashmere
Gate, Delhi, India
Durg Singh Chauhan
Uttarakhand Technical University,
Dehradun, India
ABSTRACT
In this paper we propose a technique to distribute faulty slices among available n debuggers for simultaneous debugging. We present a three level model to distribute debugging task efficiently among debuggers by (a) estimating capacity of task to be allocated to an individual debugger (b) measuring similarity and assigning priority to each faulty slice to minimize redundancy of debugging task(c) uniformly distributing faulty slices by arranging them in task queues. For this we present an algorithm and an example to prove effectiveness and efficiency of the presented approach.
General Terms
Debugging, fault localization, optimization, software testing.
Keywords
Clustering, debugging, fault localization, optimization, software testing.
1.
INTRODUCTION
Debugging is the most expensive, time consuming and dominantly manual process for software developers. The cost related to debugging is measured mostly on two parameters: (a) manual labor and (b) time required to discover and correct bugs to produce a failure free program. The primary reason for such a high cost of debugging is manual effort required to localize and remove a fault and time consumed in producing failure free software. For an efficient debugging process developers always try to find a good trade-off between the two. Among all debugging activities, fault localization is among the most expensive [7].
When software fails it is usually due to more than one cause. At the time of failure debuggers are not aware of number of causes one failure might have. Thus, usually one-bug-at-a-time de-bugging approach is carried out in a sequential manner to locate a fault and then to fix it. In this approach debugger might utilize data from failed test cases and apply a fault localization technique where one bug is targeted at a time. After localizing and fixing fault program is retested, which might lead to another failure and cycle gets repeated till program becomes failure free. However, when there can be multiple debuggers available for debugging task then we can create more specialized test suites based on fault focusing clusters and distribute debugging task. By distributing debugging task we can save time and hence make
debugging activity less expensive. [11] have presented a new mode of debugging technique that provides a way for multiple developers to debug simultaneously a program for multiple faults by automatically producing specialized test suites for targeting individual faults. This technique has been termed as parallel debugging. Debugging in parallel reduces time required to debug multiple faults in a program. It includes distributing program into many executable faulty slices which can be debugged independently. Multiple debuggers are then allocated these individual slices for independent de-bugging.
In this research we propose a new debugging technique to distribute faulty slices among available n debuggers for simultaneous debugging. For this we present a three tier model to estimate amount of work related to a slice for efficient distribution by (a) estimating complexity of each slice (b) calculating upper limit of a task to be allocated to a debugger (c) measuring similarity and assigning priority to each faulty slice to minimize redundancy of debugging task.
2.
RELATED WORK
2 performance of Coverage Based Fault Localization (CBFL) is
better than that of delta debugging.
3.
PROPOSED
APPROACH
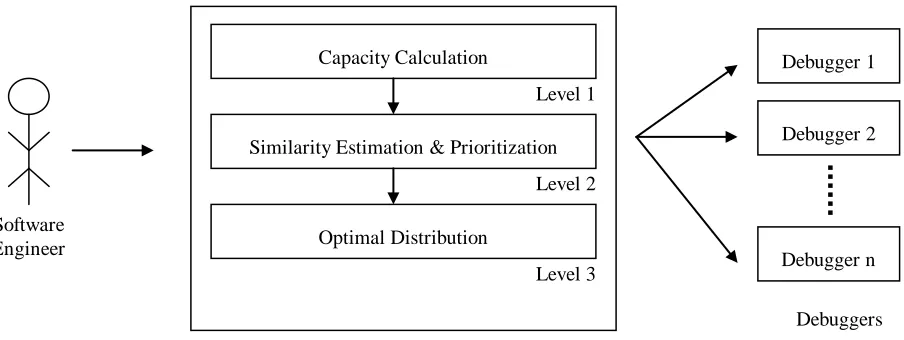
Fault localization is costly as well as time consuming. The primary reason for such a high cost of debugging is manual effort required to localize and remove a fault and time consumed in producing failure free software. We present an approach that will help in distributing task equally among available debuggers thereby minimizing cost in terms time. The whole process is divided into 3-level distribution hierarchy as shown in Fig 1.
The process starts with Capacity Calculation level. It is a complex level made up of three pre-processes. It starts with generating faulty slices using fault localization technique given in [10] and then combines these faulty slices to generate different clusters using [11]. Once the faulty slices are combined it computes complexity for each slice using our technique of complexity estimation given in [13].
Once complexity for each slice is computed it starts with calculation of capacity of task queue where a task queue is a queue which will contain faulty slices to be allocated to debuggers. The maximum number of faulty slices a queue can hold is given by following formula:
where Ci is the complexity of ith faulty slice and there are n
faulty slices in total.
The second level is a two stage process. Firstly it considers results of level 1 and arranges faulty slices in decreasing order of their complexities. This will help in efficiently selecting faulty slices for adding in a task queue. Secondly it calculates similarity between faulty slices using a two dimensional matrix (M). This is done to club similar slices to minimize redundant debugging work done by two or more debuggers. In this matrix we store similarity between two slices i and j such that:
Mi,j = the similarity between faulty slices (i, j)
In the last phase we optimally distribute faulty slices among debuggers for debugging using following rules:
Select the first faulty slices from list arranged in decreasing order of their complexities as first slice of task queue. For subsequent faulty slice we start from last element i.e. unallocated faulty slice with minimum complexity in the priority list as it minimizes number of tests which needs to be performed.
Cq
C
C
xm
i i
0
Where Fi is the complexity of ith faulty slice in the current task queue and m faulty slices have already been selected. Cx is the complexity of the current faulty slice being considered and Cq is the capacity of task queue.
If there are more than one faulty slices that fit the above criterion then one which has maximum similarity to last selected faulty slice (Fm ) is selected.
Three Level Distribution process
Capacity Calculation
Similarity Estimation & Prioritization
Optimal Distribution
Software
Engineer
Debugger 1
Debugger 2
Debugger n
Debuggers
Level 1
Level 2
Level 3
(2)
[image:2.612.83.535.78.248.2](1)
Figure 1. Three level distribution model
(3) (2)
Capacity of a task queue
(Cq)
= Maximum
complexity of a faulty slice
Σ
i=0 n
Ci
number of debuggers
3
4.
ALGORITHM
Fi is ith faulty slice
Ci is complexity of ith faulty slice
max = C1
for i from 1 to n if (Ci> max)
max = Ci
sum = 0 for i from 1 to n
sum = sum + Ci
x = sum / m if(x > max)
Cq = x else
Cq = max for i from 1 to n
addtoList(S, Fi)
SortList(Fi) // Sort the list in non-increasing order of complexity
j = 1
for i from 1 to m AND empty(S) = FALSE while (Complexity(Qi) < Cq )
if (Qi is empty)
enqueue(Qi, removeFromlist(S))
else
C = lastElementof(S) P = endof(Qi)
sim = 0
while( C != NULL)
if( (Complexity(Qi) + Complexity(C))< Cq)
if(similarity(P,C) >sim) Z = C
sim = similarity(P,C) else
break; //Break out of while loop C = Cprev
if ( Z != NULL )
removeFromList(S,Z) enqueue (Qi, Z)
else
break while(empty(S) = FALSE)
TF = RemoveFirstElement(S) min = ∞
for i from 1 to m
if(Complexity(Qi ) < Cq )
if (Complexity(Qi) + Complexity(TF)< min)
min = Complexity(Qi) + Complexity(TF)
k = i enqueue (Qk, TF)
4
if(first-65 > 8 || second - 65 > 9);
}
if(con==0) {
printf("\n BAD PAGE"); }
if(first-65 > 8 || second - 65 > 9); else if(web[first-65][second-67])
{ {
for(i=0;i<10;i++) {
if (web[first-65][i]) {
if(web[i][second-65]&&con!=1) {
{ if(con!=1) {
for(j=0;j<9;j++)
{
if((i!=j)&&(i!=first-5)&&(web[i][j]&&web[j][second- 65])&& con!=1)
{ } } } } } }
if(con==0) {
printf("\nBAD PAGE!"); }
5.
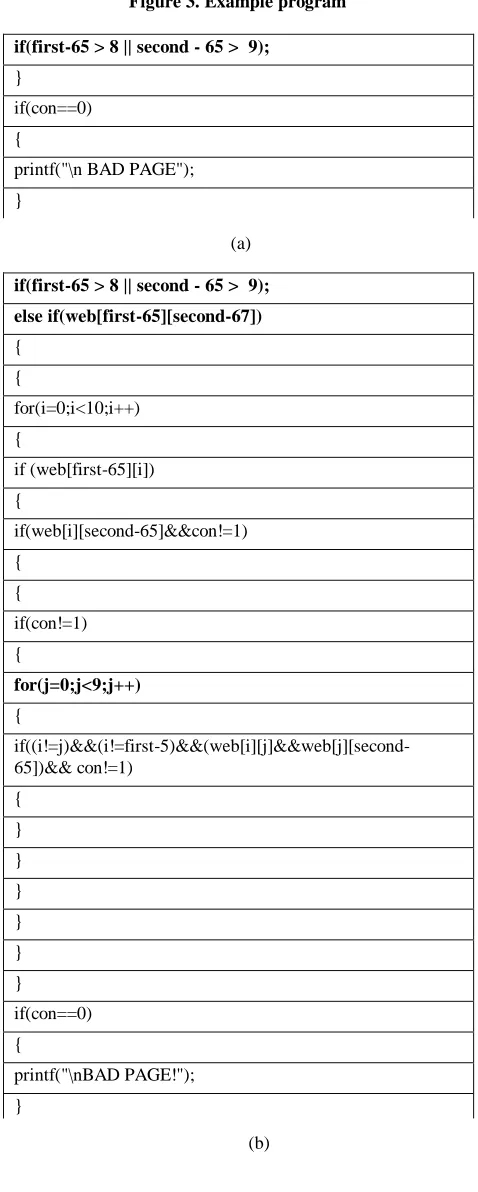
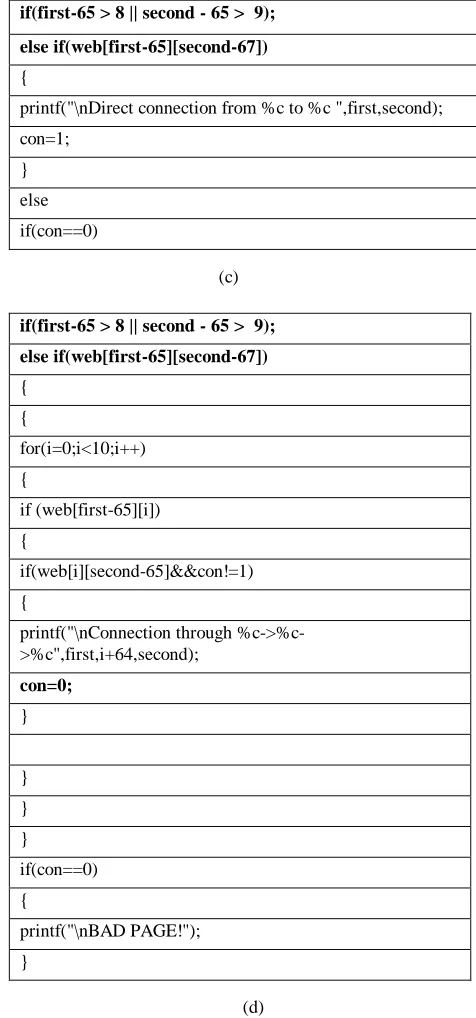
EXAMPLE
[image:4.612.319.558.94.690.2]To illustrate the process consider a program in Figure3. Figure 4(a),(b),(c),(d) show its corresponding clustered slices after applying fault localization and clustering technique of [10, 11]. Next step our algorithm computes complexity for each faulty slice using [13]. Table 1 shows the results for complexity estimation. Based on the data of Table 1 each slice is assigned a priority to it. This data is arranged in descending order of their priorities for efficient selection of faulty slices for adding in a task queue. Table 2 shows the results after assigning priority to faulty slices. Once the priority is computed a two dimensional similarity matrix is created as shown Table 3 results of which are used in calculating capacity for task queue according to the formula given in (1) and shown in Table 4. Fig 5 represents the sketch of task queue using the data of Table 4.
Figure 3. Example program
if(first-65 > 8 || second - 65 > 9); else if(web[first-65][second-67]) {
printf("\nDirect connection from %c to %c ",first,second);
con=1; } else {
for(i=0;i<10;i++) {
if (web[first-65][i]) {
if(web[i][second-65]&&con!=1) {
printf("\nConnection through %c->%c->%c",first,i+64,second);
con=0; } else { if(con!=1) {
for(j=0;j<9;j++) {
if((i!=j)&&(i!=first-65)&&(web[i][j]&&web[j][second-65])&& con!=1)
{
printf("\nConnection through %c->%c->%c->%c",first,i+65,j+65,second);
con=1; } } } } } } }
if(con==0) {
printf("\nBAD PAGE!"); }
(a)
5
if(first-65 > 8 || second - 65 > 9); else if(web[first-65][second-67])
{
printf("\nDirect connection from %c to %c ",first,second); con=1;
} else if(con==0)
if(first-65 > 8 || second - 65 > 9); else if(web[first-65][second-67])
{ {
for(i=0;i<10;i++) {
if (web[first-65][i]) {
if(web[i][second-65]&&con!=1) {
printf("\nConnection through %c->%c- >%c",first,i+64,second);
con=0;
}
} } }
if(con==0) {
printf("\nBAD PAGE!"); }
Percentage Similarity
Slice 1 Slice 2 Slice 3 Slice 4 Slice
1
100 22.222222 27.27 24
Slice 2
22.22222 2
100 12.9 54.839
Slice 3
27.27 12.9 100 16
Slice 4
24 54.839 16 100
Figure 4. (a), (b), (c), (d). Faulty Slices
[image:5.612.46.284.76.585.2]Table 1. Complexity estimation of faulty slices
[image:5.612.325.550.82.530.2]Table 2. Results of priority assignment to each faulty slice
Table 3. Similarity matrix
Table 4: Task queue
Figure 5. Sketch of task queues
In the presented example we can observe that by measuring complexity, similarity and priority of faulty slices we have successfully distributed these slices equally among debuggers. The distribution presented is also likely to give independent faulty slices to the debuggers avoiding redundancy of debugging task.
6.
CONCLUSION
In this paper we have presented an efficient approach for distributing task among debuggers. The entire process is divided into three levels. In first level our algorithm calculates capacity of a task queue by analyzing clustered faulty slices and then arranges these slices according to their priority. Once this data is
Slice Slice 2 Slice 4 Slice 3 Slice 1 Complexit
y
18.52 17.18 6.93 4.35
Priority(Pi
)
P1 P2 P3 P4
(c)
(d)
Complexity
Slice 1 4.35
Slice 2 18.516667
Slice 3 6.9333333
Slice 4 17.183333
TQ1 TQ2
Slice 2 Slice 4
Slice 1 Slice 3
Total Complexity 22.86667 24.11667
Slice 2
TQ1 Slice
2
Slice 4
6 arranged it computes the similarity matrix for clustered slices
which is a two dimensional matrix. Based on this data slices are distributed among available debuggers. This helps in reducing two important tasks of debugging namely cost and time by (a) estimating complexity for uniform distribution (b) minimizing redundancy by allocating more similar slices to one debugger using similarity matrix. Finally we presented an example to prove efficiency and effectiveness of our approach.
7.
REFERENCES
[1] A. Zeller, “Isolating Cause-Effect Chains from Computer Programs”. Proc. ACM SIGSOFT. Fast Software Encryption (FSE 02), 2002.
[2] B. Liblit, A. Aiken, A.X. Zheng, and M. I. Jordan, “Bug Isolation via Remote Program Sampling,” Proc. ACM SIGPLAN. Conference on Programming Language Design and Implementation (PLDI 03), June 2003, pp. 141-154. [3] B. Liblit, M. Naik, A. X. Zheng, A. Aiken, and M. I.
Jordan, “Scalable Statistical Bug Isolation,” Proc. ACM SIGPLAN. Programming Language Design and Implementation (PLDI 05), June 2005.
[4] C. Liu, L. Fei, X.F. Yan, J.W. Han, and S. Midkiff, “Statistical Debugging: a Hypothesis Testing-Based Approach,” IEEE Transactions on Software Engineering, vol. 32(10), pp. 1-17, 2006.
[5] H. Agrawal, J. Horgan, S., Lodon, and W. Wong, “Fault Localization using Execution Slices and Dataflow Tests,” Proc. IEEE International Symposium on Software Reliability Engineering (ISSRE 95), Oct. 1995.
[6] H. Cleve, and A. Zeller, “Locating Causes of Program Failures,” Proc. International Conference on Software Engineering (ICSE 05), IEEE Computer Society. May 2005. [7] I. Vessey, "Expertise in Debugging Computer Programs," International Journal of Man-Machine Studies: A process analysis, vol. 23(5), pp. 459-494, 1985.
[8] J. A. Jones and M. J. Harrold, “Empirical Evaluation of the Tarantula Automatic Fault-Localization Technique,” Proc. IEEE/ACM International Conference on Automated Software Engineering (ASE 05), Nov. 2005.
[9] J. A. Jones, M. J. Harrold, and J. Stasko, “Visualization of Test Information to Assist Fault Localization,” Proc. ACM International Conference on Software Engineering (ASE 02), May 2002.
[10]J.A. Jones, M.J. Harrold, and J. Stasko, “Fault Localization using Visualization of Test Information,” Proc. International Conference on Software Engineering (ICSE 04), IEEE Computer Society. May 2004.
[11]James A. Jones, James F. Bowring and M. J. Harrold, "Debugging in Parallel," Proc. ACM. International Symposium on Software Testing and Analysis (ISSTA 07), July 2007.
[12]M. Renieris, and S. Reiss, “Fault Localization with Nearest Neighbor Queries,” Proc. IEEE International Conference on Software Engineering (ASE 03), Oct. 2003.
[13]M. Srivastav, Y. Singh, C. Gupta, D.S. Chauhan, “Complexity Estimation Approach for Debugging in Parallel”, Proceedings of IEEE - 2010 Second International Conference on Computer Research and Development, Kuala Lumpur, Malaysia, May, 2010
[14]R. Abreu, P. Zoeteweij, and A. J. C. van Gemund, “On the Accuracy of Spectrum-Based Fault Localization,” Proc. Testing: Academic & Industrial Conference Practice And Research Techniques (TAIC PART-MUTATION 07), IEEE Computer Society, pp. 89-98, Sep, 2007.