An Overview of PAPR Reduction Techniques
in OFDM Systems
Md. Mahmudul Hasan
Electronics and Communication Engineering UITS, Dhaka-1212, Bangladesh
S. S. Singh,
PhD. School of Electronics Engineering KIIT University, Bhubaneswar-751024, IndiaABSTRACT
OFDM is an attractive signaling scheme for communication systems and adopted in many wireless standards. One of the challenging issues for OFDM system is its high Peak-to-Average Power Ratio (PAPR) which limits its applications in communication systems. In fact, the PAPR problem is one of the most detrimental aspects in the OFDM systems as it can cause power degradation and spectral spreading. In this paper, we review and analyze the performances of different PAPR reduction techniques in OFDM systems, based on Complementary Cumulative Distribution Function (CCDF), computational complexity, bandwidth expansion, in-band signal distortion and out-of-band radiation. Extensive computer simulations show that up to 8.4 dB reduction in PAPR can be achieved through six different techniques of PAPR reduction.
Keywords
Orthogonal Frequency Division Multiplexing (OFDM), Complementary Cumulative Distribution Function (CCDF), Peak to Average Power Ratio (PAPR), and Power Spectral Density (PSD).
1.
INTRODUCTION
Orthogonal Frequency Division Multiplexing (OFDM) is a very effective wideband transmission technique. OFDM has many well documented advantages including high data rates, high spectral efficiency, multipath delay spread tolerance, power efficiency and a very strong immunity to the frequency selective fading channels [1], [2]. It has been chosen for high data rate communications and widely deployed in many wireless communication standards such as Digital Video Broadcasting (DVB) and worldwide interoperability for microwave access (WiMAX) [3]. OFDM is a multicarrier transmission technique where a high-rate serial data is transmitted in parallel at a slower rate via multiple narrowband orthogonal subcarriers. The linear combination of the data-modulated subcarriers can have a very large amplitude fluctuations resulting in a large PAPR which is a well-known limitation of OFDM that leads to a severe nonlinear distortion in practical implementations of high power amplifier (HPA).
To overcome above mentioned serious limitation, various approaches have been proposed including clipping filtering [6,7], coding schemes [8], phase optimization, nonlinear companding transforms, Tone Reservation (TR) and Tone Injection (TI) [9,10], constellation shaping, Partial Transmission Sequence (PTS) and Selective Mapping (SLM) [11-14]. SLM and PTS can provide good performance for PAPR reduction, and this requirement usually results in a high computational complexity. Several techniques have been proposed based on low-complexity SLM techniques [13]. These reduction methods can be classified into distortion-less and distortion techniques. Distortion techniques are
considered to introduce spectral regrowth. They do not require any side information to be sent and they have low complexity compared to the distortion-less techniques. Here the simplest method is to clip the peak amplitude of the OFDM signal to some desired maximum which is an irreversible nonlinear process which surely degrades the system performance. Distortion-less technique on the other hand, do not suffer from spectral regrowth, but they do require sending side information to the receiver. Most of the methods in distortion-less category are based on the same idea of selecting the signal to be transmitted from a set of different representations with less PAPR which would degrade the performance of system.
The rest of the paper is organized as follows: A brief overview of PAPR in OFDM signals is given in section II. In section III,weanalyzesixtypicaltechniquesofPAPRreduction. The simulation results are shown in section IV. Section V concludes the article.
2.
PAPR IN OFDM SIGNALS
In this section, we review the basics of OFDM system and the definition of PAPR. OFDM signal may be generated by an N-point Inverse Fast Fourier Transform (IFFT) in the transmitter, and the Fast Fourier Transform (FFT) is employed at the receiver to restore the signal. Let us define input complex-valued data of N subcarriers as
is formed with each symbol modulating the corresponding subcarrier from a set of chosen orthogonal, discrete-time OFDM symbol can be written as
(1)
Where is the symbol carried by the sub-carrier, L is the oversampling factor. An OFDM signal consists of an “N” number of independently modulated subcarriers, which can give a very large PAPR when added up coherently. PAPR is the ratio between the maximum power and the average power of the complex signal. Generally, the PAPR for the time domain OFDM signal can be defined as
(2)
Where denotes the expectation operation. PAPR increases proportionally with the number of subcarriers. Reducing is the principle goal of PAPR reduction techniques.
This equation can be interpreted as the probability that the PAPR of a symbol block exceeds some threshold level .
3.
OVERVIEW OF PAPR REDUCTION
3.1
Clipping and filtering
The simplest and straightforward PAPR reduction scheme is clipping which limits the maximum of transmit signal to a pre-specified threshold level. Clipping of the transmit signal at transmitter is an irreversible nonlinear process at the receiver, resulting in BER performance degradation. Clipping causes in-band signal distortion and out-of-band radiation, which imposes out-of-band interference signals to adjacent channels. Out-of-band interference can be reduced by filtering but it cannot reduce in-band distortion. Discrete time domain clipped signal can be given as
(3)
Where A is the predefined clipping level, let us define the clipping ratio (CR) as the clipping level normalized by the RMS value of OFDM signal, such that .
3.2
Selective Mapping (SLM)
In SLM, the input data sequences are multiplied by each of the phase sequences to generate alternative input symbol sequences. Each of these alternative input data sequences is made the IFFT operation, and then the one with the lowest PAPR is selected for transmission [9]. Fig. 01 shows a block diagram for SLM. Here, the input data block
is multiplied with U different
phase sequences Where, and for and
which produce a modified data block
. Then, IFFT of U independent
sequences are taken to produce the sequences
among which the one with the
lowest PAPR is selected for transmission and the corresponding selected phase factors also should be transmitted to receiver as Side Information (SI). SLM technique needs IFFT operation and the number of required bits as side information is for each data block. Therefore, the ability of PAPR reduction in SLM depends on the number of phase factors and the design of the phase factors. Some extension of SLM also have been proposed to reduce the computational complexity and number of the bits for side information transmission.
3.3
Partial Transmit Sequence (PTS)
PTS is another very effective approach to reduce the PAPR, here the input data block of N symbols is partitioned into V disjoint subblock as follows
Where are the consecutive subblocks of equal size. Unlike the SLM technique, in which phase rotation is applied to all the subcarriers, here the phase of the each subblock is rotated independently. Then each partitioned subblock is multiplied by a corresponding complex phase factor ,
, subsequently taking its IFFT to yield
Where is referred to as a partial transmit sequence (PTS). The phase vector is chosen so that the PAPR can be minimized, which is shown as
Then, the corresponding time-domain signal with the lowest PAPR vector can be expressed as
In general, the selection of the phase factors is limited to a set of elements due to the search complexity.
As the set of allowed phase factors
is .So sets of phase
factors should be searched to find the optimum set of phase vectors. And the search complexity increases exponentially with the number of subblocks. The PTS technique requires U IFFT operations for each data block and bits of side information. One particular example is a suboptimal combination algorithm, which uses the binary phase factors of .
3.4
Nonlinear Companding Transforms
Nonlinear companding is one of the most attractive schemes of PAPR reduction due to its good system performance including PAPR reduction and BER, with a low implementation complexity and no bandwidth expansion. Nonlinear companding transform is a special case of clipping scheme. The difference is that clipping method deliberately clips the large signals when the amplitude is larger than the given threshold, and thus the clipped signals cannot be recovered at the receiver. However, nonlinear companding transforms compand the original OFDM signal using the strict monotone increasing function. The companding process enlarges the small signals while compressing the large signals to increase the immunity of small signals from noise, it also increases the average power and thus the PAPR according to (2). Therefore, the companded signals at the transmitter can be recovered correctly through the corresponding inversion of companding transform function at the receiver. Whereas clipping method does not have any effect on the small signals. As a result, the system performance degradation due to the clipping is not very optimistic. However, nonlinear companding transforms can operate well with good BER performance while keeping good PAPR reduction. For the discrete OFDM signal given by Equation (1). The companded signal can be given by:
(4)
Where is the average amplitude of the signal and is the companding parameter.Companding transform should satisfy the following conditions.
This transform amplifies the small signal and attenuates the period of high signal. On the receiver end, the receiver signal
must be expanded by the inverse companding transform before it FFT operation. The expanded signal at the receiver is
(5)
3.5
Discrete Cosine Transform
In this section, we briefly review the DCT. A block diagram of an OFDM system with DCT is shown in fig. 03. The idea of PAPR reduction using transformation is to reduce the autocorrelation of the input sequence before the IFFT operation is applied. A close relation between the PAPR of an OFDM signal and the aperiodic autocorrelation function (ACF) of an input signal can be found in [15]. One-dimensional DCT is given by:
(6)
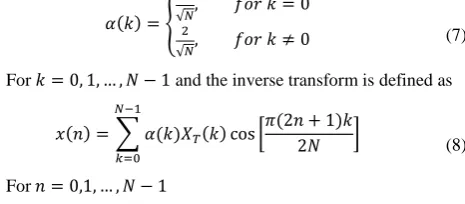
Eq. (6) can be represented in vector as , where is a DCT matrix of dimension and and x are the vector representation of and . The rows (or columns) of the DCT matrix are orthogonal matrix vector in nature, using this property it is possible to reduce the autocorrelation of the sequence and thus peak power of OFDM signals. Scaling parameter in (6) is defined as
(7)
For and the inverse transform is defined as
(8)
For
3.6
Hadamard Transform
Hadamard matrices are simple in structures, they are square, and have elements + 1 or −1. Yet they have been actively studied for over 145 years and still have more secrets to be discovered. Hadamard transform may reduce the occurrence of the high peaks comparing the original OFDM system. Hadamard matrix have mutually orthogonal row vectors and orthogonal column vectors, means every two different rows in this matrix represent two perpendicular vectors. The idea to use the orthogonal rows of or columns to reduce the autocorrelation of the input sequence and it requires no side information to be transmitted to the receiver. A block diagram of an OFDM system with Hadamard transform can be given on fig. 03. The Hadamard matrix of 2N orders may be constructed by
(9)
Where -HN is the complementary of HN.Hadamard matrix
satisfies the relation
4.
SIMULATION RESULTS
In this section, we present simulations for a complex baseband OFDM system with N = 64 number of subcarrier employing a BPSK modulation by using randomly
generated OFDM symbols.
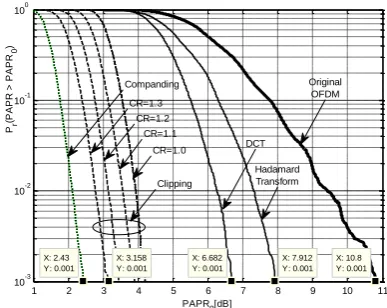
[image:3.595.51.284.376.478.2]Fig. 04shows the CCDF performances of different methods of PAPR reduction. For example, at CCDF=10-3 PAPRs are 2.9 dB, 4.1 dB, 7.65 dB and 8.4 dB for the Hadamard, DCT, Clipping and Companding respectively. Obviously, the signals companded by the nonlinear companding transform can reduce the PAPR largest among these typical methods. Although clipping scheme can improve its performance of the PAPR reduction through reducing its preset clipping level as shown for CR=1.0, 1.1, 1.2 and 1.3.
Fig. 05 shows the CCDF comparison of PAPR using PTS and SLM technique as the number of subblock varies. For PTS scheme, the rotation vectors belong to the set {+1,-1} and the subblocks are 2, 4, 8, and 16. It is seen that the PAPR performance improves as the number of subblocks increases. At CCDF = 10-3 the peak power is reduced by 4.6 dB using SLM and 4.8 dB using PTS. This improvement can be achieved by using U=16, i.e., only 4 bits side information in 64 bits IFFT block. PAPR can be further reduced by employing more redundant bits.
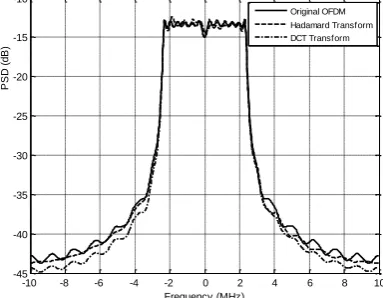
It is well-known that the original OFDM signals have a very sharp power spectrum as shown in Fig. 6-8. This property can be affected by the PAPR reduction schemes, e.g. slower spectrum roll-off, more spectrum side-lobes, and higher adjacent channel interference. Clipping technique causes regrowth of spectrum side-lobes and reduces with the increase in CR level. Nonlinear companding transforms will not cause any spectral regrowth. DCT on the other hand, will reduce side-lobes and out-of-band distortion in Fig. 07. SLM shows a better PAPR performances in Fig. 06 but it has spectrum regrowth in Fig. 08. Compared to SLM, PTS has similar PSD as original OFDM.
5.
CONCLUSION
OFDM is a very attractive technique for communications due to its spectrum efficiency and channel robustness. One of the serious drawbacks of OFDM systems is that the composite transmit signal can exhibit a very high peak power when the input sequences are highly correlated. Although a lot of PAPR reduction techniques have been proposed in the recent years, it is still indeed needed to give a comprehensive review with some motivations of PAPR reductions, compare some typical methods of PAPR reduction through theoretical analysis and simulation results directly. In this paper, six typical techniques to reduce PAPR have been analyzed, all of which are efficient enough to provide substantial reduction in PAPR at the cost of transmit signal power increase, error performance degradation, computational complexity.
REFERENCES
[1] Y. Wu and W. Y. Zou, “Orthogonal frequency division multiplexing: A multi-carrier modulation scheme,” IEEE Trans. Consumer Electronics, vol. 41, no. 3, pp. 392– 399, Aug. 1995.
[2] W. Y. Zou and Y. Wu, “COFDM: An overview,” IEEE Trans. Broadcasting, vol. 41, no. 1, pp. 1–8, Mar. 1995. [3] T. Jiang, W. Xiang, H. H. Chen, and Q. Ni, “Multicast
broadcasting services support in OFDMA-based WiMAX systems,” IEEE Communications Magazine, vol. 45, no. 8, pp. 78–86, Aug. 2007.
transmission,” IEEE Personal Communications, vol. 12, no. 2, pp. 56–65, Apr. 2005.
[5] Tao Jiang and Y. Wu, “An Overview: Peak-to-Average Power Ratio Reduction Techniques for OFDM Signals” IEEE Transactions on Broadcasting, vol. 54, no. 2, pp. 257-268, Jun. 2008.
[6] H. Ochiai and H. Imai, “Performance of the deliberate clipping with adaptive symbol selection for strictly band-limited OFDM systems,” IEEE Journal on Selected Areas in Communications, vol. 18, no. 11, pp. 2270– 2277, Nov. 2000
[7] G. L. Ren, H. Zhang, and Y. L. Chang, “A complementary clipping transform technique for the reduction of peak-to-average power ratio of OFDM system,” IEEE Trans. Consumer Electronics, vol. 49, no. 4, pp. 922–926, Nov. 2003
[8] A. E. Jones, T. A. Wilkinson, and S. K. Barton, “Block coding scheme for reduction of peak-to-average envelope power ratio of multicarrier transmission systems,” IEE Electronics Letters, vol. 30, no. 8, pp. 2098–2099, Dec. 1994
[9] J. Tellado, “Peak to Average Power Ratio Reduction for Multicarrier Modulation,” PhD thesis, University of Stanford, Stanford, 1999.
[10] S. S. Yoo, S. Yoon, S. Y. Kim, and I. Song, “A novel PAPR reduction scheme for OFDM systems: Selective mapping of partial tones (SMOPT),” IEEE Trans. Consumer Electronics, vol. 52, no. 1, pp. 40–43, Feb. 2006.
[11] S.H.MullerandJ.B.Huber,“OFDMwithreducedpeak-to-average
powerratiobyoptimumcombinationofpartialtransmitseque nces,” IEEElectronicsLetters, vol. 33,no.5, pp. 36– 69,Feb.1997.
[12] S.H.HanandJ.H.Lee,“PAPRreductionofOFDMsignalsusin
ga reduced
complexityPTStechnique,”IEEESignalProcessingLetters, vol.11,no.11,pp.887–890,Nov.2004.
[13] D. W.Lim,J. S.No,C.W.Lim,andH. Chung,“A newSLMOFDM schemewithlowcomplexity forPAPRreduction,”IEEESignalProcessingLetters,vol. 12, no.2,pp. 93–96,Feb. 2005.
[14] C.L.WangandQ.Y.Yuan,“Low-complexity
selectedmapping schemesforpeak-to-averagepowerratioreductioninOFDMsystems,”IEEETran s.SignalProcessing,vol.53,no.12,pp.4652–4660, Dec.2005.
[15] C. Tellambura, “Upper Bound on Peak Factor of N- Multiple Carriers,” Electronics Letter, Vol. 36, No. 14, 2000, pp. 1226-1228.
[image:4.595.313.542.77.424.2][16] X. Huang, J. H. Lu, J. L. Zhen, et al., “Companding Transform for Reduction in Peak-to-Average Power of OFDM Signals,” IEEE Transactions on Wireless Communications, Vol. 3, No. 6, 2004, pp. 2030-2039.
[image:4.595.316.539.333.442.2]Figure 01: Block diagram of Selective Mapping (SLM)
Fig. 2: Block diagram of partial transmit sequence (PTS)
Fig. 3: Block diagram of an OFDM system with Matrix
transformation.
Fig. 4: CCDF characteristics of different PAPR reduction.
1 2 3 4 5 6 7 8 9 10 11 10-3
10-2 10-1 100
X: 10.8 Y: 0.001
PAPR0[dB]
Pr
(P
A
P
R
>
P
A
P
R0
)
X: 7.912 Y: 0.001 X: 6.682
Y: 0.001 X: 3.158
Y: 0.001 X: 2.43
Y: 0.001
Hadamard Transform DCT
Original OFDM CR=1.3
CR=1.2 CR=1.1 Companding
CR=1.0 Clipping
Signal Mapper
(PSK)
Matrix Transform
by HN
IFFT S/P
Signal Demapper
(PSK)
Matrix Transform
by
P/S
P/S FFT S/P
Bit Stream
Noise
Bit Stream
IFFT
Phase optimization S/P
Partitio n into V
blocks
Side Information
IFFT
IFFT
Select optimal combinatio
n of phase factors with
lowest PAPR
Selective Mapping
IFFT
Select the branch
with minimum
PAPR
OFDM Signal
Signal Mapper
(PSK)
S/P
Bit
Stream
IFFT
[image:4.595.328.522.486.640.2]Fig. 5: CCDF characteristics of SLM and PTS techniques of PAPR reduction.
[image:5.595.328.523.81.239.2]Fig. 6: PSD of Clipping Technique for CR=1 and 1.3.
Fig. 8: PSD of SLM and PTS
AUTHOR’S PROFILE
Md. Mahmudul Hasan has been an Asst. Professor at
University of Information Technology & Sciences, Dhaka, Bangladesh since 2010 and before that he was an Asst. Professor at KIIT University since 2009. He holds a Masters of Technology degree in Electronics and Telecommunication with specialization on Communication Systems Engineering, and a Bachelor of Technology degree in Electronics and Telecommunication Engineering from KIIT University, India. He has several national and international publications in his area of expertise. His research area addresses the issues related to wireless communication and network; WLAN, multicarrier and multiuser communications like CDMA, OFDM, MIMO; Wireless sensor networks; Smart and Microstrip antenna.
Dr. S. S. Singh has received a PhD in Engineering (Mobile Communication) from Jadavpur University, Kolkata, India and an M.E. in Electronic System and Communication Engineering from NIT Rourkela, India. He is working as an Associate Professor in School of Electronics Engineering, KIIT University, Bhubaneswar, India. Several publications in International journals and reputed international conference proceedings are to his credit. Also he has examinedcouple ofdoctoral dissertations. His broad research area includes but not certainly limited to wireless and mobile communication, multicarrier CDMA, MIMO-OFDM, Wireless Sensor Networks.
Fig. 7: PSD of Hadamard and DCT transform
4 5 6 7 8 9 10 11 12 10-3
10-2 10-1
X: 10.8 Y: 0.00127
PAPR
0[dB]
P
r(
P
A
P
R
>
P
A
P
R0
)
X: 6.2 Y: 0.00141 X: 6
Y: 0.00111
Original OFDM SLM, U = 2 SLM, U = 4 SLM, U = 8 SLM, U =16 PTS, U = 2 PTS, U = 4 PTS, U = 8 PTS, U =16
-10 -8 -6 -4 -2 0 2 4 6 8 10 -45
-40 -35 -30 -25 -20 -15 -10
Frequency (MHz)
P
S
D
(
d
B
)
Original OFDM Clipped (CR=1) Clipped (CR=1.3)
-10 -8 -6 -4 -2 0 2 4 6 8 10 -45
-40 -35 -30 -25 -20 -15 -10
Frequency (MHz)
P
S
D
(
d
B
)
Original OFDM Hadamard Transform DCT Transform
-10 -8 -6 -4 -2 0 2 4 6 8 10 -70
-65 -60 -55 -50 -45 -40 -35 -30
Frequency (MHz)
P
S
D
(
d
B
)
[image:5.595.67.260.285.438.2] [image:5.595.68.260.473.622.2]