http://dx.doi.org/10.4236/fns.2014.521216
Validation of a Food Frequency
Questionnaire for Vitamin D and Calcium
Intake in Healthy Female College Students
Dimitrios Papandreou, Nikolaos Rachaniotis, Maryam Lari, Wafa Al Mussabi
Department of Natural Sciences & Public Health, College of Sustainability Sciences and Humanities (CSSH), Zayed University, Abu Dhabi, UAE
Email: [email protected]
Received 4 September 2014; revised 28 September 2014; accepted 12 October 2014 Copyright © 2014 by authors and Scientific Research Publishing Inc.
This work is licensed under the Creative Commons Attribution International License (CC BY).
http://creativecommons.org/licenses/by/4.0/
Abstract
Objective: The objective of this study was to examine the reproducibility and validity of a Food Frequency Questionnaire (FFQ) and assess calcium and vitamin D intake in health female college students. Methods: Thirty-five healthy female students were conveniently selected to participate in the study. None of the subjects were taking any supplements. The FFQ was validated against in-takes from a three-day diet food record report (FR). Results: Positive correlations were observed of daily vitamin D (r = 0.82, p < 0.001) and calcium intake (r = 0.74, p < 0.001) derived from FFQ compared with the FR. The mean intake of vitamin D and calcium derived from FFQ and FR were (233 ± 90, 654 ± 391) and (231 ± 79, 611 ± 352), respectively. The FFQ overestimated vitamin D and Calcium by 2 IU /day (95% CI: −8, 9, p < 0.676 and 43 mg/d (95% CI: 20, 65, p < 0.01). Conclu-sions: The FFQ used in this study shows promising validation evidence to be used in the future for assessing vitamin D and calcium intakes in female students.
Keywords
Vitamin D, Calcium, Food Frequency Questionnaire, Osteoporosis, Diabetes Type 2, Female Students
1. Introduction
intake of calcium and vitamin D may play significant role in the development of diabetes type 2 and osteoporo-sis and early assessment and prevention of a possible deficiency of these nutrients may seem beneficial later on their life [4] [5].
Nutrient intakes can be estimated by using standard methods such as food frequency questionnaire (FFQ) and food records (FR). FFQ are administrate in a clinical setting by a registered dietitian and it is usually used to asses relation of dietary intake to a development of a disease [6], while FR assess dietary intake of a short time of period usually three days which will include two weekdays and one weekend day [7].
The FFQ should be validated under a specific population taking in consideration country, age, list of food items that all will capture the study population’s eating behaviors and customs [7] [8]. The FFQ has been also validated based on socioeconomic class, adolescents and also in college students [8]-[10]. A pilot validation study of FFQ has been also reported by Pritchard and his collogues [11] in order to assess calcium, vitamin D and vitamin K in obese subjects.
Until now, there are no studies in Arabic countries that they have validated a FFQ for the assessment of vita-min D and calcium intake in adolescents. The purpose of this study was to exavita-mine the reproducibility and va-lidity of a FFQ and to assess calcium and vitamin D intake in healthy female adolescents from a university of Abu Dhabi.
2. Methodology
Forty-five female students were conveniently recruited from January 2014 to March 2014. Ten of them were taking medication or supplements and excluded from the study. The rest 35 subjects (self reported) were free of any known diseases such as diabetes 1 and 2, hyperlipidemia, renal and liver problems, etc. The subjects completed a FFQ and a FR by a registered dietitian two different periods that were one month apart. The study was approved by the ethical committee of Zayed University of Abu Dhabi and a written consent form was signed by all subjects.
Subjects were self-reported on age, weight and height. Body mass index was calculated based on the follow-ing formula, BMI: weight (kg)/height (m)2.
Vitamin D and Calcium was assessed using a FFQ and a FR (3 days-two weekdays and one weekend). The FFQ used was a modified version of a previous validated questionnaire [9], adapted to Arabic eating and culture habits by including specific foods eaten in these areas. The FFQ and FD administered twice by the same person with one-month interval period. An average daily intake of vitamin D and calcium was calculated for the FFQ, while in the FQ the subjects were asked to describe portions sizes and preparation methods for the similar food items were in FFQ.
3. Statistics
Statistical analysis was performed using IBM SPSS for Mac (version 21) package. Descriptive statistics meas-ures and box-plots are provided. Testing of the Normality assumption for the two continuous variables was per-formed by using the Kolmogorov-Smirnov non-parametric test. The comparison of continuous variables’ means of the Ca and vitamin D for the two questionnaires was performed by using a paired samples t-test. For all tests, a significance level of 5% was used.
4. Results
The mean age of the subjects were 20 - 22 years old with a mean weight (kg) of 65 ± 5.8 and a mean height (cm) of 162 ± 6.3.
Table 1 represents the mean values ± SD of calcium and vitamin D intake using the FFQ and FR over one month period apart. Calcium Intake was found statistically significantly lower (p < 00.5) in FR compared with FFQ in the base period. Correlation between FFQ and FR is also indicated. Strong and moderate positive corre-lations were observed of daily vitamin D (r = 0.82, p < 0.001) and calcium intake (r = 0.74, p < 0.001), respec-tively, derived from FFQ compared with the FR. Similar results were found also after the one-month period.
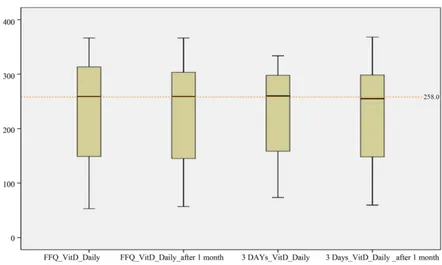
Figure 1 and Figure 2 plots the differences in both time periods between the FFQ and FR for calcium and vi-tamin D, respectively.
Figure 1. Box plots showing the differences of calcium intake between FFQ and FR (3 days) in baseline and after one month.
Abbreviations: FFQ: food frequency questionnaire; 3 day: food record; Ca: calcium.
Figure 2.Box plots showing the differences of vitamin D intake between FFQ and FR (3 days) in baseline and after one
month. Abbreviations: FFQ: food frequency questionnaire; 3 day: food record; Ca: calcium.
5. Discussion
It is well known that in order to assess intakes of key nutrients such as calcium and vitamin D for bone health as well for diabetes type 2, a valid tool is required [12].
[image:3.595.93.535.363.628.2]Table 1. Dietary intakes of calcium and vitamin D.
Mean ± SD1 r
FFQ_Ca_Daily 654 ± 391* 0.74**
FFQ_VitD_Daily 233 ± 90 0.82**
FFQ_Ca_Daily_after 1 month 637 ± 373 0.73**
FFQ_VitD_Daily_after 1 month 229 ± 90 0.81**
FR_Ca_Daily 611 ± 352* 0.74**
FR_VitD_Daily 231 ± 79 0.82**
FR_Ca_Daily_after 1 month 624 ± 356 0.73**
FR_VitD_Daily_after 1 month 226 ± 88 0.81**
*
Statistically significantly difference p < 0.05, **p < 0.001. 1t-test, 2Pearson correlation test, Abbreviations: FFQ: food frequency questionnaire; FR: food record; Ca: calcium intake; vitD: vitamin D intake.
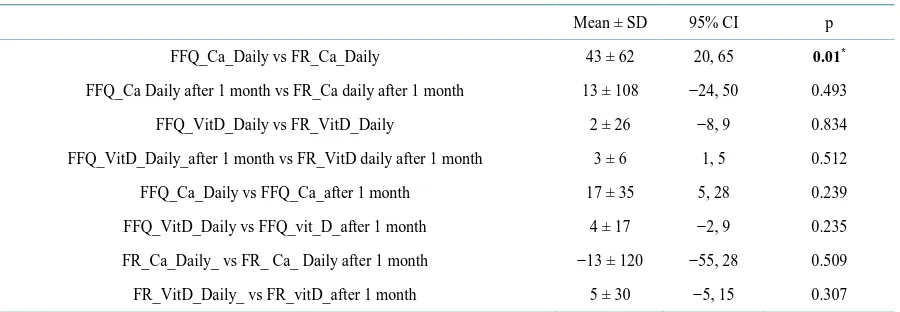
Table 2. Mean differences of Calcium and vitamin D for FFQ and FR in baseline and after one month.
Mean ± SD 95% CI p
FFQ_Ca_Daily vs FR_Ca_Daily 43 ± 62 20, 65 0.01*
FFQ_Ca Daily after 1 month vs FR_Ca daily after 1 month 13 ± 108 −24, 50 0.493
FFQ_VitD_Daily vs FR_VitD_Daily 2 ± 26 −8, 9 0.834
FFQ_VitD_Daily_after 1 month vs FR_VitD daily after 1 month 3 ± 6 1, 5 0.512
FFQ_Ca_Daily vs FFQ_Ca_after 1 month 17 ± 35 5, 28 0.239
FFQ_VitD_Daily vs FFQ_vit_D_after 1 month 4 ± 17 −2, 9 0.235
FR_Ca_Daily_ vs FR_ Ca_ Daily after 1 month −13 ± 120 −55, 28 0.509
FR_VitD_Daily_ vs FR_vitD_after 1 month 5 ± 30 −5, 15 0.307
*
Statistically significantly difference, p < 0.05. Abbreviations: CI: confidence intervals; FFQ: food frequency questionnaire; FR: 3 days food record; Ca: calcium.
however is so small that clinically would have no significant effect to the patients. The results could be possibly be affected by the small number of subjects. However the reproducibility of the two methods was similar after the result of one month indicating that both methods can be accurately measure calcium intake. Similar results have been found in a recent study [13].
Other dietary assessment tools have been reported in the literature with their own weaknesses and strengths. FR has been found to overestimated vitamin D intake [14] while the 24-hour recall is more often preferred be-cause it is less demanding on a study subject; however it relies basically on the memory of the person [6]. In our study we demonstrated that the vitamin D intake reported with negligible differences in both FFQ and FR me-thods. In addition to that the validity of the method was also high after the results of one month. This is very important since it is the first time we validate a FFQ and a FR in a specific population in an Arabic city. Similar data for other population have been identified in the literature such as in Italy [15], Brazil [16] and Malaysia [17].
Our study indicated that 67% of participants were classified into the same quartile of intake of calcium and vitamin D (data not shown). These finding are in accordance with other studies [11].
Our study has its strength that is the inclusion of local foods of Abu Dhabi and also that nature of data that was interviewer administrated.
[image:4.595.91.541.302.458.2]type 2 diabetes are very common in United Arab of Emirates.
6. Conclusion
The FFQ used in this study shows promising validation evidence to be used in the future for assessing vitamin D and calcium intakes in female students. Additional studies with larger samples are needed to validate this FFQ so it can be used as a dietary screening tool for prevention of osteoporosis and diabetes type 2 later on.
References
[1] Holick, M.F. and Chen, T.C. (2008) Vitamin D Deficiency: A Worldwide Problem with Health Consequences. The American Journal of Clinical Nutrition, 87, 1080S-1086S.
[2] Al Attia, H.M. and Ibrahim, M.A. (2012) The High Prevalence of Vitamin D Inadequacy and Dress Style of Women in the Sunny UAE. Archives of Osteoporosis, 7, 307-310. http://dx.doi.org/10.1007/s11657-012-0104-1
[3] Al Anouti, F., Thomas, J., Abdel-Wareth, L., et al. (2011) Vitamin D Deficiency and Sun Avoidance among University Students at Abu Dhabi, United Arab Emirates. Dermato-Endocrinology, 3, 235-239.
http://dx.doi.org/10.4161/derm.3.4.16881
[4] Heaney, R.P. (2005) Vitamin D Requirement in Health and Disease. The Journal of Steroid Biochemistry and Molecu-lar Biology, 97, 13-19. http://dx.doi.org/10.1016/j.jsbmb.2005.06.020
[5] Pittas, A.G., Lau, J., Hu, F.B. and Hughes, D.B. (2007) The Role of Vitamin D and Calcium in Type 2 Diabetes. A Systematic Review and Meta-Analysis. The Journal of Clinical Endocrinology and Metabolism, 92, 2017-2029.
http://dx.doi.org/10.1210/jc.2007-0298
[6] Cade, J., Thomson, R., Burley, V. and Warm, D. (2002) Development, Validation and Utilization of Food Frequency Questionnaire—A Review. Public Health Nutrition, 5, 567-587. http://dx.doi.org/10.1079/PHN2001318
[7] Misra, M., Tsai, P., Anderson, E.J., et al. (2006) Nutrient Intake in Community-Dwelling Adolescent Girls with Ano- rexia Nervosa and in Healthy Adolescents. The American Journal of Clinical Nutrition, 84, 698-706.
[8] Quandt, S.A., Vitolins, M.S. and Smith, S.L. (2007) Comparative Validation of Standard, Picture-Sort and Meal-Based Food-Frequency Questionnaires Adapted for an Elderly Population of Low Socio-Economic Status. Public Health Nu-trition, 10, 524-32.
[9] Taylor, C., Lamparello, B. and Kruczek, K. (2009) Validation of a Food Frequency Questionnaire for Determining Calcium and Vitamin D Intake by Adolescent Girls with Anorexia Nervosa. Journal of the American Dietetic Associa-tion, 109, 479-485. http://dx.doi.org/10.1016/j.jada.2008.11.025
[10] Yang, M., Wang, Y. and Davis, C.G. (2014) Validation of an FFQ to Assess Short-Term Antioxidant Intake against 30 d Food Records and Plasma Biomarkers. Public Health Nutrition, 17, 297-306.
http://dx.doi.org/10.1017/S1368980012005071
[11] Pritchard, J.M., Seechurn, T. and Atkinson, A. (2010) A Food Frequency Questionnaire for the Assessment of Calcium, Vitamin D and Vitamin K: A Pilot Validation Study. Nutrients, 2, 805-819. http://dx.doi.org/10.3390/nu2080805
[12] Institute of Medicine Food and Nutrition Board (1997) Dietary Reference Intakes: Calcium, Magnesium, Phosphorus, Vitamin D and Fluoride. National Academy Press, Institute of Medicine, Food and Nutrition Board, Washing DC.
[13] Tayyem, R.F., Abu-Mweis, S.S., Bawadi, H.A., Agraib, L. and Bani-Hani, K. (2014) Validation of a Food Frequency Questionnaire to Assess Macronutrient and Micronutrient Intake among Jordanians. Journal of the Academy of Nutri-tion and Dietetics, 114, 1046-1052. http://dx.doi.org/10.1016/j.jand.2013.08.019
[14] Hacker-Thompson, A., Schloetter, M. and Sellmeyer, D.E. (2012) Validation of a Dietary Vitamin D Questionnaire Using Multiple Diet Records and the Block 98 Health Habits and History Questionnaire in Healthy Postmenopausal Women in Northern California. Journal of the Academy of Nutrition and Dietetics, 112, 419-423.
http://dx.doi.org/10.1016/j.jada.2011.08.043
[15] Montomoli, M., Gonnelli, S. and Giacchi, M., (2002) Validation of a Food Frequency Questionnaire for Nutritional Calcium Intake Assessment in Italian Women. European Journal of Clinical Nutrition, 56, 21-30.
http://dx.doi.org/10.1038/sj.ejcn.1601278
[16] Serra-Majem, L., Frost Andersen, L., Henríque-Sánchez, P., et al. (2009) Evaluating the Quality of Dietary Intake Va-lidation Studies. British Journal of Nutrition, 102, S3-S9. http://dx.doi.org/10.1017/S0007114509993114