http://dx.doi.org/10.4236/ojapr.2014.22002
A Compact Test System for Simulating
Multipath Interference
Mohammed Eslami1, Howard I. Bassen2
1Analytics, Modeling, and Simulation Division, Aptima Inc., Washington DC, USA 2Division of Physics, Food and Drug Administration, Silver Spring, USA
Email: [email protected], [email protected]
Received 8 April 2014; revised 17 May 2014; accepted 2 June 2014
Copyright © 2014 by authors and Scientific Research Publishing Inc.
This work is licensed under the Creative Commons Attribution International License (CC BY). http://creativecommons.org/licenses/by/4.0/
Abstract
Fading and inter-symbol interference (ISI) arising from multipath effects are a common source of both latency and packet errors in wireless communications. Test methods often require large en-vironments to produce long delays that are enough to affect the communications between a trans- mitter and receiver. This paper presents a simple, compact test method to produce and isolate ef-fects from multipath interference simulating these efef-fects produced by discrete distances. Signals with controlled delays can be created and combined using multiple antennas in two isolated small (2 foot/60 cm) cubes constructed with microwave absorber. We demonstrated this with a pulsed RF signal and a signal from an 802.11 n access point with an internal antenna. This method can be further extended to provide a compact test-bed for almost any wireless interference or coexis-tence test.
Keywords
Fading, Multipath, Wireless Coexistence, Delay Line, Interference
1. Introduction
cult to solve the problem with simple channel equalization, but OFDM solves the problem by sending the data in parallel on orthogonal frequencies. As long as the delay spread of the signal is less than the symbol period on the subcarrier, then the multipath problem is solved fairly well. However, as we are moving to higher data rates, the subcarriers can only allocate so much bandwidth and thus the spread of the signal will again induce ISI. Coexis-tence studies of other in-band signals with OFDM-based communications were conducted [4]-[6].
Experiments modeling large environments with dimensions of 50 feet or more containing reflecting surfaces are difficult to conduct indoors. This is especially true for environments free from outside radiofrequency (RF) signals. A very costly anechoic chamber of this size would be needed to meet this requirement. In this paper we present a simple method, using a compact test environment, to simulate and measure the multipath effects that arise from reflecting objects in a large environment. In our system, we performed measurements that produced multipath ef- fects in received signals. We used controlled delays of a custom pulse modulated RF source and for 802.11 n signals. This methodology can be further extended to provide a compact test bed for any wireless coexistence test.
This paper is organized as follows: Section II provides an overview of prior work on tests conducted to measure fading and delay spreads arising from multipath interference; Section III introduces the test methodology used in this paper and analyzes its results; and Section IV concludes with a summary and future work.
2. Prior Work
Experimental SetupsStudying the effects of multipath interference is important for determining the degradation of the wireless signal in various environments. Papers that discuss experimental modeling of multipath effects on digital wireless com- munications often have experiments that are conducted in a location similar in size to the place the devices are to be deployed. In addition, there are numerous computational studies of experiments conducted to analyze the ef-fect of multipath interference.
In [7] a non-line-of-sight (NLOS) setup was tested with two Zigbee (802.15.4) nodes and it was determined that in typical indoor environments that effects from the delay spread of the signal can be neglected at those low data rates. As a matter of fact, protocols that are using anything lower than 50 Mb/sec can have the effects of delay spread ignored in typical indoor environments (transmitter to receiver distance less than 50 m). However signal loss due to fading effects from multipath still exists at short distances. The NLOS study was performed to find the largest distance where a 0% packet error rate (PER) was maintained between the transmitter and the receiver. Once the location was identified, the interferer, an 802.11 source, was brought in the vicinity of the victim, an 802.15.4 node, to analyze its effects.
In [8] delay spreads on the order of 10 - 40 ns are reported in a typical office environment (6th floor of Faraday Tower in University of Wales) filled with filing cabinets and other furniture by sweeping the carrier frequency from 2 - 20 GHz. They measured frequency responses with three different transmitter locations and 180 distinct receiver locations to model various paths present between the transmitter and receiver which corresponded to a multipath signal whose amplitude was 1/3 the LOS signal delayed by 10 ns. In an experiment by [9] to estimate the effects of multipath on “chaotic radio” pulse tests were conducted in corridors with dimensions of 4 m × 40 m × 3 m and conference halls of 20 m × 4 m × 16 m by varying the distance between the transmitter and receiver from 1 - 20 m. After conducting these tests in these various environments, their results showed that the effect of multipath interference on their signal was negligible. In [10] multipath effects are measured in various large environments such as a multi-story apartment building, an oil refinery, a long corridor in an office building typical of many com- mercial facilities, and a subterranean tunnel, to characterize the risk of BER to emergency responders.
this in an area that is less than several square meters.
Other smaller environments have been investigated for this purpose but each has their drawbacks. For instance, [11] [12] uses a reverberation chamber to simulate different multipath propagation environments with different loads, antenna positions, etc. A comprehensive experimental study by [13] studied the wireless coexistence and EMC of Bluetooth and 802.11b in a Gigahertz Transverse Electromagnetic (GTEM) cell. Data Integrity and throughput were measured during various forms of interferences. GTEM cells are bulky, expensive devices and focus only on TEM waves, while in real environments many modes of TEM, TE, and TM waves could be present. It is for these reasons that a method was developed in this paper to mimic a real environment as closely as possible while providing a tester with explicit control of various isolated paths that they want to examine.
3. Multipath Test Methodology and Results
3.1. Test MethodologyLarge test environments are needed to generate long delay spreads. For instance, a path difference of 20 m be-tween two waves leads to a 66.7 ns delay in their arrival time at the receiver. When modeling large indoor envi-ronments, it is difficult to produce and isolate the effects of multipath interference unless RF absorber is used to line the test environment and cover any metallic cables or other miscellaneous conducting objects. Our goal in generating experimental modeling of multipath interference is to selectively produce, in a very small and low cost environment, a delay between the times of arrival of two or more signals at the receiving device under test (DUT). This test methodology works explicitly well for DUTs that have integrated antennas that lack a cable connector, like many medical devices. This is to see the effects of fading during constructive and destructive in-terferences of the reflected signals. The novelty in this method is that we can mimic delays that are produced from large environments in a small, low-cost setup. The various path differences can be selectively analyzed to find the path that would produce the worst case interference and result in EMI of the transmitter with the DUT.
The model of large environments was conducted by isolating the transmitting DUT and receiving DUT from one another by placing them in separate 61 cm × 61 cm shielded enclosures lined with absorbing material. This avoids any coupling of external fields. It also allows control of the RF signals at the receiver by tapping into the radiating transmitter’s signals with an antenna. The use of one or more long coaxial cables as delay lines can provide the appropriate arrival times of multiple signal paths that would arise from multipath effects. Attenua-tors and amplifiers are placed within the setup to ensure appropriate signal strength at the various stages of the test-bed.
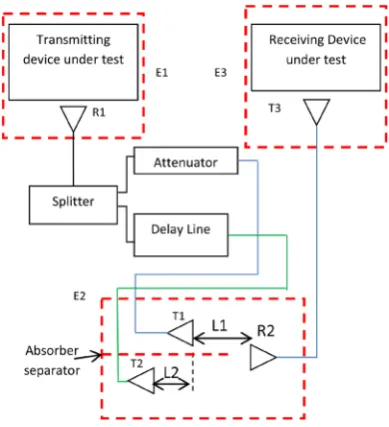
The test setup used in our lab is shown in Figure 1 and only focuses on a direct path and one delayed path, however, it should be noted that this setup can be expanded to model any environment for wireless coexistence tests.
The system’s signal flow is as follows.
1. RF transmissions from the transmitting DUT are captured by antenna R1 in absorber lined enclosure with metal backing (E1).
2. Antenna R1 delivers a signal to an RF power splitter via coaxial cable. The splitter divides the signal and delivers it to an attenuator and to a delay line (low loss coaxial cable).
3. The attenuator and delay line signal outputs are routed via coaxial cables to absorber lined enclosure with metal backing (E2) containing transmitting antennas.
4. The attenuator reduces the direct-signal to transmitting-antenna T1 to a selected amplitude. The other out-put of the splitter is routed to the delay line whose outout-put is routed to antenna T2.
5. In enclosure (E2) antenna T1 transmits a direct path signal to receiving antenna R2 which is separated by distance L1. The delay line establishes a later time of arrival for a second signal radiated from antenna T2 and is separated from antenna T1 by an absorbing divider. T2 is separated from antenna R2 by distance L1 plus dis-tance L2.
6. The distance L2 can be varied to produce constructive or destructive interference with the direct and de-layed signals arriving at R2.
7. Receiving antenna R2 delivers a signal to a coaxial cable from enclosure E2 to enclosure E3. E3 shields other outside sources from antenna T3. This antenna radiates a wireless signal to the receiving DUT and isolates the antenna setup in E2 from any reflections arising from the DUT.
Figure 1. Red dotted lines indicate absorbing enclo- sures (E1, E2, and E3) that contain receiving antennas (R2) and transmitting antennas (T1, T2, T3). Antennas T1 and T2 are also separated by an absorber to avoid mutual coupling and reflections.
loss conditions. One condition simulates the direct path loss between the wireless DUT when the receiving DUT is in the far field of the transmitting device. This loss (PL) between the transmitting and receiving DUT is given
in Equation (1).
2
L TX RX
P =G ∗G ∗λ 4πR (1)
R is the distance between the transmitting and receiving antennas. The carrier signal wavelength is λ and GTX
and GRX are the gains of the transmitting and receiving antennas respectively.
The delay line can be chosen to adjust the delay between the direct signal (antennas T1 and R2) and the signal traveling a different path (reflected multipath). Although not shown in Figure 1, the signal can be further split into more delay lines and antennas to model more trajectories. Using a single delay line can determine the tra-jectory that will have the greatest effect on the direct signal. The delay line does not necessarily incorporate the worst case scenario of multipath fading. In order for the worst case scenario to be analyzed, an additional varia-ble delay whose size is no larger than half wavelength must be inserted to find the maximum and minimum vol-tages of the incident wave. By moving antenna T2 various distances (L2) greater or equal to plus or minus one quarter wavelength, one can measure the effects of constructive and destructive interference when the signal ar-rives in and out of phase, respectively. Angle φ is the phase shift between the direct and delayed wave. This pro- cedure is qualitatively shown in Figure 2.
3.2. Measurements Using an RF Signal with Pulsed Modulation
In an effort to see the effects of fading clearly, the following multipath setup was used instead of an actual wire-less signal. A pulse-amplitude modulated continuous wave signal at 2.45 GHz was produced using an Agilent MXG N5183A Signal Generator that provided a peak power signal at 2.45 GHz of 4.00 dBm. The pulse mo- dulation was provided by an HP 8007A pulse generator. The signal generator’s output was split by a Mini-Cir- cuits ZN2PD2-50-S+ splitter that provides a signal for the direct path and the delayed path. The direct signal was first passed through a −10 dB attenuator (Narda 757C) and then fed to antenna T1 to equalize the signal strength with respect to the signal out of the delayed signal. A single low loss coaxial cable, 50 m in length (Pas- ternack Enterprises PE37940-1968.25) formed the delay line whose total measured loss was −35 dB.
[image:4.595.201.396.84.298.2]Figure 2. Initial (red) LOS phasor with the single path reflection received. The reflection is shown rotated to (blue) minimum and (green) maximum effect. The vector sum (Vsum) of the red vector with the blue/green vector gives the overall magnitude of the phasor.
Figure 3.Test setup to measure fading effects from 50 m de-lay line with pulsed modulation on a 2.45 GHz carrier signal. The attenuator is modeling the direct path while the delay line introduces a 50 m path difference. All antennas are sleeve di-pole antennas at +6 dB gain and the red dashed box is an ab-sorbing enclosure.
Preamplifier (+30 dB). The amplifier fed the Advanced Control Components, ACSP-2538NC3R RF envelope detectors with enough power so their output could be resolved by an Agilent Technologies Infiniium DSO91048 Digital Storage Oscilloscope.
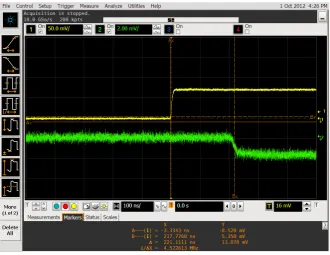
The separation distance (L1) between antenna T1 and antenna R2 was arbitrarily fixed at 41 cm to provide a baseline measurement. The delayed signal passed through a 50 m spindle of cable which was then fed to antenna T2, whose distance (L2) was varied from 41 cm ± λ/4 (3.1 cm). Before testing the setup in Figure 3, preliminary measurements were first made to ensure the delayed pulse could be captured by the RF detectors. The setup used to make these measurements was identical to the setup shown in Figure 3 except that the lines going into antennas T1 and T2 were directly connected to two RF detectors (one positive polarity and one negative polarity) and then to the oscilloscope. Figure 4 shows the outputs of the RF envelope detectors with a signal directly from the RF signal generator and splitter (no antennas). Outputs are the direct (yellow-top) and delay line (green-bottom) ha- ving a delay on the order of 217 ns. The signal generator pulse width is 1.22 µsec.
[image:5.595.185.411.311.450.2]Figure 4. Output from the (yellow-top) direct/positive and (green-bottom) delayed/negative detectors with a pulse width set to 1.2 µsec. The delay observed is on the order of 217 nsec.
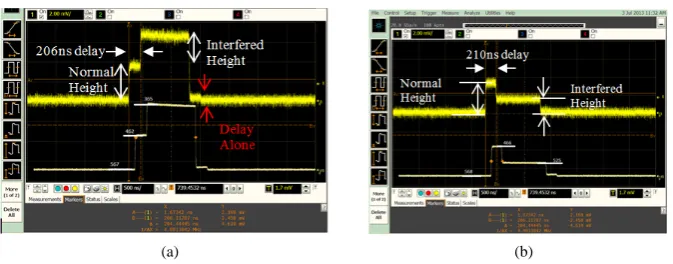
about [−λ/4, λ/4] with respect to antenna T1. This changed the phase with respect to antenna T1 and constructive or destructive interference with the direct signal occurred as seen by receiving antenna R2. Figure 5 shows the re-sults with the interference occurring at about 210 ns after the pulse begins. The antenna was moved back and forth until a maximum ratio
( )
ρ was found for each case.Interefered Height Normal Height
ρ = (2)
Finally, we can explore the use of our small, inexpensive enclosures to eliminate the need for an expensive, large anechoic chamber. These enclosures can be applied to several types of wireless coexistence and EMC tests. The enclosures provide the ability to test wireless receivers without interference from other ambient RF sources. They can be used with a pickup antenna inside them to couple and adjust the amplitude and pulse timing of ra-diated RF emitted by a simultaneous mix of medical and other wireless devices with embedded antennas and no coaxial output connector.
In the case of constructive interference it was determined that ρ=0.92, and in the case of destructive inter-ference we saw that ρ=0.42. The change in field strength levels at the two distances attributes to the difference in these ratios. We noted that the amplitudes did not match the system diagram losses shown in Figure 3. When signals from antennas T1 and T2 coincided, it produced an increase in the waveform (“Interfered Height” in
[image:7.595.132.469.81.213.2]
(a) (b)
Figure 5.Measurements taken by moving antenna T2 to (a) 38.2 cm (roughly −λ/4 with re- spect to antenna T1) for a constructive maximum and (b) 43 cm (roughly +λ/4 with respect to antenna T1) for a destructive minimum. Horizontal arrows indicate that the interference occurs at 206 ns from the start of the pulse as was expected from Figure 4. The white plots depict the average of the raw signal to filter out the high frequency noise and calculate the ratio ρ using the pixel locations of the zero, direct, and delayed signal levels.
3.3. Measurements Using an 802.11 n Router
In the previous section, the incoming modulation of the carrier wave was regular and known. Any change in the envelope was easily detected and identified as multipath interference. For the case of an 802.11 n router, the signal was more complex with signals consisting of a series of short pulses within each RF burst. An experiment was conducted to see the effects on the temporal signal at the receiver from an 802.11 n transmitter in the beaconing mode. Packets from a Belkin 450N DB 802.11 n router were first analyzed to form a baseline of common beacon- ing signals emitted by it while located in an anechoic chamber as shown in Figure 6. The voltages of the mea-surements that were made are shown in Figure 7.
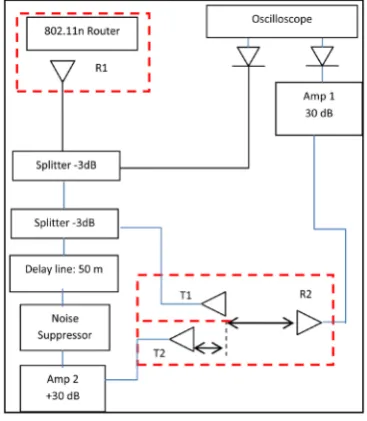
To study multipath effects on this signal using the delay line, the test setup in Figure 3 was modified and the new setup is shown in Figure 8. Due to the −35 dB loss in the delay line, the delayed signal was first passed
through a Mini Circuits ZHL-42 RF amplifier to ensure the signal is comparable to that of the direct line to be able to observe effects. In addition, a 60 Hz noise suppressor was added in series with the delay line to eliminate ground loop noise from the oscilloscope and other AC powered components
This system was used to see if multipath effects were evident. Using discrete movements of antenna T2 from antenna T1 at 0 cm, 3 cm, and 17.5 cm, the effects of multipath interference were measured. An example of a comparison of envelope-detected waveforms is shown in Figure 9. One waveform is from the combined signals (direct plus delayed shown in yellow) received by antenna R2 followed by an RF amplifier. The other signal is from the router only (reference shown in green) from antenna R1. The red oscilloscope cursors align the bumps from both signals and show a minor 20 ns delay between the two paths. This is due to the slightly different paths the reference and the direct signal traverse. The delayed signal arrives about 205 ns after the start of the refer-ence signal; following this, the received combined signal’s waveform is notably different (with wider pulses) than the reference signal. The first 200 ns of the signal are shown with the white vertical lines. The lower am-plitude during the first few pulses of the combined signal (yellow) is due to the use of a RF amplifier (Amp 2) making the delayed signal stronger than the direct signal.
3.4. Comparison of Results
Figure 6. Test setup to determine the baseline sig- nals from an 802.11 n router. The actual signals from this detector can be seen in Figure 7.
Figure 7. (a) Beaconing packets from an 802.11 n router (b) Zoomed in on first pulse and (c) Zoomed in on second pulse.
[image:8.595.196.402.212.426.2] [image:8.595.206.390.466.677.2](a)
(c)
Figure 9. Measurements from an 802.11 n router signal in the configuration shown in Figure 8 with the layed antenna placed at (a) 0 cm (b) 3 cm (c) 17.5 cm. The yellow signal depicts the sum of the direct and de-layed antenna as it is received in R2, while the green shows a direct line from antenna R1. The red vertical cursors align corresponding bumps, the slight delay of 20 ns is due to the different components the signals must traverse. It is clear that after 200 ns, shown by the white vertical overlays, the signals no longer have cor-responding forms since the delayed antenna, T2, interferes with the direct signal from T1.
the next step in our future research.
4. Conclusion
In this paper, we explored a method for experimentally simulating multipath effects normally occurring in large, reflecting environments. The simple, compact test methodology can also be conducted in places where large an- echoic chambers are not readily available. We used various configurations: each consisting of several compact, absorber-lined enclosures, a coaxial cable delay line (50 m long), a number of low cost transmitting and receiv-ing antennas, a RF amplifier, and other low cost components. Effects on the output signal were observed by mo- ving the delayed transmitting signal antenna in discrete steps between [−λ/4, λ/4] while the transmitting antenna with the non-delayed signal remained stationary. The overall experimental setup provided a single 205 ns multi- path-like delay in a 1.5 m × 3 m area instead of a 50 m long room or anechoic chamber.
5. Future Work
Finally, we can explore the use of our small, inexpensive enclosures to eliminate the need for an expensive, large anechoic chamber for other applications. These enclosures can be applied to several types of wireless coexistence and EMC tests. The enclosures provide the ability to test wireless receivers without interference from other am-bient RF sources. They can be used with a pickup antenna inside them to couple and adjust the amplitude and pulse timing of radiated RF emitted by a simultaneous mix of medical and other wireless devices with embedded an-tennas and no coaxial output connector. In the future we can produce a number of simultaneous radiated signals, using multi-way splitters. Each splitter output could feed longer delay lines and individual transmitting antennas, placed in the same enclosure. Each delay line could be composed of a series of several discrete, long spools of coaxial cable, with amplifiers inserted as needed. This test methodology can be used to generate a simple, inex-pensive, and compact multipath test-bed for wireless coexistence tests. In addition, once this method is characte-rized at the bit level for wireless communications, a similar method would be to use programmable delay lines and combiners rather than antennas and splitters. This could prove to be more controllable than that of the current methodology. This approach would be a combination of this test methodology with that proposed in [14].
Finally, we can explore the use of our small, inexpensive enclosures to eliminate the need for an expensive, large anechoic chamber for other applications. These enclosures can be applied to several types of wireless co- existence and EMC tests. The enclosures provide the ability to test wireless receivers without interference from other ambient RF sources. They can be used with a pickup antenna inside them to couple and adjust the ampli-tude and pulse timing of radiated RF emitted by a simultaneous mix of medical and other wireless devices with embedded antennas and no coaxial output connector.
Acknowledgements
This project was supported in part by an appointment to the Research Participation Program at the Center for Devices and Radiological Health administered by the Oak Ridge Institute for Science and Education through an interagency agreement between the US Department of Energy and the US Food and Drug Administration.
Disclaimer
The mention of commercial products, their sources, or their use in connection with material reported herein is not to be construed as either an actual or implied endorsement of such products by the Department of Health and Human Services.
References
[1] Moschitta, A., Macii, D., Trenti, F., Dalpez, S. and Bozzoli, A. (2012) Characterization of a Geometrical Wireless Sig- nal Propagation Model for Indoor Ranging Techniques. 2012 IEEE International Instrumentation and Measurement Technology Conference (I2MTC), 13-16 May 2012, 2598-2603.
[2] Salih Alj, Y., Despins, C. and Affes, S. (2008) Impact of Multipath Interference on the Performance of an UWB Fast Acquisition System for Ranging in an Indoor Wireless Channel. 6th Annual Communication Networks and Services Research Conference, CNSR 2008, 5-8 May 2008, 390-396.
[3] Rappaport, T. (2002) Wireless Communications. 2nd Edition, Prentice Hall.
[4] Li, Z., Zou, W.-X. and Li, B. (2011) Analysis on Coexistence of Ultra Wideband with OFDM-Based Communication Systems. IEEE Transactions on Electromagnetic Compatibility, 53, 823-830.
http://dx.doi.org/10.1109/TEMC.2011.2159979
[5] Sharma, G.V.V. and Srinivasan, S.H. (2005) Symbol Detection in CDMA-OFDM Coexistence. IEEE 16th Internatio- nal Symposium on Personal, Indoor and Mobile Radio Communications, 2531-2534.
[6] Jo, H.-S., Yoon, H.-G., Lim, J., Chung, W.-G., Yook, J.-G. and Park, H.-K. (2006) The Coexistence of OFDM-Based Systems beyond 3G with Fixed Service Microwave System. Journal of Communications and Networks, 8, 187-193. http://dx.doi.org/10.1109/JCN.2006.6182747
[7] LaSorte, N.J., Rajab, S.A. and Refai, H.H. (2012) Experimental Assessment of Wireless Coexistence for 802.15.4 in the Presence of 802.11g/n. 2012 IEEE International Symposium onElectromagnetic Compatibility (EMC), 6-10 August 2012, 473-479.
[11] Genender, E., Holloway, C.L., Remley, K.A., Ladbury, J., Koepke, G. and Garbe, H. (2008) Use of Reverberation Chamber to Simulate the Power Delay Profile of a Wireless Environment. 2008 International Symposium on Electro-magnetic Compatibility—EMC Europe, 8-12 September 2008, 1-6.
[12] Fielitz, H., Remley, K.A., Holloway, C.L., Zhang, Q., Wu, Q. and Matolak, D.W. (2010) Reverberation-Chamber Test Environment for Outdoor Urban Wireless Propagation Studies. IEEE Antennas and Wireless Propagation Letters, 9, 52-56.
[13] Seidman, S., Kainz, W., Ruggera, P. and Mendoza, G. (2011) Wireless Coexistence and EMC of Bluetooth and 802.11b Devices in Controlled Laboratory Settings. Open Biomedical Engineering Journal, 5, 74-82.
currently publishing more than 200 open access, online, peer-reviewed journals covering a wide range of academic disciplines. SCIRP serves the worldwide academic communities and contributes to the progress and application of science with its publication.