A WPD Scanning Technique for Iris Recognition
Ahmad. M. Sarhan
Department of Computer Engineering College of Computers and Information Technology
Taif University Taif, Saudi Arabia
ABSTRACT
In this paper, we propose an algorithm that scans the WPD coefficients in a way that preserves the amplitudes and relative locations of certain high –magnitude approximation coefficients while discarding the rest of the transform coefficients. The proposed WPD scanning technique greatly improves the feature extraction capabilities of the standard WPD transform. When tested on the iris recognition problem using the CASIA database and the ANN classifier, the proposed system produces zero classification error and always outperforms the standard WPD system.
General Terms
Pattern Recognition, Biometrics, Iris, Wavelets
Keywords
Feature extraction, Wavelet packet decomposition (WPD), Iris; Biometrics; Artificial neural network (ANN).
1.
INTRODUCTION
1.1
Overview
The Wavelet Packet Decomposition (WPD) transform has been successfully applied in many applications including classifications and pattern recognition. In this paper, we propose a technique for scanning the WPD coefficients. The proposed modified WPD (MWPD) scanning algorithm utilizes both the amplitudes and relative locations of certain high-magnitude WPD coefficients. The MWPD algorithm greatly improves the feature extraction capabilities of the standard WPD transform.
To test the proposed MWPD method, we apply it to the iris recognition problem. The iris images used in this study are obtained from the CASIA database. The proposed system uses an integro-differential operator to segment the input iris images. The isolated irises are converted to vectors of the same length and then transformed using the 1-D WPD transform. Classification features are extracted from the approximation vectors using the proposed scanning technique. The extracted features are then introduced to an artificial neural network (ANN) for classification. To show the validity and robustness of the proposed system, its performance is compared to the standard WPD system. Both systems use the same ANN classifier. Simulation results show that the proposed system produces zero recognition error and always outperforms the standard system.
1.2
Iris recognition
In many applications such as authentication, information protection, and access control, it is important to determine the identity of a person. Standard methods of recognizing the identity of a person by using identification cards or passwords are not always dependable since passwords can be forgotten and identification cards can be lost, stolen, or forgotten. Therefore, there is a tremendous interest in identification (biometric) methods which depend on measures that cannot be
lost, forgotten, or stolen. Biometrics today has found many applications besides security, including machine learning, image understanding, signal analysis, and neuroscience.
Biometric methods identify people based on physiological characteristics such as face, fingerprint, palm print, hand geometry, DNA, iris, and retina. Behavioral characteristics such as gait, voice, and handwriting can be also used by biometric systems. In general, any human characteristic could be a biometric given that it meets the following conditions: (a) time-invariance (the characteristic should be invariant with time), (b) uniqueness (no two persons are the same with respect to the characteristic), (c) universality (every person has the characteristic), and (d) collectability (the characteristic can be measured quantitatively) [1, 2].
Among all the human physical characteristics, the iris has been widely regarded as the most accurate biometric. The iris has many outstanding properties including unique visible characteristics, stability over a person’s lifetime, and secure nature (As an internal organ, the iris is very difficult to replace; which minimizes the risk of deceiving the recognition system). The iris is the colored ring (membrane) of the eye, bounded by the white sclera and the black pupil. It controls the amount of light reaching the interior of the eye (retina). The iris and the pupil are covered by a clear covering called the cornea. The iris is composed of pigmented fibro vascular tissue known as stoma. Being the most forward part of the eye, the iris is seen on trivial inspection. The iris has an intricate structure that includes a rich pattern of minute characteristics such as coronas, furrows, freckles, and crypts. Fig. 1 shows the iris and other components of the eye.
(b)
Fig. 1: Two views of the human iris [3].
In this study, we propose and develop a biometric system for iris recognition. The system employs an integro-differential operator to locate the iris structure. Distinctive features are then obtained from the segmented iris image using an operation based on the WPD and a novel scanning technique that preserves the amplitudes and the relative locations of certain high-magnitude approximation coefficients while discarding the rest of the approximation and detail coefficients. Classification of the iris feature vector is then achieved using an ANN classifier. To test the proposed system, we use the Chinese academy of sciences institute of automation (CASIA) database [4], a freely available iris database containing images of human irises. To prove the validity and robustness of the proposed method, its performance is compared to that of the standard WPD system.
2.
SURVEY OF THE STATE OF THE
ART IN IRIS RECOGNITION
This survey provides a short coverage of the commercial applications and current state of the art in iris biometrics. Most of the research publications in this field have made contributions to several areas in iris biometrics including image acquisition, iris segmentation, feature extraction, and classification (matching). The most important contribution in the early history of iris biometrics was made by Daugman where he proposed an automatic iris recognition system [5-7]. Daugman’s approach has laid the ground for most of the subsequent research in iris biometrics and has become a standard reference model. In [7] Daugman describes a border-control application of iris recognition that is currently being used in the United Arab Emirates (UAE) to check visitors to the country. The UAE database contains 632,500 different iris images. Daugman reports that the use of an iris recognition system allowed the arrest of about 47,000 people trying to enter the UAE using fake passports. The UAE police reports that all the matches have also been confirmed by other means. Another successful example of the commercial use of iris identification systems is presented by the Cairo Amman Bank (CAB) in Jordan. In 2008, the CAB in cooperation with the leading biometric security manufacturer IrisGuard, was the first bank in the world to implement the ocular security scan technology. The CAB now offers this service in more than 80 branches and 215 ATM machines [8].
[image:2.595.312.552.425.512.2]This survey also includes the following contributions. Kekre et al. worked on the iris recognition problem using Haar Wavelets for feature extraction and the Euclidean distance for classification [9]. They used the Palacky database and found that Haarlets level-5 outperforms lower-level Haarlets. Sarhan used the CASIA database and developed an iris recognition system in which he used an ANN for classification and the discrete cosine transform (DCT) for feature extraction [10]. A comparison of different iris feature extraction methods was developed by Vatsa et al. [11]. An experimental comparison of different segmentation methods was developed by Proenca et al. [12]. Proenca also developed an iris recognition system using structural pattern analysis methods [13]. Phillips et al. compiled an evaluation report of the current state-of-the art in iris biometrics [14]. For the purpose of reducing the transmission time of iris images in portable iris applications (such as law-enforcement), Ives et al. worked on compression techniques of iris images [15]. Several iris databases are freely available online. The list includes the CASIA database, the iris challenge evaluation (ICE) database [16], the IIT Delhi (IITD) iris database [17], and the UBIRIS database. The UBIRIS v.1 database, developed by the University of Beira Interior in Portugal [18], contains 1877 images collected from 241 eyes and has a spatial resolution of 800 × 600 pixels. It simulates less constrained imaging conditions. As an alternative to iris database collection, Wei et al. produced a model to synthesize iris databases [19]. Segmented iris images are available from the Palacky database, a relatively small iris database created at Palacky University [20]. It contains 3 × 128 segmented iris images. The images have an RGB format with spatial resolution of 576 × 768 pixels and 24 bits per pixel. Fig. 2 shows two iris images of a left eye.
Fig. 2: Palacky database: Two iris images of the same eye
3.
MATERIALS AND METHODS
3.1
Overview
A block diagram of the proposed system is depicted in Fig. 3.
Fig. 3: Block diagram of the proposed system.
The input to the system is a raw eye image obtained from the CASIA v. 2 database which contains 1200 raw eye images. The images are for 30 persons. For each person, there are 20 iris images for the left eye and another 20 images for the right eye, giving a total of 40 images per person. Each image is composed of 480640 pixels with 256 grey levels per pixel.
Input
Image I
Segmentation
S
Preprocessing
n
Output
class
f
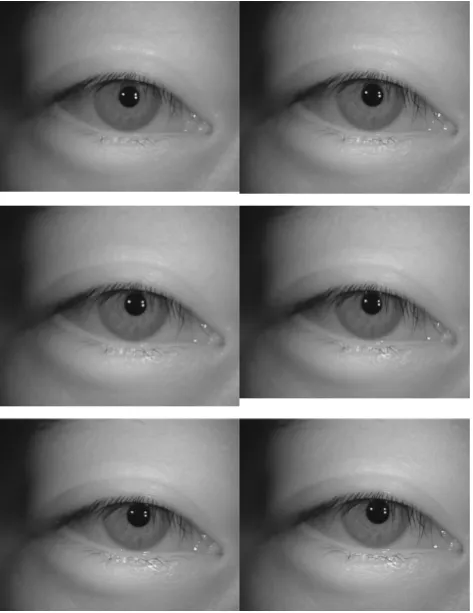
[image:2.595.315.547.590.693.2]We used in this study the right-eye images of seven classes. Therefore, our dataset contained 140 images; 100 of which were used for training and the rest were used for testing. Fig. 4 shows six sample images for a person's right eye.
Fig. 4: Six images of the same eye (CASIA, v.2)
In the first stage of the proposed system, the input image I is segmented using the integro-differential operator to isolate the iris disc S from the rest of the eye image. Image segmentation is the process of partitioning a digital image into multiple portions and is generally used to identify objects in images. In this application, the segmentation algorithm attempts to assign each pixel one of the four main labels: iris, pupil, background, and eyelash. A reliable iris segmentation algorithm must be able to deal with several difficulties including out-of-plane rotation of the eye image, iris occlusion by the eyelids and the eyelashes, and various illumination effects (which can be reduced if the camera uses infrared illumination). The Integro-differential operator, introduced by Daugman in [5], is basically a circular edge detector algorithm that assumes circular structure of the pupil and limbus. It finds all circles in an image. The sum of pixel values within each circle is compared to the values of adjacent circles. The circle with the maximum difference from its adjacent circles is recognized as the iris.
Other commonly used segmentation methods include the active contours and the Hough transform techniques. The classical Hough transform was originally introduced by Paul Hough as an image feature extraction technique for identifying lines in the image [21]. Later, the generalized Hough transform technique was presented by Duda et al. in 1972 to identify positions of arbitrary shapes, especially circles and ellipses [22]. Active contours, or snakes, are curves that move within an image to detect object boundaries.
After the iris disc S is isolated from the input eye image I, it is converted to a vector and then transformed using the WPD and scanned using the proposed MWPD method. The transform of a signal gives another way of representing the signal. Lossless transforms do not change the information content or energy of the signal. Suitably selected transforms can be used effectively in various signal and image processing applications including compression, restoration, coding, and feature extraction.
For decades, the most commonly used transform in many digital signal processing (DSP) applications has been the Fourier transform (FT). However, the FT has several weaknesses, especially its lack of time resolution. The wavelet transform (WT), on the other hand, has both time and frequency resolutions and has proven to be more effective in many DSP applications. Unlike the FT whose basic functions are sinusoids, the WT is based on filter banks called wavelets which have a varying frequency and limited duration. The most commonly used wavelets are the Daubechies (db) and the Haar wavelets. The db1 wavelet, which resembles a step function, is the same as the Haar wavelet.
Typical signal transforms decompose the signal into low and high frequency components. In wavelet nomenclature, the corresponding terms are approximation and detail components, where details are the high-frequency (low-scale) parts and approximations are the low-frequency (high-scale) components of the signal. The discrete Wavelet transform (DWT) is a subset of the WPD transform. Unlike the DWT which decomposes only the previous approximation coefficients, the WPD decomposes both the previous approximation and detail coefficients, constructing a complete tree (Fig. 5). It is illustrated by Fig. 5 that the decomposition of the iris vector I, at the first level of decomposition, produces two vectors of coefficients: approximation and detail coefficients, which represent the characteristics of the signal spectrum in the low and high-frequency bands, respectively. At level 2, the vectors of approximation and detail coefficients experience another decomposition, which reduces their size by half. Vector sizes are are reduced to half of their previous values with each higher decomposition level.
Fig. 5: WP tree. Variables I, A1 and D1 represent the iris
vector, approximation, and detail coefficients at level 1, respectively.
3.2
Feature extraction using the MWPD
technique
The WPD is known for its outstanding energy concentration property, and has found many practical applications in signal and image compression. For example, the compression achieved by the common JPEG-2000 image format is based on the DWT. We exploit this energy compactness characteristic of the WPD transform to form the proposed MWPD scanning technique that is capable of extracting highly distinctive features.
I
A1
DA 2
AA2
D1
DD2
[image:3.595.318.543.503.577.2]In developing the proposed MWPD feature extraction algorithm, we show that the WPD compresses most of the energy in a few high-magnitude coefficients and then we demonstrate that the locations of these coefficients differ for different iris inputs. Last, we prove that the proposed MWPD scanning technique keeps track of both the magnitudes and relative locations of certain high-energy coefficients; and hence, produces robust iris features.
The power of the WPD in concentrating the energy in a limited number of high-magnitude coefficients in the transformed signal is illustrated in Fig. 6. Figs 6a and 6b
depict a histogram of an iris vector (representing an iris image) and a histogram of the approximation coefficients of
[image:4.595.367.487.214.376.2]its WPD (defined at decomposition level six), respectively. Fig. 6b demonstrates that unlike the original iris vector (Fig. 6a), only a small portion of the approximation coefficients have high-magnitudes. Specifically, only 11 approximation
[image:4.595.65.267.269.417.2]coefficients in this example have magnitudes higher than 1700.
Fig. 6: Histogram of (a) Iris vector and (b) Its WPD approximations coefficients.
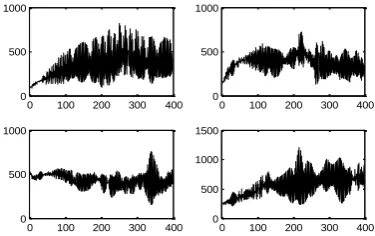
[image:4.595.82.270.502.620.2]After demonstrating that the WPD places most of the energy in a few coefficients, we prove that the approximation vectors corresponding to different inputs have substantially different magnitudes and locations. Fig. 7 shows the vector averages (centroids) of the approximation vectors corresponding to iris vectors of four classes
Fig. 7: centroids of approximation vectors, at level 6, for four iris classes (20 samples per class), using the db1.
It can be seen from Fig. 7 that approximation vectors of different classes have different peak values and different peak locations. We exploit this characteristic of the WPD transform to form a scanning technique that preserves the magnitudes and keeps track of the relative locations of the high-energy approximation coefficients. Since iris vectors have variable lengths depending on the input eye image and since all input feature vectors introduced to an ANN must be of the same dimension, the iris vectors must first be preprocessed so that they all have the same length before being transformed by the WPD. The preprocessing is
accomplished here by simply truncating all iris vectors so that their lengths are equal to the length of the smallest iris vector belonging to the dataset under study.
The proposed MWPD scanning method is depicted in Fig. 8. Figs 8a and 8b show the input approximation coefficients and the output of the proposed algorithm operating on this input, respectively. The figure illustrates that for a threshold level of 15.1, for example, the scanning operation keeps only the coefficients whose absolute values are greater than 15.1. As can be seen from Fig. 8, the proposed masking technique keeps track of both the magnitudes and the relative locations of the high-energy approximation coefficients and is therefore able to distinguish between different iris classes.
96.8 96.8
15.2 15.2
15.0 0
12.0 0
-15.0 0
-15.2 -15.2
(a) (b)
Fig. 8: Illustration of the proposed MWPD masking operation using a threshold level of 15.1: (a) Input approximation coefficients and (b) output feature vector.
The output of the proposed masking technique operating on the preprocessed approximation vector n produces the feature vector f which is then applied to an ANN for classification. The mathematical expression for the MWPD operation is given by Eq. 1.
f = n × (n > thresh), (1)
where the "greater than" sign (>) is a logical operator and thresh is a threshold value.
In the last stage of the proposed system, f is presented to an ANN for classification. ANNs are algorithms that can "learn" to solve complex problems from training data that consists of pairs of inputs and desired outputs (targets). ANNs have been effectively employed in many applications including machine vision, pattern detection, data compression, data mining, adaptive control, and optimization. The basic building block of the ANN is the neuron (depicted in Fig. 9). The output of the neuron is a weighted sum of its inputs. The neuron’s scaled output y is given by y = f(a), where f is a transfer function. A typical ANN consists of interconnected neurons.
0 50 100 150 200 250 300 0
5000 10000
(a)
0 500 1000 1500 2000
0 50 100
(b)
0 100 200 300 400 0
500 1000
0 100 200 300 400 0
500 1000
0 100 200 300 400 0
500 1000
0 100 200 300 400 0
Fig. 9: The structure of a single neuron: Xi, Wi, b, and y
are the inputs, weights, bias, and output, respectively.
The weights of the neuron are calculated iteratively so as to optimize a selected criterion such as the Mean-Squared-Error (MSE) between the ANN output and its desired output. Many adaptation or learning algorithms have been proposed in the literature. One of the most commonly used learning algorithms is the Back-propagation algorithm. Optimum weights in the sense of Least Squared Errors have been derived by Widrow and Hoff and the algorithm is known as the Windrow-Hoff rule or as the Least Mean Square (LMS) algorithm [23]. In the famous LMS algorithm, the weights are moved along the negative of the gradient of the performance function. ANNs have high flexibility in their design and structure. The design parameters include the number of layers, number of neurons in each layer, type of transfer function, and the learning rule. The structure is critical to the ANN performance. For example, too many neurons results in a long training time and may also force the network to over fit the data while too few neurons may produce poor learning results.
All the ANNs examined in this study are two-layer feed-forward neural networks (one hidden and one output) that employ the Backpropagation algorithm. The logsigmoid function, which can approximate binary values, is used as the transfer function of the output layer. The networks receive as input the feature vector representing the input iris sample.
4.
RESULTS AND DISCUSSION
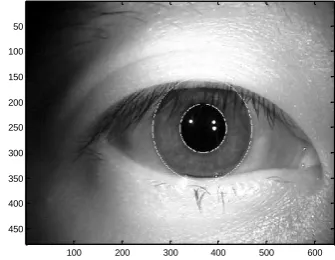
[image:5.595.323.535.297.464.2]In the first stage of the proposed system, the iris ring is isolated from the input eye image. Segmentation is achieved here using the Integro-differential operator. Fig. 10 shows a noisy iris detected by the proposed system. The figure shows circles overlaying the iris inner and outer borders.
Fig.10: segmentation of a noisy iris image
After the iris is extracted, it is preprocessed by first converting the image of the iris disk to a vector. For example, let the segmented iris region be defined by the matrix
. (2)
The corresponding iris vector is
x = [a11 a12 a13 a21 a22 a23] T
. (3)
The iris vector is transformed using the WPD transform whose approximation coefficients are then scanned using the proposed MWPD technique and sent to ANN. The detail coefficients are discarded as they carry a small portion of the signal energy. Since iris vectors have variable lengths depending on the input eye image and since all input vectors to an ANN must be of the same dimension, all iris vectors are forced to have the same length. This preprocessing is achieved here by truncating all iris vectors so that their lengths are equal to the length of the smallest iris vector belonging to the dataset under study. Fig. 11 depicts the lengths of the iris vectors in our dataset.
Fig. 11: lengths of the iris vectors for 7 classes with 20 irises per class.
Fig. 11 shows that the maximum and minimum lengths of the iris vectors are 34609 and 29510, respectively. Thus, the length of the input iris vector is first reduced to 29510 coefficients to produce the preprocessed vector n. The truncated iris vector is then scanned using the proposed MWPD technique depicted in Fig. 8.
[image:5.595.67.235.586.716.2]In the first experiment (Fig. 12) we test the classification error rate of the proposed MWPD system versus the wavelet decomposition level. The system employs the db1 wavelet and uses an ANN that consists of 10 neurons in the first layer. The output (second) layer has 7 neurons corresponding to the number of classes.
Fig.12: Percentage error rate for the MWPD system vs. decomposition level.
100 200 300 400 500 600
50
100
150
200
250
300
350
400
450
0 20 40 60 80 100 120 140
0 5,000 10,000 15,000 20,000 25,000 30,000 35,000
Iris number
N
u
m
b
e
r
o
f
c
o
e
ff
ic
ie
n
ts
6 7 8 9 10 11 12
0 1 2 3 4 5 6
Decomposition Level
C
la
ssi
fica
tio
n
E
rr
o
r
W3
W2
X1
X2
X3
∑
f
W1
a
y [image:5.595.329.525.641.742.2]
Fig. 12 shows that the classification error of the MWPD system is zero and occurs when the wavelet decomposition level is 10 (the threshold level, not shown, is 309.5). The figure also shows that the error rate of the MWPD system is less than 6 % for all decomposition levels.
[image:6.595.64.265.207.363.2]Next, we explore the effect of the threshold level on the performance of the proposed system. Fig. 13 exhibits the error rate of the MWPD system against threshold level. The system employs the same ANN design that was used in the previous experiment.
Fig. 13: Percentage error rate vs. threshold level for the MWPD system at a decomposition level of 10.
Fig. 13 shows that the MWPD system, when used at a decomposition level of 10 and a threshold value of 300, produces an error rate of 0.7 %. Fig. 13 also illustrates that the performance of the MWPD is significantly affected by the proper choice of threshold level indicating that the system should be properly tuned for the optimum threshold level for the application for which it is being used.
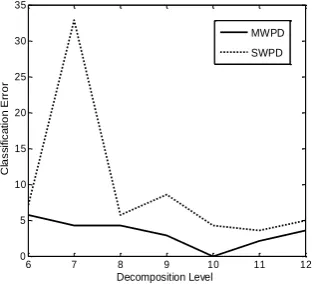
In the last experiment we prove the validity and robustness of the proposed system by comparing its performance to the standard system (SWPD). Fig. 14 shows the error rates of the MWPD and the SWPD systems as a function of decomposition levels.
Fig. 14: Error rates for the MWPD and SWPD systems versus decomposition level.
Fig. 14 illustrates that the MWPD system produces zero error at level 10 (and threshold value of 309.5) while the lowest error level of the standard system is 3.6 % and occurs at decomposition level of 11. The figure also shows that the
highest error rate of the proposed MWPD is 5.7% which occurs at decomposition level of 6. On the other hand the standard WPD system has a highest error rate of 32.7 % at a decomposition level of 7. Last, the figure shows that the percentage error rate of the MWPD system is always less than the SWPD system for all decomposition levels.
5.
CONCLUSION
Presented in this paper is a new approach to feature extraction based on the WPD transform. The proposed MWPD scanning technique scans the approximation coefficients of the WPD transform in a novel way that keeps track of the amplitudes and relative locations of certain high-amplitude approximation coefficients while discarding the rest of the transform coefficients. It is shown that approximation vectors of different classes have different peak values and locations. We exploit this characteristic of the WPD transform in order to obtain distinctive features through a novel scanning technique that preserves the values and relative locations of certain higher-magnitude approximation coefficients (positive and negative).
When tested on the iris recognition problem using the CASIA database and the ANN classifier, the proposed MWPD system produces zero classification error and always outperforms the standard WPD system. The proposed system has two parameters: decomposition level and threshold level. The optimum values of these parameters are investigated in this study.
In applying the MWPD technique to the iris recognition problem, the iris is first extracted from the input eye image using the integro-differential operator. The isolated iris disc is converted to a 1-D vector and then preprocessed so that all the iris vectors in the dataset are truncated to the same length. The preprocessed input iris vector is transformed using the 1-D WP1-D transform. The resulting approximation coefficients are scanned using the proposed MWPD method to produce the iris feature vector which is then introduced to an ANN for classification.
6.
REFERENCES
[1] R. Clarke, "Human identification in information systems: Management, challenges, and public policy issues," Information Technology & People, 7(4):6-37, 1994. [2] E. Newham,"the Biometric Report,"
<http://www.sjb.com/: SJB Services>, New York, 1995.
[3] Gross anatomy of the eye,
<http://webvision.med.utah.edu/anatomy.html>.
[4] CBSR, Center for biometrics and security research, <http://www.cbsr.ia.ac.cn/english/Databases.asp>, 2005.
[5] J. Daugman, "High confidence visual recognition of persons by a test of statistical independence," IEEE. Transactions on Pattern Analysis and Machine Intelligence, 15(11): 1148–1161, 1993.
[6] J. Daugman, "Statistical richness of visual phase information: update on recognizing persons by iris patterns," International Journal on Computer Vision, 45 (1): 25–38, 2001.
[7] J. Daugman, " Probing the uniqueness and randomness of Iris codes: results from 200 billion iris pair comparisons," Proc. IEEE, 94 (11):1927–1935, 2006.
[8] Cairo Amman bank, <http://www.cab.jo>. 0 1000 2000 3000 4000 5000 6000
0 10 20 30 40 50 60 70 80 90
Threshold Level
C
la
s
s
if
ic
a
ti
o
n
E
rr
o
r
6 7 8 9 10 11 12
0 5 10 15 20 25 30 35
Decomposition Level
C
la
s
s
if
ic
a
ti
o
n
E
rr
o
r
[image:6.595.63.222.545.687.2][9] H. B. kekre, S. D. Thepade, J. Jain and N. Agrawal, "IRIS recognition using texture features extracted from Haarlet pyramid", International Journal of Computer Applications, 11(12):1–5, 2010.
[10]A. M. Sarhan, "Iris recognition using the discrete cosine transform and artificial neural networks," Journal of Computer Science, 5(5):369–373, 2009.
[11]M. Vatsa, R. Singh, and P. Gupta, " Comparison of iris recognition algorithms," in International Conference on Intelligent Sensing and Information Processing, pp. 354– 358, 2004.
[12]H. Proenca and L. A. Alexandre, "Iris segmentation methodology for non-cooperative recognition," in IEEE Proceedings on Vision, Image and Signal Processing, vol. 153, pp. 199–205, April 2006.
[13]H. Proença, "An iris recognition approach through structural pattern analysis methods," Expert Systems, 27(3):146–155, 2010.
[14]P.J. Phillips, W.T. Scruggs, A.J. O’Toole, P.J. Flynn, K.W. Bowyer, C.L. Schott, and M. Sharpe, "FRVT 2006 and ICE 2006 large-scale results." Technical report, National Institute of Standards and Technology, NISTIR 7408 >, 2007. Available from: <http://iris.nist.gov/ice.
[15]R. W. Ives, D. A. Bishop, Y. Du, and C. Belcher, "Iris recognition: The consequences of image compression, " EURASIP Journal on Advances in Signal Processing, 2004(1):304–316, 2010.
[16]National Institute of Standards and Technology, Iris Challenge Evaluation, 2006. Available from :< http://iris.nist.gov/ICE>.
[17]IITD iris database,
<http://web.iitd.ac.in/biometrics/DatabaseIris.htm >, 2008.
[18]H. Proenca and L. A. Alexandre, "UBIRIS: a noisy iris image database," in 13thInternational Conference on Image Analysis and Processing (ICIAP2005), pp. 970– 977, 2005. Available from: <http://iris.di.ubi.pt>.
[19]Z. Wei, T. Tan, and Z. Sun, "Synthesis of large realistic Iris databases using patch-based sampling," Proc. Int. Conf. Pattern Recognition, pp.1–4, 2008.
[20]Palacky University iris database. Available from <http://www.advancedsourcecode.com/irisdatabase.asp>.
[21]P.V.C. Hough, "Machine Analysis of Bubble Chamber Pictures," Proc. Int. Conf. High Energy Accelerators and Instrumentation, 1959.
[22]R. O. Duda and P. E. Hart, "Use of the Hough Transformation to Detect Lines and Curves in Pictures," Communications of the ACM, 15:11–15, 1972.
![Fig. 1: Two views of the human iris [3].](https://thumb-us.123doks.com/thumbv2/123dok_us/8057381.775485/2.595.315.547.590.693/fig-views-human-iris.webp)