Estimating Speed of Vehicle using Centroid Method in
MATLAB
Pratishtha Gupta
Assistant Professor Banasthali University Jaipur, IndiaG N Purohit
Professor Banasthali University Jaipur, India
Manisha Rathore
M.Tech Scholar Banasthali University Jaipur, IndiaABSTRACT
Vehicle speed estimation is very important dimension for observing speed limitation law and observing traffic conditions within city. This document aims to present a new approach for finding speed of vehicle by using Centroid method technique. In this study, the captured traffic images are collected from a stationary camera mounted on a freeway or at the junctions. These images are used for calculating speed for a particular vehicle by calculating Centroid value of vehicle. Using Centroid value, distance traveled by vehicle is calculated. After finding distance covered by vehicle in specific time duration, speed of vehicle is calculated.
This approach is implemented in MATLAB by using image processing functions. Estimating speed of vehicle in traffic surveillance helps in preventing accidental cases, congestion control at junction and marinating traffic discipline within city.
General Terms
Digital Signal Processing toolbox, Computer vision System toolbox, Speed Estimation, CCTV
Keywords
Vehicle speed estimation, Centroid Method, MATLAB, Congestion, Traffic
1.
INTRODUCTION
People encounter more problems as road traffic becomes congested. Congestion is mainly due to less level of road capacity and inbuilt infrastructure. Due to congestion, many accidental problems occur. To reduce or minimize these problems, new approach has been developed for finding vehicle speed. Estimating vehicles speed helps in preventing these problems.
In this document an approach is developed for finding speed of vehicle using centroid method. In this study, the captured traffic images are collected from a stationary camera installed at freeway or junctions. The image taken from camera is converted into gray scale image. This gray scale image is divided into blocks. Same sized blocks are extracted from every succeeding column as well as from every succeeding row. The size of block should be similar to the size of template image. The template image is the image of vehicles which is matched with vehicle of input image to compute the centroid value of vehicle. Centroid of vehicle is calculated two times. Firstly, when vehicle is at one position say position A and after traversing distance, vehicle reaches at new position say position B. Centroid value has been calculated at both the positions. From these centroid values of vehicle, distance traversed by vehicle has been calculated using
distance formula. System time of camera is used to compute the duration in which vehicle cover the about distance.
2.
LITERATURE SURVEY
Rad A. G. et al. [1] presented a system by using video and image processing toolbox for calculating the speed of vehicle. Image has been taken from camera and camera was calibrated on geometrical equation. The result has average error of speed was +7km/h and -7km/h. this system is operated on different resolution images and video sequences.
Shedbalkar K. et al. [2] described a speed estimation technique based on extended kalman filter for permanent magnet synchronous. System is developed for estimating speed of motor. System is developed in MATLAB in SIMULINK model Blockset.
Leite A.V. et al. [3] proposed an approach for robust estimation of speed in induction motor sensor less control. Speed estimation method is based on extended kalman filter. This algorithm used reduce order state space model.
Kassen N. et al. [4] developed a reliable and strong vehicle speed estimation technique. This system guides the driver for driving condition and helps to avoid join traffic jam. This approach is based on RF. This system gives accuracy of 100% for speed estimation and with accuracy of 90% in typical streets.
Madasu V. K. et al. [5] presented a method for speed estimation of vehicle by tracking vehicles motion. The motion is tracked by using mathematical equation based on spherical projection. Motion tracking has been done using algorithm. Rahim H. A. et al. [6] estimated the vehicle velocity with the help of laser speed traps and Doppler radars. This method contains several steps image processing, centroid extraction and then tracking.
Barnwal S. et al. [7] developed a system for estimation of speed. This system is developed on the phenomenon of Doppler shift and the time at which vehicle come closest to the point of approach. The approach uses technique named seam carrying.
3.
TECHNIQUE USED
For calculation of centroid value, area of vehicle is calculated by using formula:
A=
-
)
This formula is used for the calculation of area of polygon. After calculation of area, centroid for particular polygon has been calculated by using formula:
=
+
) (
-
)
=
+
) (
-
)
After calculating centroid value at two position of vehicle, distance traversed by vehicle is calculated by using the distance formula:
D =
Speed is calculated by mathematical formula as given below:
Speed =
4.
PROPOSED METHODOLOGY
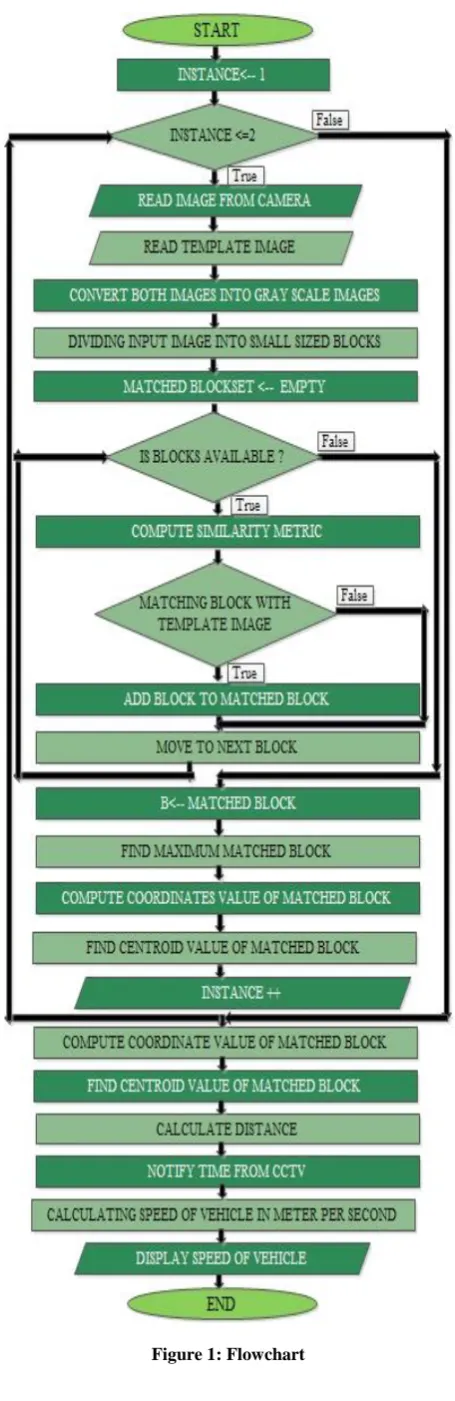
[image:2.595.314.542.66.768.2]The methodology used is shown in flowchart. The basic approach used is calculating centroid value from which distance has been estimated and speed of vehicle has been calculated.
5.
EXPERIMENT 1
This experiment has been done on real time images.
Step 1: Image from camera
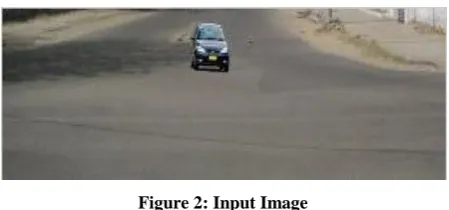
[image:3.595.55.280.146.251.2]Images captured from CCTV camera, installed at junction or freeway has been used as input image. Input image is shown in figure 2
Figure 2: Input Image
Step 2: Read Template Image
[image:3.595.95.242.309.422.2]Images of individual vehicle are stored in database. From database, read template images of vehicle. For Experiment template is shown in figure 3.
Figure 3: Template image
Step 3: Convert into Gray Scale
[image:3.595.83.252.543.697.2]Both the input image and template image has been converted into gray scale images. Gray scale images give better result on comparison. Gray scale images are shown in figure 4 and 5.
Figure 4: Gray Scale image of input image
Figure 5: Gray Scale image of Template image
Step 4: Dividing into blocks
Input image is divided into blocks. Same sized blocks are extracted from every succeeding column as well as from every succeeding row. Each block has size similar to the template image.
Step 5: Matching of blocks
Template image is matched with each individual block. Matching has been done by using co-relation function with matching factor as .9. If both matched, information about matched block has been retrieved.
Step 6: Compute coordinates value of matched block
After matching of block, coordinates value of matched block has been calculated. Block is in rectangular shape so that four coordinates has been calculated. First and second coordinates have been calculated by finding the starting and ending coordinate of block in first row. Next two coordinates have been calculated by adding the size of block to that coordinates.
TABLE I. CO-ORDINATE VALUES
Coordinates Values Coordinates Values
X1 150 Y1 9
X2 182 Y2 9
X3 182 Y3 40
X4 150 Y4 40
Step 7: Compute centroid value
Centroid value of matched block has been calculated. Before calculating centroid value, area of block has been calculated. Area is calculated by using formula:
A=
-
)
After calculating area, centroid value along x-axis and y-axis has been calculated using following formula.
=
+
) (
-
)
=
+
) (
-
)
TABLE II. Centroid Value
Extent Centroid value
166 24.5
Step 8: Read vehicle image after traveling distance
[image:3.595.317.546.667.754.2]Step 9: Converted into Gray scale
[image:4.595.55.277.137.237.2]Image has been converted into gray scale for comparison. Image has been divided into blocks. Again blocks are matched with template image and information about most matched block has been retrieved.
Figure 7: Gray scale image of figure 6.
Step 10: Compute coordinates value of matched block
After traveling distance, coordinates value for matched blocks have been calculated. Coordinates value is calculated as step no 6.
TABLE III. Co-Ordinate Values
Coordinates Values Coordinates Values
X1 154 Y1 69
X2 186 Y2 69
X3 186 Y3 100
X4 154 Y4 100
Step 11: Compute centroid value
Centroid value has been calculated similarly as step no 7. Initially, area has been calculated for block then centroid value has been calculated.
TABLE IV. Centroid Value
Extent Centroid value
170 84.5
Step 12: Calculating distance
Distance traveled by vehicle in horizontal or vertical direction, calculated by using distance formula. This formula has been applied on centroid coordinates for two most matched blocks with template image. Distance formula is given by:
D =
Step 13: Notify time from CCTV camera
Time taken by vehicle to travel distance is notified from CCTV camera.
Step 14: Calculating speed of vehicle
Speed of vehicle has been estimated by distance traveled by vehicle in particular instant of time. Speed is calculated by using mathematical concept of speed, time and distance. It is given by:
Speed =
Figure 8: Result of Experiment 1
6.
EXPERIMENT 2
Step 1: Image from camera
Figure 9: Input Image
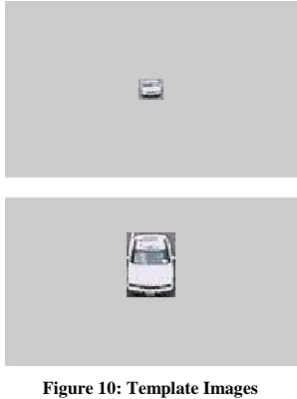
[image:4.595.353.502.349.549.2]Step 2: Read Template Image
Figure 10: Template Images
[image:4.595.354.506.570.671.2]Step 3: Convert into Gray Scale
Figure 12: Gray scale images of template images
Step 4: Dividing into blocks Step 5: Matching of blocks
Step 6: Compute coordinates value of matched block
TABLE V. Co-Ordinate Values
Coordinates Values Coordinates Values
X1 97 Y1 47
X2 143 Y2 47
X3 143 Y3 77
X4 97 Y4 77
Step 7: Compute centroid value
TABLE VI. Centroid Value
Extent Centroid value
120 62
Step 8: Read vehicle image after traveling distance
Figure 13: Vehicle image after traveling distance
[image:5.595.349.509.73.192.2]Step 9: Converted into Gray scale
Figure 14: Gray Scale image of figure13
Step 10: Compute coordinates value of matched block
TABLE VII. Co-Ordinate Values
Coordinates Values Coordinates Values
X1 106 Y1 3
X2 120 Y2 3
X3 120 Y3 45
X4 106 Y4 45
Step 11: Compute centroid value
TABLE VIII. Centroid Value
Extent Centroid value
113 10.22
Step 12: Calculating distance
[image:5.595.88.245.563.663.2]Step 13: Notify time from CCTV camera Step 14: Calculating speed of vehicle
Figure 15: Result of experiment 2
7.
EXPERIMENT 3
Step 1: Image from camera
Step 2: Read Template Image
Figure 17: Template Image
Step 3: Convert into Gray Scale
Figure 18: Gray scale image of input image
Figure 19: Gray Scale image of Template Image
Step 4: Dividing into blocks Step 5: Matching of blocks
Step 6: Compute coordinates value of matched block
TABLE IX. Co-Ordinate Values
Coordinates Values Coordinates Values
X1 51 Y1 53
X2 77 Y2 53
X3 77 Y3 82
X4 51 Y4 82
Step 7: Compute centroid value
TABLE X. Centroid Value
Extent Centroid value
64 67.5
Step 8: Read vehicle image after traveling distance
Figure 20: Vehicle image after traveling distance
Step 9: Converted into Gray scale
Figure 21: Gray Scale image of figure20
Step 10: Compute coordinates value of matched block
TABLE XI. Co-Ordinate Values
Coordinates Values Coordinates Values
X1 97 Y1 15
X2 113 Y2 15
X3 113 Y3 72
X4 97 Y4 72
Step 11: Compute centroid value
TABLE XII. Centroid Value
Extent Centroid value
105 52.61
Step 12: Calculating distance
Step 13: Notify time from CCTV camera Step 14: Calculating speed of vehicle
8.
EXPERIMENT 4
[image:7.595.347.511.73.174.2]Step 1: Image from camera
Figure 22: Input image
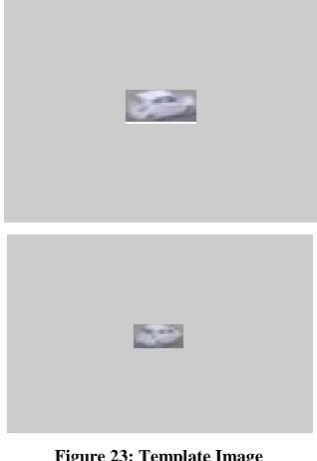
[image:7.595.87.248.111.228.2]Step 2: Read Template Image
Figure 23: Template Image
Step 3: Convert into Gray Scale
[image:7.595.87.246.263.494.2]Figure 24: Gray scale image of input image
Figure 25: Gray Scale image of Template Image
Step 4: Dividing into blocks Step 5: Matching of blocks
Step 6: Compute coordinates value of matched block
TABLE XIII. Co-Ordinate Values
Coordinates Values Coordinates Values
X1 0 Y1 0
X2 22 Y2 0
X3 22 Y3 46
X4 0 Y4 46
Step 7: Compute centroid value
TABLE XIV. Centroid Value
Extent Centroid value
11 23
Step 8: Read vehicle image after traveling distance
Figure 26: Vehicle image after traveling distance
Step 9: Converted into Gray scale
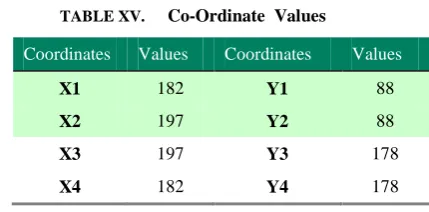
[image:7.595.352.507.475.586.2] [image:7.595.86.247.516.629.2] [image:7.595.354.505.627.741.2]Step 10: Compute coordinates value of matched block
TABLE XV. Co-Ordinate Values
Coordinates Values Coordinates Values
X1 182 Y1 88
X2 197 Y2 88
X3 197 Y3 178
X4 182 Y4 178
Step 11: Compute centroid value
TABLE XVI. Centroid Value
Extent Centroid value
189.5 177.42
Step 12: Calculating distance
Step 13: Notify time from CCTV camera Step 14: Calculating speed of vehicle
Figure 28: Result of experiment 2
9.
RESULT
The result of estimation of vehicle speed using centroid method is shown in table 17.Four real time images are experimented and results are notified according to accuracy in percentage.
TABLE XVII. Centroid Value
Experiments Distance
( meters)
Speed
(m/s)
Experiment 1 60.133 2.7333
Experiment 2 50.245 2.3748
Experiment 3 43.6183 1.9826
Experiment 4 236.02 1.966
Accuracy % 100 99.01
10.
CONCLUSION
An efficient image processing approach has been suggested and analyzed for estimation of speed of vehicle using centroid method. From analysis, conclude that images in which vehicle travel in vertical direction gives result with accuracy 98% to 99%. The reason behind this is vehicle coming from far distance looks in small size but as it covers distance in vertical direction size of vehicle increases, two template images are needed for matching of vehicle and accuracy decreases. The images in which vehicle moving in horizontal direction, size of vehicle remains constant and accuracy is almost 100%.
11.
FUTURE SCOPE
Many of the system have been developed till date but no one is best suitable according to efficiency, reliability and accuracy. The above developed system can be extended on SIMULINK Blockset in MATLAB and simulated for better efficiency and accuracy. After implementing on SIMULINK Blockset, it can be implemented on hardware using HDL code generation in MATLAB.
8. REFERENCES
[1] A G Rad, A Dehghani and M R Karim,” Vehicle speed detection in video image sequences using CVS method”, International Journal of Physical and Science, Vol. 5(17), pp. 2555-2563, 18 December, 2010
[2] K Shedbalkar, A P Dhamangaonkar and A B Patil,” Speed estimation using extended Kalman filter for PMSM”, IEEE conference on Emerging Trends in Electrical Engineering and Energy Management (ICETEEEM), 2012,pp-433 to 435
[3] A V Leite, R E Araujo and D Freitas ,” A new approach for speed estimation in induction motor drives based on a reduced-order extended Kalman filter”, IEEE International Symposium on Industrial Electronics, vol-2, 2004, pp-1221-1226
[4] N Kassem, A. E. Kosba and M Youssef,” RF-Based Vehicle Detection and Speed Estimation “, IEEE 75th
conference on Vehicular Technology, pp-1-5
[5] V. K. Madasu and M. Hanmandlu,” Estimation of vehicle speed by motion tracking on image sequences”, Intelligent Vehicles Symposium, 2010 IEEE, pp 185 – 190
[6] H. A. Rahim, R. B. Ahmad, A. S. M. Zain and U. U. Sheikh,” An adapted point based tracking for vehicle speed estimation in linear spacing “, IEEE International conference on Computer and Communication Engineering (ICCCE), 2010, pp 1-4.