http://dx.doi.org/10.4236/wjet.2015.33C011
Robust Design of Mixing Static and Dynamic
Multiple Quality Characteristics
Ful-Chiang Wu
Department of Hotel Management, Vanung University, Chung-Li, Tao-Yuan, Taiwan, China Email: [email protected]
Received 31 July 2015; accepted 15 October 2015; published 22 October 2015
Abstract
Increased market competition means that quality, cost and delivery time are crucial elements of modern production techniques. Taguchi’s robust design is the most powerful method available for reducing product cost, improving quality, and simultaneously reducing development time. Robust design aims to reduce the impact of noise on the product or process quality and leads to greater customer satisfaction and higher operational performance. The objective of robust design is to minimize the total quality loss in products or processes. The PQL model proposed by this paper simultaneously optimizes the static and dynamic problems by minimizing the total quality loss. Using the proposed PQL model and steps for optimization, the method addresses complex para-meter design, which varies with the properties and objectives of the experimental data, to im-prove the product quality. The example of an electron beam surface hardening process is provided to demonstrate the implementation and usefulness of the proposed method.
Keywords
Robust Design, Quality Characteristic, Quality Loss Function, SN Ratio, PQL
1. Introduction
Quality, cost and delivery time are the main production elements of the modern products due to the stringent market competitiveness. Taguchi’s robust design [1] is the most powerful method available to reduce product cost, improve quality, and simultaneously reduce development interval. The Taguchi method has been widely applied to optimize the industrial parameter design including static and dynamic problems. The static problem is defined so that the desired output of system has a fixed target. In the dynamic problem, the desired output of the system depends on the signal factor setting, that is, the dynamic system is the one without a single target but a response, which is a function of a signal. The optimization involves determining the best control factor levels so that the output is at the target or desired value to minimize the total quality loss.
In this paper, we propose a PQL index to convert the multiple quality characteristics into a single characteris-tic problem by minimizing the total PQL value to obtain the optimal parameter conditions.
2. Quality Loss Function and SN Ratio
The quality characteristics can be divided three types according to the target of problem: (1) the smaller-the- better (STB) type for static system; (2) the larger-the-better (LTB) type for static system; and (3) the nominal- the-best (NTB) type, which can be classified as static system and dynamic system.
Taguchi [1] proposed the SN ratio (η) as the quality evaluation based on the quadratic average quality loss function L y
( )
. Taguchi defined the SN ratio as( )
( )
(
)
2 1 2 1 2 2 2 0 2 2 0 2 110 log STB (static)
1
10 log 1 LTB (static)
10 log ( )
10 log NTB (static)
10 log NTB (dynamic)
n i i n i i e K y n K y n L y
K m s y
K η β σ β = = − ⋅ ⋅ − ⋅ ⋅ = − ⋅ = − ⋅ ⋅ ⋅ − ⋅ ⋅
∑
∑
(1) whereK = the loss coefficient (constant)
y = a measurable statistic of quality characteristic m0 = the target value for static NTB quality characteristic
y = the sample mean of n units 2
s = the sample variance of n units
β0 = the slope of ideal function for dynamic NTB quality characteristic β= the estimated slope of regression for dynamic NTB quality characteristic
2 e
σ = the error variance of regression for dynamic NTB quality characteristic
The loss coefficient K, m0 and β0 in L y( ) are generally ignored because they have no effect on the optimiza-tion for a single quality characteristic. In multiple quality characteristics problems, the loss coefficient K plays a major role in optimal parameter settings to make trade-offs among characteristics. Since log is a monotone func-tion, minimizing L y( ) is equivalent to maximizing η.
3. Robust Design Model
The analysis of means (ANOM) is used to determine the optimal factor levels in robust design. The ANOM is used for estimating the main effects of each parameter, and the effect of a factor level is the deviation it causes from the overall mean response. Let
η
i j, be the average SN ratio value for the jth level of factor Xi,η
i,0 be average SN ratio value for the starting conditions of Xi and T be the total average SN ratio value. The effect ofthe jth level of Xi is defined as
, ,
i j T i j
η
− =δ
(2)Suppose there are q control factors, X=
(
X X1, 2,,Xq)
, in the experiment for a single quality characteristic.The effects of SN ratios for some parameter conditions and starting conditions are (
1 2
1,j, 2,j, , q j,q
δ
δ
δ
) and (δ δ1,0, 2,0,,δq,0), respectively. Then, the estimated SN ratio values are presented as follows respectively.1 2
1,j 2,j q j,q T
η= +δ +δ + + δ (3)
0 T 1,0 2,0 q,0
η
= +δ
+δ
+ +δ
(4)The relationship between (
1 2
1,j, 2,j , , q j,q
δ
δ
δ
) and (δ δ1,0, 2,0,,δq,0) is expressed as(
,) (
,0)
, ,0, ,0= i j i = i j i
i j j T T
Let L be the quality loss for the some parameter conditions and L0 be the quality loss for the starting condi-tions. The ratio of L to L0 (proportion of quality loss, PQL) is defined as.
( 0)
0 10 10 10 0 10 PQL 10 10 L K L K η η η η − − − − ⋅ = = = ⋅
X (6)
Consider the effect of each factor in PQLX with corresponding starting PQLηi ji, , equation (6) can be
re-written as
(
1,1 2,2 ,)
(1,0 2,0 ,0)(
, ,0)
(
, ,0)
,
10 10 10
1 1 1
PQL 10 j j q jq q 10 i ji i 10 i j i PQL
i ji
q q q
i i i
δ δ δ δ δ δ δ δ η η
η
− + + + − + + + − − − −
= = =
= =
∏
=∏
=∏
X (7)
Therefore, the optimal parameter conditions
(
1 , 2 , ,)
opt opt opt opt = X X XqX are minimizing the quality loss
( )
L Y . That is,
,
1
PQL opt : PQL
i ji q i Min η = =
∏
X (8)
( )
0 PQL optL Y =L ⋅ X (9)
Suppose a product or process has p quality characteristics Y=
(
Y Y1, 2,,Yp)
. Let L( )
Y =(
L1,0,L2,0,,Lp,0)
be the average quality loss and
µ
η=(
η η
1,0, 2,0,,η
p,0)
be the predicted SN ratio under the starting conditions. Therefore, the optimization robust design of multiple quality characteristics are the parameter conditions,(
1opt, 2opt, , opt)
opt = X X Xq
X , by minimizing total quality loss. That is,
( )
01
: i PQL opt
p
i
Min L L
=
=
∑
⋅ XY (10)
If the real quality loss of starting conditions, L
( )
Y =(
L1,0,L2,0,,Lp,0)
, can not be obtained, we can take the quality loss Lj of quality characteristic Yjas the base to find the proportion of quality loss Li of qualitycharacte-ristic Yi to Yj. Hence, the proportion fi j, is expressed as
0 0 10 , 10 10 10 i j
i i i i
i j
j j j j
L K MSD K
f
L K MSD K
η η − − ⋅ ⋅ = = =
⋅ ⋅ , i=1, 2,,p (11)
Therefore, Equation (10) can be rewritten as
( )
,1
: PQL opt
p
i j i
Min L f
=
=
∑
⋅ XY (12)
To solve the multiple quality characteristics problems, an optimization procedure is proposed as follows. Step 1. Compute the SN ratio for each quality characteristic and then calculate the main effect of factors for each quality characteristic.
Step 2. Estimate the average SN ratio (η0) under the starting conditions for each quality characteristic. Step 3. Transform the SN ratios into PQL for each quality characteristic.
Step 4. Estimate the quality loss of starting conditions for each quality characteristic and then program a search module by EXCEL VBA to obtain the optimal parameter conditions.
4. Implementation
High energy electron beam is a unique tool for case hardening. The control factors are substrate matrix (factor A), travel speed (factor B), accelerating voltage (factor C), electrical current (factor D), melted width (factor E), beam oscillation (factor F) and post-heat treatment temperature (factor G). The signal factor is electron beam scanning width (factor M). The levels of control and signal factors are listed in Table 1.
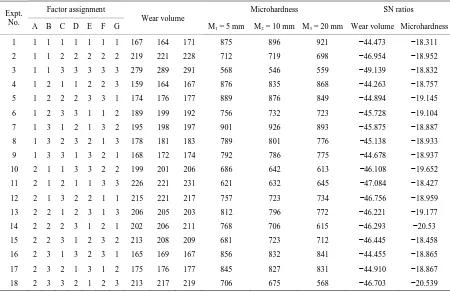
There are two quality characteristics for the process. The first is wear volume (STB type) and the second is microhardness (dynamic type). A L18 orthogonal array is built and the assignment of controls, signal factor, ex-perimental data and the computed SN ratios (η) for all quality characteristics are shown in Table 2.
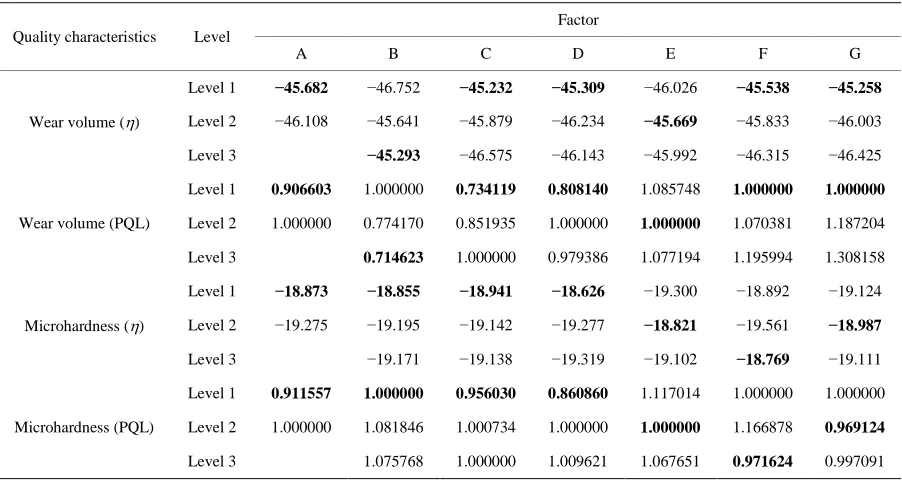
[image:4.595.88.537.244.391.2]The main effect of factors and PQL values for each quality characteristic are shown in Table 3, respectively. Suppose that the quality loss of starting levels for wear volume and microhardness are L1 and L2 respectively. The region of L L2 1 corresponding to the optimal parameter conditions using Equations (7), (8) and (12)] are listed in Table 4.
Table 1. Levels of control and signal factors for electron beam surface hardening process.
Control factor Levels
1 2 3
A. Substrate matrix Ductile Gray
B. Travel speed, mm∙s−1 10 20 30
C. Accelerating voltage, V 10 25 50 D. Electrical current, mA 10 15 20 E. Melted width, mm 5 15 20 F. Beam oscillation Line Circle Ellipse G. Post-heat treatment temperature, ˚C 25 150 300 Signal factor
M. Electron beam scanning width 5 mm 10 mm 20 mm
a. Starting levels are identified by underscore.
Table 2. Experimental data.
Expt. No.
Factor assignment
Wear volume
Microhardness SN ratios
A B C D E F G M1 = 5 mm M2 = 10 mm M3 = 20 mm Wear volume Microhardness
[image:4.595.88.538.429.721.2]Table 3. Summary of factor effects for wear volume and microhardness (η and PQL).
Quality characteristics Level
Factor
A B C D E F G
Wear volume (η)
Level 1 −45.682 −46.752 −45.232 −45.309 −46.026 −45.538 −45.258 Level 2 −46.108 −45.641 −45.879 −46.234 −45.669 −45.833 −46.003 Level 3 −45.293 −46.575 −46.143 −45.992 −46.315 −46.425
Wear volume (PQL)
Level 1 0.906603 1.000000 0.734119 0.808140 1.085748 1.000000 1.000000
Level 2 1.000000 0.774170 0.851935 1.000000 1.000000 1.070381 1.187204 Level 3 0.714623 1.000000 0.979386 1.077194 1.195994 1.308158
Microhardness (η)
Level 1 −18.873 −18.855 −18.941 −18.626 −19.300 −18.892 −19.124 Level 2 −19.275 −19.195 −19.142 −19.277 −18.821 −19.561 −18.987 Level 3 −19.171 −19.138 −19.319 −19.102 −18.769 −19.111
Microhardness (PQL)
Level 1 0.911557 1.000000 0.956030 0.860860 1.117014 1.000000 1.000000 Level 2 1.000000 1.081846 1.000734 1.000000 1.000000 1.166878 0.969124
Level 3 1.075768 1.000000 1.009621 1.067651 0.971624 0.997091 a. Optimal parameter levels for each characteristic are identified by boldface type.
Table 4. The region of L1/L2 and optimal parameter conditions.
Region optimal parameter conditions
Predicted SN ratio
Wear volume Microhardness
2 1 2.700
L L ≤ A1B3C1D1E2F1G1 −42.609 db −18.005 db 2 1
2.700<L L ≤4.346 A1B1C1D1E2F1G1 −44.068 db −17.689 db 2 1
4.346<L L ≤6.066 A1B1C1D1E2F1G2 −44.814 db −17.551 db 2 1
6.066<L L A1B1C1D1E2F3G2 −45.591 db −17.429 db
5. Conclusion
Robust design is used to determine the optimal levels for the control factors in a product or process so that the quality loss is minimized. A real problem in a product or process usually has multiple quality characteristics. This paper presents an effective method based on Taguchi’s quality loss function and SN ratio to simultaneously optimize the robust design involving both static and dynamic quality characteristics. Using the PQL transformed from the factor effects of SN ratios as the quality evaluation, we can convert the static and dynamic multiple quality characteristics into a single characteristic problem to obtain the optimal parameter conditions by mini-mizing the total PQL value. The implementation and effectiveness of the proposed approach is illustrated through case study.
Acknowledgements
This research was financially supported by Ministry of Science and Technology (Republic of China) under Con-tract MOST 104-2221-E-238-003.
References
[1] Taguchi, G. (1991) System of Experimental Design: Vol. 1 and Vol. 2. American Suppliers Institute, Dearborn.
[image:5.595.94.535.384.486.2]Technology, 12, 214-219.
[3] Elsayed, E.A. and Chen, A. (1993) Optimal Levels of Process Parameters for Products with Multiple Characteristics.
International Journal of Production Research, 31, 1117-1132. http://dx.doi.org/10.1080/00207549308956778
[4] Khuri, A.I. and Conlon, M. (1981) Simultaneous Optimization of Multiple Responses Represented by Polynomial
Re-gression Functions. Technometrics, 23, 363-375. http://dx.doi.org/10.2307/1268226
[5] Jean, M.D. and Tzeng, Y.F. (2003) Use of Taguchi Methods and Multiple Regression Analysis for Optimal Process
Development of High Energy Electron Beam Case Hardening of Cast Iron. Surface Engineering, 19, 150-156.
http://dx.doi.org/10.1179/026708403225002496
[6] Jean, M.D. and Tzeng, Y.F. (2004) Optimisation of Electron-beam Surface Hardening of Cast Iron for High Wear
Re-sistance Using Taguchi Method. International Journal of Advanced Manufacturing Technology, 24, 190-198.
http://dx.doi.org/10.1007/s00170-002-1481-1
[7] Lesperance, M.L. and Park, S.M. (2003) GLMs for the Analysis of Robust Designs with Dynamic Characteristics.
Journal of Quality Technology, 35, 253-263.
[8] Nair, V.N., Taam, W. and Ye, K.Q. (2002) Analysis of Functional Responses from Robust Design Studies. Journal of
Quality Technology, 34, 355-370.
[9] Wu, F.-C. (2007) Sequential Optimization of Parameter and Tolerance Design for Multiple Dynamic Quality
Characte-ristics. International Journal of Production Research, 45, 2939-2954. http://dx.doi.org/10.1080/00207540600690719
[10] Jean, M.D. and Tzeng, Y.F. (2003) Robust Design of Electron Beam Surface Hardening Process Using Taguchi
Dy-namic Experiment. Journal of Materials Science and Engineering, 35, 207-216.
[11] Jean, M.D. (2004) Characteristic Optimisation of Dynamic Process Parameters in Rapid Solidified Treatment. Science