Georgia State University Georgia State University
ScholarWorks @ Georgia State University
ScholarWorks @ Georgia State University
Public Health Theses School of Public Health
Fall 12-20-2012
An Examination of Secondhand Smoke in a Sample of Atlanta
An Examination of Secondhand Smoke in a Sample of Atlanta
Hospitality Venues and Their Compliance with the Georgia
Hospitality Venues and Their Compliance with the Georgia
Smokefree Air Act
Smokefree Air Act
Eli W. Nachamkin Institute of Public Health
Follow this and additional works at: https://scholarworks.gsu.edu/iph_theses
Recommended Citation Recommended Citation
Nachamkin, Eli W., "An Examination of Secondhand Smoke in a Sample of Atlanta Hospitality Venues and Their Compliance with the Georgia Smokefree Air Act." Thesis, Georgia State University, 2012.
https://scholarworks.gsu.edu/iph_theses/242
1
An Examination of Secondhand Smoke in
a Sample of Atlanta Hospitality Venues
and Their Compliance with the Georgia
Smokefree Air Act
By
Eli Nachamkin
Bachelor of Science in Environmental Health
University of Georgia
A Thesis Submitted to the Graduate Faculty of Georgia State University in Partial Fulfillment of the Requirements for the Degree
MASTER OF PUBLIC HEALTH
2
Approval Page
An Examination of Secondhand Smoke in a Sample of Atlanta Hospitality Venues and Their Compliance with the Georgia Smokefree Air Act
By Eli Nachamkin
Approved
______________________________
Committee Chair
______________________________
Committee Member
_______________________________
Committee Member
3
Acknowledgements
I would like to express gratitude to Dr. Sheryl Strasser, my advisor, for her guidance throughout my MPH degree and especially during my thesis writing. She aided me in my topic selection and continuously provided the support needed to complete this thesis.
Also, I would like to thank Megan Smith for her help during my thesis writing. She was always available to answer my questions and provide excellent input.
A special thanks to Courtney Burton for her support throughout this process. She was always available when I needed to discuss my MPH progress and always guided me in the right direction.
I would also like to acknowledge the faculty and staff of the Georgia State University’s Institute of Public Health for providing me with a wonderful education over the years.
4
Author’s Statement Page
In presenting this thesis as a partial fulfillment of the requirements for an advanced degree from Georgia State University, I agree that the Library of the University shall make it available for inspection and circulation in accordance with its
regulations governing materials of this type. I agree that permission to quote from, to copy from, or to publish this thesis may be granted by the author or, in her absence, by the professor under whose direction it was written, or in his absence, by the Associate Dean, College of Health and Human Sciences. Such quoting, copying, or publishing must be solely for scholarly purposes and will not involve any potential financial gain. It is understood that any copying from or publication of this dissertation which involves potential financial gain will not be allowed without written permission of the author.
Signed by:
Eli Nachamkin
5 ABSTRACT
Introduction: Despite the known consequences of cigarette smoking, almost 20% of adults in the United States smoke. Smoking has been shown to harm nearly every organ of the body. Its detrimental effects have been seen not only in smokers themselves but also in those exposed to secondhand smoke (SHS) at work and in other public places.
Methodology: The purpose of this thesis was to examine compliance with the signage
requirement of the Georgia Smokefree Air Act (GSAA) of 2005 among 99 hospitality venues located in Atlanta. Photographs of bars and restaurant entrances were taken and raters then classified each venue as compliant or non-compliant with smoking status signage requirements of the GSAA. Additionally, air samples were collected using Sidepak equipment from 59 venues in order to estimate the PM2.5 levels, which is a recognized measure of air quality. With
Spearman’s rho correlation coefficient (r), analyses were run to determine correlations between signage compliance, number of cigarettes being smoked, and smoking permitted with air quality (PM2.5). Analyses were conducted using the Statistical Package for Social Sciences (SPSS) version 19.
Results: Of the 99 venues assessed, only 21 (21.2 %) complied with the signage requirements of the GSAA. Venues that do adhere to signage requirements and indicate no smoking on their signs and at the same time via telephone stated that smoking is prohibited had the lowest PM2.5 levels =15.03. On the contrary, those venues that display signs permitting smoking and via telephone indicated smoking is allowed had the highest PM2.5 levels =230.31. It was
determined that there is a strong positive correlation between PM2.5 and “number of cigarettes” (r=.611, n=59, p<.001) as well as moderate correlation between PM2.5 and “smoking permitted” as indicated from phone calls (r=.464, n=59, p<.001). However, analysis showed a weak correlation between PM2.5 and “signage compliance” in accordance with GSAA (r=.107, n=59, p>.001).
6
TABLE OF CONTENTS
Chapter 1: Introduction
1.1: Background………...……9
1.2: Purpose of the Study………...…....10
1.3: Research Questions ………....10
Chapter 2: Literature Review 2.1: Secondhand Smoke………...………..12
2.2: Studies……….14
2.3: RSP Discussion………...………17
2.4: Policies………18
2.5: Particulate Matter………21
Chapter 3: Methods and Procedures 3.1 Study Population………..24
3.2 Venue Photographs………...………...24
3.3 Data Collection and Training………...25
3.4 Statistical Analysis………...27
Chapter 4: Results 4.1 Data Collection Results………28
4.2 Statistical Analysis Results………..31
Chapter 5: Conclusions ……….34
References………..38
7
LIST OF TABLES
Table 1: Atlanta Bars Air Sample Data Set Example………27
Table 2: Comparing Smoking vs. Non-Smoking Venues and their PM2.5 levels..………....29
Table 3: Tests of Normality………...………31
Table 4: Spearman’s rho Correlation……..……….………..32
Table 5: Atlanta Venue Photographic Compliance………..….…...Appendix A, 41
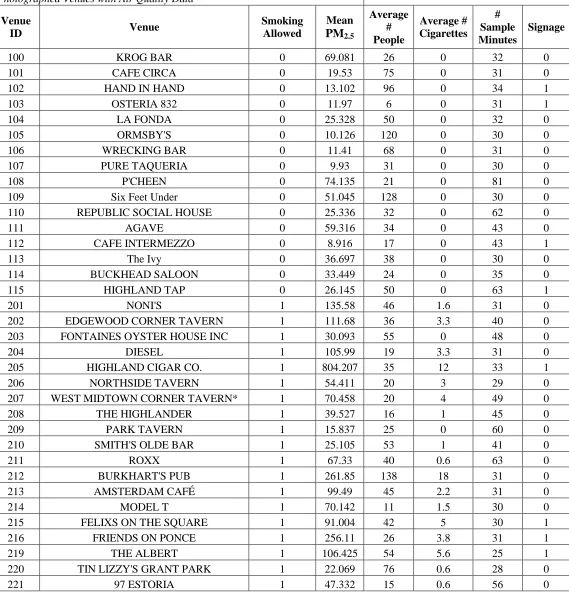
Table 6: Photographed Venues with Air Quality Data………...……….Appendix A, 44
Table 7: Comparing Mean PM2.5 Levels of Signage Compliant Venues: Smoking vs.
8
LIST OF FIGURES
Figure 1: How Big is Particulate Matter2.5………..………….21
Figure 2: Air Quality Index Values………..….……...22
Figure 3: Field Note Template Completed at Each Venue………..……….……26
Figure 4: Flow Chart of Compliance of Signage and Calls.………...30
9 CHAPTER 1
Introduction
1.1: Background
Despite the known health consequences of smoking, an estimated 45.3 million people or
19.3% of all adults over the age of 18, still smoke in the United States (Centers for Disease
Control and Prevention, 2012). The Georgia statistics closely mimic those of the United States
with 19.5% of all Georgians over the age of 18 still smoking (CDC, 2011). That means
1,393,000 Georgian citizens are risking their health and the health of those around them every
day. Out of the 50 states, Georgia ranks 32nd for percent of the population still smoking.
There are a myriad of health consequences as a result of smoking and numerous public
agencies have worked to educate the public on the adverse effects of smoking, yet tobacco use
remains the leading preventable cause of disease and death in the United States. It causes about
440,000 deaths each year and costs the country about $157 billion in health related losses each
year (United States Department of Health and Human Services, 2011). Nationally, smoking
causes greater than 5.6 million years of potential life lost each year. In Georgia, during the years
2000-2004, over 10,500 adults aged 35 and older died as a result of tobacco use each year (CDC,
10
Smoking has been shown to harm nearly every organ of the body (DHHS, 2011). In
terms of specific health related consequences, smoking is estimated to increase the risk of
coronary heart disease and stroke by two to four times. It increases the odds of a man developing
lung cancer by twenty-three times and it increases a woman’s chance of developing lung cancer
by thirteen times. It also increases the chances of dying from chronic obstructive pulmonary
disease (COPD), including bronchitis and emphysema by twelve to thirteen times (CDC, 2011).
Additionally, smoking has also been directly associated with a number of other cancers,
including esophageal, bladder, cervical, kidney, larynx, throat, pancreatic, and stomach (DHHS,
2011).
The health effects of smoking are not only seen in the adult population. Cigarette
smoking during childhood and adolescence has been shown to cause significant health problems
to young people including increased incidence and severity of respiratory illness, increased
incidence of cough, a worse cholesterol profile, decreased physical fitness, and possible
decreased lung growth and function (Repace & Lowrey, 1982).
1.2 Purpose of the study
The purpose of this thesis is to examine the relationships between indoor air quality and
compliance with Georgia Smokefree Air Act.
1.3 Research Questions
11
2. Is signage compliance correlated with PM2.5 levels in venues?
3. How does number of cigarettes burning associate with PM2.5 levels?
12 CHAPTER II
Secondhand Smoke and Literature Review
2.1Secondhand Smoke
Secondhand smoke (SHS), also known as environmental tobacco smoke (ETS), is the
only agent ever classified by the EPA as a known human carcinogen for which an increased risk
has actually been observed at typical environmental levels of exposure (Brownson, Eriksen,
Davis & Warner, 1997).
Smokers themselves are not the only ones affected by cigarette smoke. Secondhand
smoke is a mixture of the smoke given off by burning the end of a cigarette, pipe, or cigar, and
the smoke exhaled by smokers (United States Environmental Protection Agency, 2011).
Secondhand smoke contains more than four thousand substances, many of which are known to
be toxic substances, hazardous air pollutants, and carcinogens to humans and animals (Brownson
et al., 1997; EPA, 2011). Secondhand smoke causes serious health effects to children and adults.
Because children are still developing, have increased rates of respiration, and have less control
over their environments, they are at increased risk of detrimental effects of secondhand smoke.
The more a child is exposed to SHS, the greater their risk of suffering serious health
consequences. Ninety percentof children are exposed to secondhand smoke as a result of their
13
attacks, worsening the severity of asthma symptoms, increasing the risk of sudden infant death
syndrome, increasing the risk of lower respiratory infections including pneumonia, increasing the
incidence of middle ear infections, and decreasing lung function. Secondhand smoke is the third
leading preventable health hazard following active smoking and alcohol (American Cancer
Society, 2012). It is responsible for 50,000 deaths a year in the United States.
Adults are also affected by smoking even if they do not smoke. Exposure to SHS has
been shown to cause lung cancer in non-smoking adults (EPA, 2011). Approximately 3,000 lung
cancer deaths per year are seen in non-smokers as a result of SHS. Environmental tobacco smoke
also has significant effects on the respiratory health of nonsmokers, including increased phlegm
production, increased coughing and decreased lung function (Brownson et al., 1997).
Secondhand smoke exposure has also been linked to an increase risk of heart disease, strokes and
heart attacks as it causes harm to the heart, blood vessels and blood circulation (American
Cancer Society, 2006). Nonsmokers exposed to SHS have a 20% increase in heart disease risk
(Brownsen et al., 1997). Pregnant women exposed to SHS are at an increased risk of having a
spontaneous abortion, still-born birth, low birth weight baby, and other complications during
pregnancy and delivery (American Cancer Society, 2012).
Exposure to SHS can occur in numerous places including ones home, the workplace, the
car, and public places such as restaurants, schools, shopping centers, and public transportation
(American Cancer Society, 2012). The risk of lung cancer is approximately 30% higher for
nonsmoking spouses of smokers compared with nonsmoking spouses of nonsmokers (Brownson
et al., 1997). While over three-fourths of white collar workers are protected from SHS by
smoke-free policies, only fifty-two percent of blue collar workers and less than fifty percent of food
14
The hospitality industry, including bars, restaurants, nightclubs, bowling alleys and gaming
facilities, is one of the main sources of air pollution from SHS.
The 1988 National Health Interview Survey showed that 36.5% of the 79.2 million US
nonsmokers worked in places that allowed smoking (Brownson et al., 1997). Other US data
showed that 37% of the nonsmoking US population lived in a home with at least one smoker or
was exposed to ETS at work. Among these nonsmoking individuals, 88% had detectable serum
cotinine levels. Cotinine is a principal metabolite of nicotine but with a substantially longer
half-life so it is commonly used to measure tobacco use status or tobacco exposure (American
Association of Clinical Chemistry, 2012). Similar results were seen in a study of 663
nonsmokers attending a cancer screening. Seventy six percent reported ETS exposure in the four
days preceding the screening, with the workplace and the home being the primary sources of
exposure to ETS in this study (Brownson et al., 1997). In another study, 881 nonsmoking
employees working in workplaces that allowed smoking were assessed for exposure to ETS and
compared with nonsmoking workers in venues with smoking bans. The nonsmoking employees
who worked in venues allowing smoking were more than four times as likely to have detectable
saliva cotinine concentrations compares to those working on venues that banned smoking.
2.2Studies
In 2003 the state of New York implemented the Clean Indoor Air Act (CIAA) in an
attempt to reduce exposure to ETS in indoor public places (Abrams, Mahoney, Hyland,
Cummings, Davis & Song, 2006). Following implementation of this act, a cross-sectional study
15
non-casino hospitality workers (employed in bars, restaurants, bingo halls and bowling alleys),
casino workers, and non-hospitality workers. The objective of the study was to compare the
differences in sources of exposure and levels of exposure to ETS among both hospitality and
non-hospitality workers, both before and after this act. Environmental tobacco smoke exposure
was determined by pre and post-law interviews and urine samples assessing for cotinine, a
biomarker of ETS exposure. Among the non-casino hospitality workers there was a 70%
reduction in exposure to ETS. Among both non-casino hospitality workers and non-hospitality
workers the proportion of non-detectable cotinine levels increased significantly from pre-law to
post law: 3% to 62% in the non-casino workers and 20% to 63% in the non-hospitality workers.
In addition, urine cotinine values decreased significantly from pre-law to post-law in these two
groups. The findings from this study show that as a result of the CIAA both self-reported
exposure to ETS and measured urine cotinine levels were markedly reduced.
The state of Virginia regulates outdoor air pollution under the Virginia code, however,
the state does not regulate indoor air quality (Repace, 2006). In a study, 12 indoor venues, 19
outdoor locations, and 5 transit related locations were evaluated for their air quality using a
SidePak monitor to measure fine particle concentrations. Eleven of the 12 indoor venues
permitted smoking. Within each venue, staff and volunteers recorded the number of patrons and
the number of burning cigarettes every 10 minutes for at least 30 minutes. The length, width,
and height of each venue was also collected as the researchers hypothesized that concentrations
of SHS are directly proportional to the smoker density and inversely proportional to the air
exchange rate. Knowing that SHS contributes to about 90% of respirable particles (RSP) and
carcinogenic particulate polycyclic aromatic hydrocarbons (PPAH) in bars, RSP data was
16
RSP levels ranged from 83 µg/m3-680 µg/m3 for indoor venues. Every single one of the 11
indoor venues that allowed smoking had air levels so polluted from SHS that Occupational
Safety and Health Administration’s (OSHA) Significant Risk of Material Impairment of Health
level of one death per thousand workers per working lifetime of 45 years was exceeded. When
that level is exceeded, significant risk on employee health is noted, including serious irreversible
morbidity as well as mortality; thus, the working conditions are not safe or healthful (United
States Department of Labor, 1993). Using the air quality index (figure 2), only the one indoor
venue that prohibited smoking had good air quality (Repace, 2006). Of the 11 indoor venues that
allowed smoking, one venue was consistent with Significant Harm to human health, 4 were Very
Unhealthy, 3 were Unhealthy, and 3 were Moderate. Comparatively, all outdoor and transit
related locations had Good air quality. This study demonstrates that Virginia’s failure to
implement a smoke-free workplace law has poor consequences for its nearly 4 million workers.
A study conducted in Menlo Park, California compared indoor air quality before and after
a public smoking policy was implemented on May 1st 1994 prohibiting smoking in all taverns
within the city limit (Ott, Switzer & Robinson, 1996). Once this regulation went into effect, a
“No Smoking” sign was posted on each tavern door and all smoking inside the taverns was
banned. Before smoking was prohibited, 26 visits were made to a crowded sports tavern and
RSP concentrations were gathered. Following the smoking prohibition, 50 visits were made to
the same sports tavern to measure changes in RSP levels. During each visit, the numbers of
persons present and the number of cigarettes being smoked were documented at regular intervals.
Additionally, the successive indoor RSP concentrations, and the outdoor RSP concentrations
were recorded. RSP measurements were collected with the Model 8510 piezobalance, a portable
17
microbalance sensor. This instrument has been used for many years to measure cigarette smoke
in indoor settings. During the 2 year smoking period, the average indoor RSP concentration was
83.0µg/m3. The average outdoor concentration during that time was 26.1µg/m3. To find the
average RSP contributed by sources within the tavern, such as smoking and cooking, an
indoor-minus-outdoor (I-O) calculation was performed. The I-O mean RSP concentration preceding the
smoking prohibition was 56.8ug/m3. The I-O mean RSP concentration following the smoking
prohibition was 9.4ug/m3. The difference between the two IO measurements (pre and post the
smoking ban) was 43.9ug/m3, an average of 1.17 cigarettes per tavern attendee. These findings
showed that smoking contributed to about 80% of the total indoor RSP concentration, leaving
20% a result of other sources, such as cooking. Other studies have shown similar findings, such
as 67% of the RSP in a dinner theatre and 89% of the RSP in a bingo hall being from smoking
(Repace & Lowrey, 1982). Although the average smoking level was low (1.17
cigarettes/attendee), RSP concentrations decreased significantly after the prohibition of smoking
(Ott et al., 1996). Prior to the smoking ban the indoor RSP concentration was 56ug/m3 higher
than the outdoor concentrations, and following the ban indoor levels were only 5.9ug/m3 higher
than outdoor levels, a 90% decrease.
2.3 RSP Discussion
While implementing a no-smoking policy inside hospitality venues is one way to improve
indoor air quality, Repace (2006) also conducted a study on the air-exchange rate that would be
required to produce acceptable air quality without prohibiting smoking. He found out that a
18
quality via ventilation technology. This impossible task shows the importance of smoking bans
as the only possibility to improve indoor air quality.
A big concern for hospitality venue owners is that prohibiting smoking in the venues may
cause a loss in patron attendance and thus a loss in profit. However, the Ott et al. (1996) study
also investigated the impact a no-smoking regulation had on tavern attendance. Prior to the
regulation, the average attendance was 40.7 persons. Following the ban, the average attendance
was 41.9 persons. Thus, there was no decline in tavern attendance after the nonsmoking rule
went into effect. It was noted that smoking patrons continued to go to the tavern but just went
outside periodically to smoke. Nonsmoking patrons commented that they were relieved by the
noticeably cleaner air.
2.4Policies
There are a myriad of reasons to restrict smoking in public areas, including its impact on
chronic disease, its cost to employers and society, and ETS being deemed a carcinogen.
Government efforts to regulate exposure to ETS have occurred at the federal, state and local
levels (Brownson et al., 1997). At a federal level, smoking has been banned on airline flights, in
federal office buildings, in the White House and in childcare facilities that receive federal funds.
After the release of the 1986 Surgeon General’s report, more local ordinances to restrict
smoking occurred (Brownson et al., 1997). By 1988, nearly 400 local ordinances were passed.
Such ordinances were enforced by health departments, boards of health, city managers, police
19
In 1994, OSHA estimated that 13,000 nonsmoking workers died each year as a result of
SHS on the job and proposed a rule to ban smoking in all workplaces (Repace, 2006). However,
Congress felt this was an issue best handled by each individual state and discouraged proceeding
with this rulemaking.
In 1995, California was the first state to implement a smoke-free restaurant law and ban
smoking in many public places (Cowling & Bond, 2006). As of June 30, 1995, forty-six states
and the District of Columbia required smoke-free indoor air to some degree or in some public
places, though the state restrictions varied greatly (Brownson et al, 1997). Soon after in 1998
California then implemented a smoke-free bar law. The goal of these laws was to reduce the
susceptibility of bar and restaurant employees to respiratory and heart diseases as a result of
secondhand smoke (Cowling & Bond, 2006).
In 2005, Governor Sonny Perdue signed the Georgia Smokefree Air Act into law, and
this became effective the first of July in 2005 (North Georgia Health District, 2012). This law
prohibits smoking inside most public areas and outlines specific guidelines for allowing smoking
in and around establishments that serve the public. The law prohibits smoking in state buildings
and all enclosed areas within places of employment, except those exempt by the law (Georgia
General Assembly, 2006).The purpose of this act is to limit the exposure Georgia citizens have
to SHS, thus improving the health, comfort and environment of state adults, children and
employees (Georgia Smokefree Air Act of 2005, 2005).This act requires that specific signage
stating the venue’s smoking status, such as ‘No Smoking,’ showing the universal ‘No Smoking’
symbol, ‘Smoking Permitted,’ ‘Smoking Permitted, No One Under the Age of 18 Allowed,’ and
‘No Smoking Beyond this Point’ shall be noticeably posted, and shall not be concealed in any
20
General Assembly, 2006). However, Georgia’s law has exemptions that allow smoking to
continue in some public locations, such as bars and restaurants that do not serve minors, and
privately owned rooms used for private functions in which minors are not attending. In addition
to state ordinances, local and county governments in Georgia have the authority to regulate
smoking and implement more stringent rules than the state. Fulton County, however, does not
have any ordinances to ban smoking in bars, restaurants or workplaces (Fulton County
Department of Health and Wellness, 2003).
Similar to how smoking restrictions increased in bars and restaurants over the years, the
percentage of United States workplaces with total smoking bans increased substantially from
1986-1991 from 2 to 34% (Brownson et al, 1997). Such workplace smoking bans have been
effective in reducing non-smokers exposure to ETS as measured by perceived air quality in the
workplace following such bans and by active measurement of nicotine vapor. Both 1 and 8
months after a smoking ban was instituted at John Hopkins Medical Institute, nicotine vapor
concentrations declined so significantly that in most areas nicotine concentrations were below
the detectable level of 0.24mg/m3. In a study comparing Massachusetts workplaces that allowed
smoking to those that prohibited it, nicotine concentrations varied from 8.6 to .3ug/m3. Not only
do workplace smoking bans decrease exposure to ETS but US population based studies have also
shown that smoking bans reduce smoking prevalence and daily smoking consumption by 10%.
Smoking bans were associated with lower smoking rates and higher proportions of people
quitting smoking. Furthermore, the United States Environmental Protection Agency (EPA)
analysis concluded that a national ban on smoking in the workplace would reduce costs to
employers by $39-72 billion a year, including but not limited to decreased fire risk, damage to
21 2.5 Particulate Matter
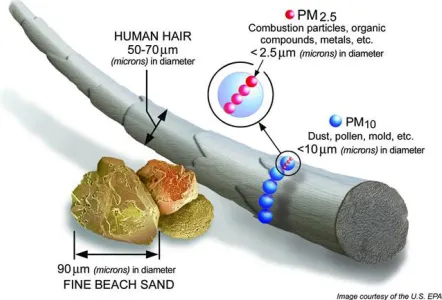
Particulate matter is a type of air pollution composed of various particles in the air that range
in size and shape (EPA, 2012). Smaller particulate matter, 10 micrometers in diameter or
smaller, is especially concerning to the EPA, as these particles are small enough to be inhaled
and lodge deep in the respiratory system, causing serious health effects. Fine particles, PM2.5,
represent solid particles and liquid droplets with a diameter of ≤ 2.5 micrometers. (Figure 1)
Such fine particles pose the largest health risks. Studies have shown that exposure to these fine
particles worsens pre-existing respiratory and cardiovascular disease and causes premature
mortality, lung disease, heart attacks, and cardiac arrhythmias. Particulate matter of this small
size compromises the majority of components of cigarette smoke (EPA, 2008). The small size of
many of the particulate components of tobacco smoke allows them to be drawn into the lungs of
[image:22.612.121.342.490.640.2]nonsmokers (Brownson et al., 1997).
Figure 1:
How Big is Particulate Matter2.5
http://www.epa.gov/pm/basic.html
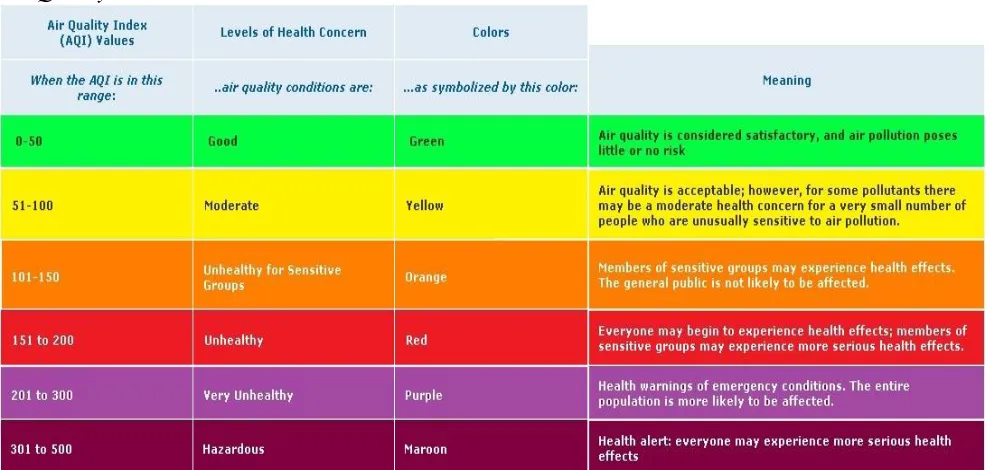
The EPA calculates an air quality index based on six major air pollutants considered
22
the six pollutants measured. The EPA’s 24 HR Air Quality Index ranks PM2.5 concentrations
(ug/m3) according to the potential to affect public health. The index has 6 levels of air quality:
‘Good’ has a PM2.5 concentration of ≤ 15, ‘Moderate’ has a PM2.5 concentration of 16-35,
‘Unhealthy for Sensitive groups’ has a PM2.5 concentration of 36-55, ‘Unhealthy’ has a PM2.5
concentration of 56-150, ‘Very Unhealthy’ has a PM2.5 concentration of 151-250, and
‘Hazardous’ has a PM2.5 concentration of ≥ 250 . Figure 2 depicts the EPA’s air quality index
[image:23.612.72.567.311.546.2]values.
Figure 2:
Air Quality Index Values
http://airnow.gov/index.cfm?action=aqibasics.aqi
To measure the air quality in this study, TSI SidePak® AM510 Personal Aerosol Monitor
(TSI, Inc., St. Paul, Minnesota) was used. This monitor uses a built in sampling pump to draw air
through a laser. The particles in the air scatter the light of the laser and the monitor measures the
mass concentration of respirable suspended particles in micrograms per cubic meter based on the
amount of scattering. These types of monitors display aerosol concentrations real-time. This
23
was the target of interest since it is the major component of cigarette smoke, hence making it a
24 Chapter III
Methods and Procedures
3.1: Study Population
A list of bars, restaurants, clubs, taverns and other hospitality venues within Fulton
County, Georgia that were sold a license to serve alcohol in 2011 was obtained from the Georgia
Department of Revenue. The list contained 1,040 licenses. The sample size was then narrowed
down to those within the city of Atlanta appropriate for air testing. Additionally, all strip clubs
and liquor stores were eliminated from the list, leaving 99 venues in the sample population.
(Table 7) Each of these locations was contacted by telephone to verify whether or not smoking
was allowed on the premises. The respondents provided one of two answers: yes (1) or no (0).
3.2 Venue Photographs
The 99 venues were each visited and a photo of the entrance was taken, including any
smoking signage visible at the entrance, using a Canon PowerShot SD 1200 IS digital camera.
The same person took each photo. Venues in the same area of town were typically visited on the
same day and all of the pictures were taken within three weeks. Each photo was coded so it could
25
with signage of smoking status according to Georgia Legal Code 290-5-61-.05 Signage of the
Georgia Smokefree Air Act of 2005 (Georgia Smokefree Air Act of 2005, 2005). Independent
reviewers rated whether or not signage requirements were met by indicating ‘N’ for
non-compliance and ‘Y’ for non-compliance. Compliance was met if‘no-smoking’ signs were visible on
an entrance or in a place visible at entry into the place, and if the words on the sign were at least
1.5 inches in height (Table 7). Additionally, if a venue permitted smoking, a sign stating
‘Smoking Permitted, No One Under the Age of 18 Allowed’ had to be posted in order to be in
compliance. In addition to visiting each venue to capture whether smoking signage was
displayed, 59 venues were visited to collect air quality data. (Table 8)
3.3: Data Collection and Training
Georgia State University conducted a 3-hour training for volunteers on Friday, May 17th
2012 in order to show them how to properly use a TSI SidePak® AM510 to measure air quality
in various Atlanta hospitality venues. The training was performed by Paul Mowery, a well-
known secondhand smoke researcher who currently works at the Centers for Disease Control and
Prevention (CDC) in the tobacco division.
After the training, volunteer pairs returned on the nights of May 17th and 18th for venue
assignments. They were sent to the venues with the SidePak hidden within a bag, and entered the
establishment as a customer making a purchase. However, if the volunteers were asked what they
were doing, they were truthful about their reason for being there. While at each establishment the
team took note of whether there was smoking signage outside of the establishment, the total
26
evidence of smoking such as ashtrays and cigarette vending machines. They also noted if fans,
hookahs or open flame cooking was occurring within the venue. Counting the number of
occupants inside the establishment and the number of burning cigarettes was repeated every 10
minutes until the volunteers exited the establishment. The volunteers were inside each
establishment for at least 30 minutes, and collected three different occupancy counts and lit
cigarette counts, which were averaged to obtain the mean occupancy and mean number of
burning cigarettes per venue. While inside, the SidePak ran continuously, taking real-time
measurements of PM2.5 and other respirable suspended particulates. Indoor air was sampled by
the SidePaks at one-second intervals and the average recorded at one-minute intervals. At the
end of the field visits, the volunteers dropped off the packs at GSU where the data was
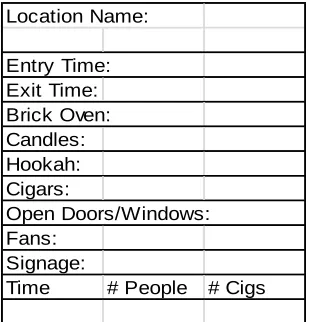
downloaded, and the field notes were entered and saved for data analysis. The field note template
[image:27.612.220.375.472.633.2]completed for each venue can be seen in Figure 3.
Figure 3:
Field Note Template Completed at Each Venue
Location Name:
Entry Time: Exit Time: Brick Oven: Candles: Hookah: Cigars:
Open Doors/Windows: Fans:
Signage:
27 3.4: Statistical Analysis
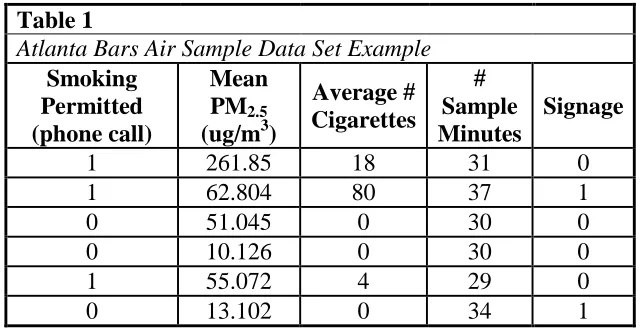
All sampling and collected data was compiled and organized into a single table (see
Table 1) for statistical analysis with the Statistical Package for the Social Sciences (SPSS) ®
versions 19-21. Photographic compliance data was coded 0 or 1; 0 being not compliant and 1
being compliant. Similarly, telephone responses to smoking status were coded 0 or 1; 0 being
nonsmoking and 1 being smoking. All other variables were the averages of the data gathered
during the air quality visits: Mean PM2.5, Average # People, and Average # Cigarettes. The
subsequent outcomes will be further discussed in the following chapter for results.
To begin, tests of normality were performed to determine whether the data had a normal
distribution. The result would determine what statistical correlation test should be used;
parametric (for a normal distribution) or nonparametric (for a not-normal distribution). The tests
of normality indicated that the data had a non-normal distribution, so a nonparametric test
(Spearman’s rho) was used to calculate correlations between PM2.5 and the other collected
[image:28.612.146.466.487.653.2]variables of interest to answer the research questions.
Table 1
Atlanta Bars Air Sample Data Set Example Smoking
Permitted (phone call)
Mean PM2.5 (ug/m3)
Average # Cigarettes # Sample Minutes Signage
1 261.85 18 31 0
1 62.804 80 37 1
0 51.045 0 30 0
0 10.126 0 30 0
1 55.072 4 29 0
28 CHAPTER IV
Results
4.1 Data Collection Results
While 99 venues were selected for sampling, only 59 venues were included in this study
due to multiple limitations including limited SidePak monitors available for rent, the cost of
shipping and renting monitors, the ability to obtain enough volunteers, the cost of transportation,
and machine batteries failing.
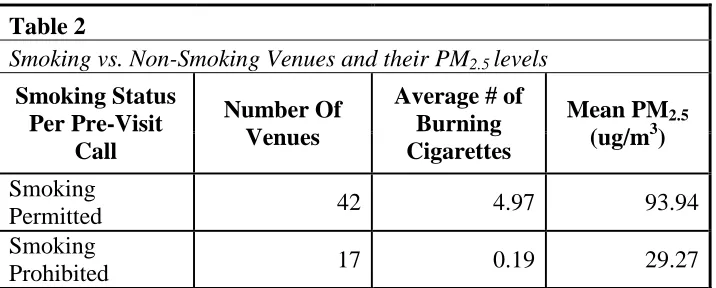
Of the fifty-nine venues sampled, the mean time spent in each venue was 36.9 minutes,
with a range of 24 to 81 minutes. Of the fifty-nine establishments, 42 permitted smoking while
17 did not allow smoking per the pre-visit phone call. Burning cigarettes were noted in 37
establishments, while 22 venues had no burning cigarettes sighted. In the establishments that did
not permit smoking the average number of burning cigarettes was 0.19, with a range of 0 to 3.3
cigarettes. In the establishments allowing smoking, the average number of burning cigarettes was
4.97, with a range of 0 to 80 cigarettes. The average PM2.5 levels for establishments that did not
allow smoking was 29.27ug/m3, compared to an average PM2.5 level of 93.94ug/m3 in the
29
Table 2
Smoking vs. Non-Smoking Venues and their PM2.5levels
Smoking Status Per Pre-Visit
Call
Number Of Venues
Average # of Burning Cigarettes
Mean PM2.5 (ug/m3)
Smoking
Permitted 42 4.97 93.94
Smoking
Prohibited 17 0.19 29.27
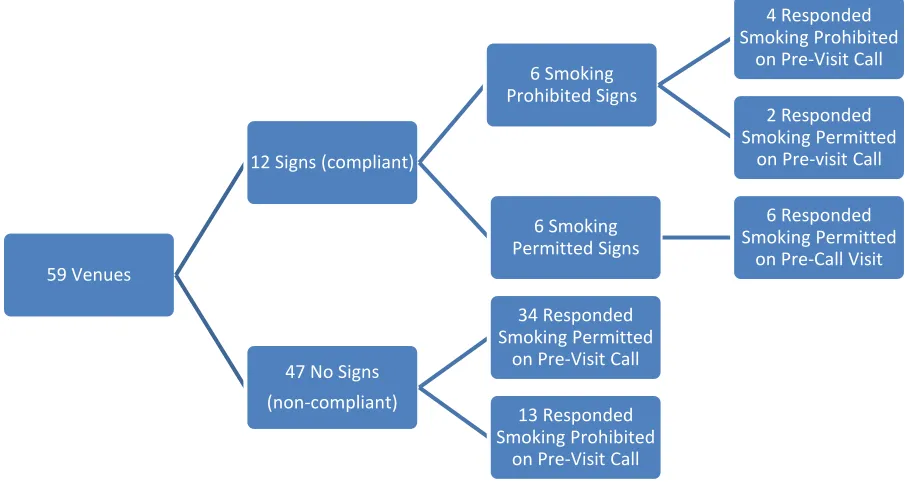
During the pre-visit calls to each establishment, 42 of the fifty-nine establishments said
they do allow smoking inside their venue, while 17 said that smoking was not permitted.
However, when pictures were taken of the entryways of each establishment, only 12 of the
fifty-nine establishments had signs posted on their entryway stating their smoking status. Six of these
12 establishments had signs stating that smoking was not permitted inside the venue and 6 had
signs stating that smoking was permitted. (Figure 4)
Of the six establishments that had signs stating no smoking, four of them also stated on
the phone that they did not allow smoking. However, two of venues that displayed a no-smoking
sign told us over the phone that they allowed smoking.
Of the 47 establishments that did not have signs on their entryway showing their smoking
status, 34 stated in the pre-visit phone call that they did allow smoking, while the other 13 stated
on the phone that they did not allow smoking.
30 Figure 4:
Flow Chart for Compliance of Signage and Calls
Of the 17 venues who stated during the pre-visit call that they do not allow smoking, only
four had signs showing that smoking was prohibited. Of the same 17 venues who stated on the
pre-visit call that they do not allow smoking, only one was found to have cigarettes burning
during the air quality testing.
Of the 42 venues who stated on pre-visit call that they did allow smoking, 8 of them had
signs on their entry-way notifying patrons of their smoking status. Six of these 8 venues had
signs stating that smoking was permitted inside the establishment, while 2 of the venues had
signs that stated smoking was prohibited. The remaining 34 venues who stated they allowed
smoking in the pre-visit phone call did not have signage in their entryway notifying patrons of
their smoking status.
59 Venues
12 Signs (compliant)
6 Smoking Prohibited Signs
4 Responded Smoking Prohibited
on Pre-Visit Call
2 Responded Smoking Permitted
on Pre-visit Call
6 Smoking Permitted Signs
6 Responded Smoking Permitted
on Pre-Call Visit
47 No Signs (non-compliant)
34 Responded Smoking Permitted
on Pre-Visit Call
13 Responded Smoking Prohibited
31 4.2 Statistical Analysis Results
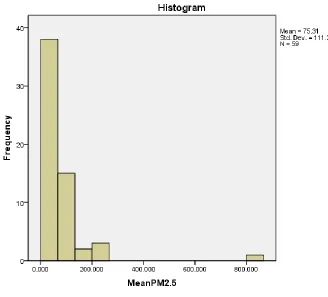
Statistical analysis began with determining whether or not the data had a normal distribution, as mentioned in the methodology. The tests of normality indicated that the
distribution of the sample was significant, p<.05. Therefore the distribution is significantly
[image:32.612.125.492.202.313.2]different from a normal distribution.
Table 3:
Test of Normality
Kolmogorov-Smirnov a
Shapiro-Wilk
Statistic df Sig. Statistic df Sig.
Mean PM2.5 0.262 59 0 0.493 59 0
a. Lilliefors Significance Correction
A histogram depicting the distribution of data for variable Mean PM2.5 is provided in Figure 5.
Figure 5:
[image:32.612.80.408.390.687.2]32
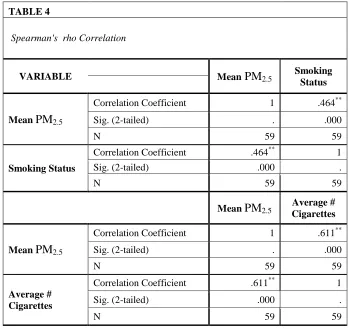
Since the data does not have a normal distribution, a nonparametric test was used to
determine correlations. Spearman’s rho test does not rely on the assumptions of a parametric test
such as having a normal distribution, and measures the strength of the correlation between two
variables. Spearman’s rho test was used to determine the correlation between mean PM2.5 levels
and venues’ smoking status as indicated via telephone. The statistical output indicated there is a
moderate positive correlation between the 2 variables (r=.464, n=59, p<.001). The correlation
between mean PM2.5 levels and average number of burning cigarettes per venue was also tested.
It was determined that there is a strong positive correlation between the two variables (r=.611,
n=59, p<.001). The final correlation test was run between PM2.5 and signage compliance outside
the venue. The test result showed a weak correlation between the data (r=.107, n=59, p>.001).
[image:33.612.131.481.384.713.2]These results are shown in the following table:
TABLE 4
Spearman's rho Correlation
VARIABLE Mean PM2.5 Smoking Status
Mean PM2.5
Correlation Coefficient 1 .464**
Sig. (2-tailed) . .000
N 59 59
Smoking Status
Correlation Coefficient .464** 1
Sig. (2-tailed) .000 .
N 59 59
Mean PM2.5
Average # Cigarettes
Mean PM2.5
Correlation Coefficient 1 .611**
Sig. (2-tailed) . .000
N 59 59
Average # Cigarettes
Correlation Coefficient .611** 1
Sig. (2-tailed) .000 .
33
Mean PM2.5
Signage Compliance
Mean PM2.5
Correlation Coefficient 1 0.107
Sig. (2-tailed) . 0.418
N 59 59
Signage Compliance
Correlation Coefficient 0.107 1
Sig. (2-tailed) 0.418 .
N 59 59
34 CHAPTER V
CONCLUSIONS
Environmental tobacco smoke has been shown to harm every organ of the body. Its
health-related consequences have been proven in both smokers and those persons exposed to
SHS. Government efforts to regulate exposure to ETS have occurred at the federal, state and
local levels.
In Georgia, the Smokefree Air Act of 2005 was enacted to protect the citizens of the
state, including children, adults and employees, from the harmful consequences of tobacco
exposure by limiting their exposure to SHS in most places where the public is permitted. In
addition to state ordinances, some local and county governments in Georgia have further
regulated smoking in public places by implementing more stringent rules than the state. Fulton
County, however, does not have any ordinances to ban smoking in bars, restaurants or
workplaces.
This study assessed to what degree 59 Fulton County venues, including 1 club, 8 taverns
and 50 restaurants complied with the Georgia Smokefree Air Act. During the pre-visit calls to
each of the 59 venues in this study, 42 of the 59 establishments said they do allow smoking
35
specific smoking rules, only 12 had signage in the entryways to their establishments indicating
their smoking status, as required by the Georgia Smokefree Air Act signage section. The
remaining 47 venues did not comply with the Georgia Smokefree Air Act. (Figure 4)
Of the 12 establishments that had signs, 6 of them had signs stating that smoking was not
permitted inside the venue and 6 had signs stated that smoking was permitted. Of the 6
establishments that had signs stating smoking was prohibited, four of them also stated on the
phone that they did not allow smoking. However, the fifth and sixth venue that displayed a
no-smoking sign told us over the phone that they allowed no-smoking, and did have cigarettes actively
burning in their establishments at the time of the air quality measures.
Of the 6 venues with “no smoking” signage, the mean cigarettes being burned was 0.988
and the average PM2.5 was 37.71. In contrast, of the 6 venues that had signs permitting smoking
and had smoking actively occurring in their restaurant, the average number of cigarettes/cigars
burning was 18.85 and the average PM2.5 was 230.313, a 6-fold increase from the venues
prohibiting smoking.
Of the 47 establishments that did not have signs on their entryway showing their smoking
status, 34 stated in the pre-visit phone call that they did allow smoking, while the other 13 stated
on the phone that they did not allow smoking. Of the 34 venues that said smoking was permitted
on the phone, 29 had active smoking occurring at the time of air quality measurements. The
average number of cigarettes burning was 2.65 with an average PM2.5 of 71.98. Of the 13 venues
that said smoking was prohibited on the pre-visit call, one establishment had smoking occurring
inside the premise. The average number of cigarettes in the venues that stated smoking was
36
The venues with the fewest number of cigarettes burning and the lowest PM2.5 were the
venues with no smoking signs and who also reported “no smoking” on the pre-visit call. In
contrast, the venues with signs permitting smoking and who also reported smoking was allowed
on the pre-visit call had the highest number of cigarettes burning and the highest PM2.5 levels.
The results of this study are surprising because only 12 of the 59 venues are compliant
with the signage requirements for the Georgia Smokefree Air Act. It is also surprising that two
venues had signs prohibiting smoking, yet the employee over the phone said smoking was
allowed inside, and there were patrons actively smoking inside the establishments. Additionally,
the venue with the highest PM2.5, 804.207, was a venue that had only cigars being smoked, and
only 12 cigars. Another unforeseen finding was that several establishments that allowed smoking
and had active burning cigarettes had lower PM2.5 levels than other establishments that prohibited
smoking and had no actively burning cigarettes. This can possibly be explained by the fact that
these establishments had more open flame cooking or other sources of PM2.5.
While the intent of the Georgia Smokefree Air Act of 2005 is to protect the health of
Georgia citizens, it is apparent that this act is not doing enough to protect the citizens from
exposure to SHS. At a local and county level, this act needs to be better enforced, so that venues
not meeting the signage requirements are penalized. The penalties for venues not meeting the
requirements need to be harsh, so that venue owners comply. Also, additional county laws
prohibiting smoking in public places need to be enacted and enforced at the county level.
Furthermore, Fulton County should establish a PM2.5 requirement for all public places and have
this level checked annually as part of restaurant safety inspections. Similar to restaurant safety
37
Future areas that could be explored to help Fulton County enact legislation would be to
study the compliance of venues located in other counties in Georgia that do have county laws
prohibiting smoking in public and see if such laws are better followed and if PM2.5 levels
improved with increased compliance. Additionally, studies should assess whether venues with
strict “no-smoking” policies have a greater impact on the smoking behaviors of their employees,
both inside and outside of work. Studies should also be conducted to assess the knowledge of
venue owners regarding state and local regulations for smoking in public hospitality venues, as
38 References
Abrams, S. M., Mahoney, M. C., Hyland, A., Cummings, K. M., Davis, W., & Song, L.,
(2006). Early evidence on the effectiveness of clean indoor air legislation in New York State. American Journal of Public Health. 96 (2), pp.296-298.
American Association of Clinical Chemistry. (2012). Nicotine/Cotinine. Retrieved from: http://labtestsonline.org/understanding/analytes/nicotine/tab/test.
Air Now (2011). Air quality Index (AQI)-A Guide to Air Quality and Your Health. Retrieved from: http://airnow.gov/index.cfm?action=aqibasics.aqi.
American Cancer Society (2006). Healtheffects of secondhand smoke exposure.
Retrieved from: http://www.gtc.edu/tobaccofree/ACS-SHSHealthEffects1106.pdf.
American Cancer Society (2012). Secondhand smoke. Retrieved from:
http://www.cancer.org/Cancer/CancerCauses/TobaccoCancer/secondhand-smoke.
Brownson, R. C., Eriksen, M. P., Davis, R. M., & Warner, K. E., (1997). Environmental
tobacco smoke: health effects and policies to reduce exposure. Annual reviews of public health.18 (1), pp. 163-185.
39 States: Current estimate. Retrieved from:
http://www.cdc.gov/tobacco/data_statistics/fact_sheets/adult_data/cig_smoking/.
Centers for Disease Control and Prevention (2011). Smoking and tobacco use. Retrieved from:
http://www.cdc.gov/tobacco/data_statistics/state_data/state_highlights/2010/states/georgi a/index.htm
Cowling, D. W., & Bond, P., (2005). Smoke-free laws and bar revenues in California-the last
call. Health Economics. 14(12), pp. 1273-1281.
Fulton County Department of Health and Wellness (2003). Basic Requirements for Opening a Restaurant or Commissary. Retrieved from:
http://www.foodserviceresource.com/State/GA/Fulton_County/FULTON_COUNTY_HE
ALTH_INSTRUCTIONS.htm.
Georgia General Assembly (2006). SB 90-Georgia Smokefree Air Act; definitions;exemptions; violations; penalties. Retrieved from:
http://www1.legis.ga.gov/legis/2005_06/search/sb90.htm.
Georgia Smokefree Air Act of 2005. Rules of Department of Human Resources Public
Health. (2005). Chapter 290-5-61. Retrieved from:
http://www.georgialibraries.org/lib/library_laws/SmokeFreeAirAct.pdf.
North Georgia Health District (2012). Smoke free air act. Retrieved from: http://www.nghd.org/Environmental-Health/Smokefree-Air-Act/.
Ott, W., Switzer, P., & Robinson, J., (1996). Particulate concentrations inside a tavern before
40
Repace, James. (2006). Air pollution in Virginia’s hospitality industry. A report prepared for
Virginians for a healthy future. Retrieved from: www.repace.com.
Repace, J. L., and Lowrey, A. H., (1982). Tobacco smoke, ventilation, and indoor air quality.
ASHRAE Transactions. 88, pp. 895-914.
United States Department of Health and Human Services (2011). Health consequences of smoking: A report of the surgeon general. Retrieved from:
http://www.cdc.gov/tobacco/data_statistics/sgr/2004/index.htm.
United States Department of Labor. (1993). Occupational Safety and Health Administration. Retrieved from:
http://www.osha.gov/pls/oshaweb/owadisp.show_document?p_table=PREAMBLES&p_i d=816
United States Environmental Protection Agency (2011). Health effects of exposure to
secondhand smoke .Retrieved from: http://www.epa.gov/smokefree/healtheffects.html.
United States Environmental Protection Agency (2012). Particulate Matter. Retrieved from: http://www.epa.gov/pm/basic.html.
41
[image:42.612.36.580.286.721.2]Appendix A: Tables
Table 5
Atlanta Venue Photographic Compliance
Retailer Address
Signage
(Y/N) Picture Time
NORTH HIGHLAND PUB 469 N HIGHLAND AVE NE N 410 6:28PM 7/1
MANUELS TAVERN 602 N HIGHLAND AVE NE N 403-404 6:12PM 7/1
THE LOCAL 758 PONCE DE LEON AVE NE N 424 3:32PM 7/8
RIGHTEOUS ROOM 1051 PONCE DE LEON AVE N 423 3:30PM 7/8
MOONDOGS 3177B - 3179 PEACHTREE RD N 459 8:00PM 7/11
BUCKET SHOP CAFE 3475 LENOX ROAD N 494 10:30AM 7/22
PARK BENCH 34 IRBY AVE NW N 452-453 7:32PM 7/11
THE HOLE IN THE WALL 3177 PEACHTREE RD NE N 458 8:01PM 7/11
APRES DIEM 931 MONROE DR NE N 473 12:20PM 7/19
GORDON BIERSCH BREWERY
RESTRAU 848 PEACHTREE ST NE N 413 5:38PM 7/7
SHOUT 1197 PEACHTREE ST STE 526 N 411 5:30PM 7/7
MID CITY CAFE 845 SPRING ST NW STE D1 Y 469 11:58AM 7/19
MIDTOWN TAVERN 554 PIEDMONT AVE NE STE B N 422 6:45PM 7/7
INDIGO BAR 619 EDGEWOOD AVE SE N 421 6:33PM 7/7
THE WARREN 818 N HIGHLAND AVE NE N 397-398 5:52PM 7/1
LOCA LUNA 550C AMSTERDAM AVE NE N 470 12:07PM 7/19
HERETIC 2069 CHESHIRE BRIDGE RD NE N 495 10:43AM 7/22
OSCAR'S OF ATLANTA 1510 PIEDMONT AVE NE N 501 11:06AM 7/22
ATLANTA EAGLE 306 PONCE DE LEON AVE NE N 429-430 4:12PM 7/8
DECKARD'S KITCHEN & KEGS 650 PONCE DE LEON AVE NE N 427 4:00PM 7/8
MJQ CONCOURSE/Drunken Unicorn 736 PONCE DE LEON AVE NE N 425 3:30PM 7/8
GIBNEY'S PUB
231 PEACHTREE CTR AVE STE
A07 N 414 5:57PM 7/11
HIGH VELOCITY 265 PEACHTREE CENTER AVE N 415-417 5:59PM 7/11
BOTTLE BAR 268 E PACES FERRY RD NE N 455 7:41PM 7/11
42
BELUGA MARTINI BAR/ROSEBAR 3115 PIEDMONT RD ST B-101 N 457 7:50PM 7/11
ROCKY MOUNTAIN PIZZA COMPANY 1005 HEMPHILL AVE NW N 468 11:50AM 7/19
CENTRAL CITY TAVERN 1801 HOWELL MILL RD NW N 463 11:23AM 7/19
PRICKLY PEAR TAQUERIA 950 W PEACHTREE ST NW N 432 4:19PM 7/8
SUTRA LOUNGE LLC 1136 CRESCENT AVE NE N 435 4:25PM 7/8
COSMOPOLITAN 45 13TH ST NE N 437 4:28PM 7/8
BLIND WILLIES INC 828 NORTH HIGHLAND AVE N 392 5:49PM 7/1
NONI'S 357 EDGEWOOD AVE SE N 488 9:46AM 7/21
EDGEWOOD CORNER TAVERN 464 EDGEWOOD AVE SE N 486 9:42AM 7/21
KROG BAR 112 KROG ST NE N 479 9:21AM 7/21
CAFE CIRCA 464 EDGEWOOD AVE SE N 487 9:43AM 7/21
FONTAINES OYSTER HOUSE INC 1026 1/2 N HIGHLAND AVE NE N 388 5:43PM 7/1
DIESEL 870 N HIGHLAND AVE NE N 391 5:47PM 7/1
HIGHLAND CIGAR CO.
245 N HIGHLAND AVE NE STE
140 N 408-409 6:25PM 7/1
HAND IN HAND 752 N HIGHLAND AVE NE Y 401 6:05PM 7/1
OSTERIA 832 832 N HIGHLAND AVE NE Y 394-395 5:49PM 7/1
LA FONDA 1025 HOWELL MILL RD NW N 467 11:43AM 7/19
ORMSBY'S 1170 HOWELL MILL RD NW N 465 11:40AM 7/19
NORTHSIDE TAVERN 1058 HOWELL MILL RD NW N 466 11:41AM 7/19
WEST MIDTOWN CORNER TAVERN 1133 HUFF RD NW N 464 11:31AM 7/19
THE HIGHLANDER 931 MONROE DR NE N 474 12:21PM 7/19
PARK TAVERN 500 10TH ST NE N 472 12:16PM 7/19
SMITH'S OLDE BAR 1580 PIEDMONT RD NE N 499 11:02AM 7/22
ROXX 1824 CHESHIRE BRIDGE RD NE N 497 10:52AM 7/22
BURKHART'S PUB 1492-F PIEDMONT RD NE N 500 11:05AM 7/22
AMSTERDAM CAFÉ 502 AMSTERDAM AVE NE N 471 12:13PM 7/19
MODEL T 699 PONCE DE LEON AVE N 428 4:08PM 7/8
FELIXS ON THE SQUARE 1510 PIEDMONT RD NE STE G N 502 11:07AM 7/22
BJ Rooster 2345 Cheshire Bridge Rd N 496 10:47AM 7/22
Woof's on Piedmont 2425 Piedmont Rd NE N 498 10:56AM 7/22
FRIENDS ON PONCE 736 PONCE DE LEON AVE NE N 426 3:39PM 7/8
TIN LIZZY'S GRANT PARK 415 Memorial Dr N 485 9:38AM 7/21
MATADOR MEXICAN CANTINA 925 GARRETT ST SE N 492 10:07AM 7/21
VICKERY'S GLENWOOD PARK 933 GARRETT ST UNIT 101-102 N 491 10:06AM 7/21
THE ALBERT CITY of ATLANTA N 489 9:54AM 7/21
EL MYR RESTAURANT 1091 EUCLID AVE NE N 478 9:16AM 7/21
WRECKING BAR 292 MORELAND AVE NE N 490 9:58AM 7/21
PURE TAQUERIA 300 N HIGHLAND AVE NE N 405 6:15PM 7/21
P'CHEEN 701-5 HIGHLAND AVE N 406-407 6:17PM 7/1
MILLTOWN ARMS 180 CARROLL ST SE N 481 9:29AM 7/21
43
REPUBLIC SOCIAL HOUSE 437C MEMORIAL DR SE N 483 9:36AM 7/21
AGAVE 242 BOULAVARD SE N 482 9:31AM 7/21
97 ESTORIA 727 WYLIE ST SE N 480 9:24AM 7/21
EUCLID AVE YACHT CLUB 1136 EUCLID AVE NE N 475 9:09AM 7/21
LITTLE 5 CORNER TAVERN 1174 EUCLID AVE NE N 476 9:11AM 7/21
THE VORTEX BAR & GRILL 438 MORELAND AVE NE N 493 10:18AM 7/21
THE PORTER 1156 EUCLID AVE NE N 477 9:13AM 7/21
ANATOLIA CAFÉ 52 PEACHTREE ST NW N 420 6:16PM 7/7
SIDEBAR 79A POPLAR ST NW N 419 6:11PM 7/7
CAFE INTERMEZZO 141 Margaret Mitchell Square Y 418 6:07PM 7/7
THE POOL HALL 30 IRBY AVE NW N 451 7:30PM 7/11
FIVE PACES INN 41 IRBY ST N 450 7:29PM 7/11
RED DOOR TAVERN 3180 ROSWELL RD NW N 446 7:11PM 7/11
GYPSY STAG~now Hangovers 3188 ROSWELL RD NW N 444 7:09PM 7/11
STOUT IRISH SPORTS BAR
56 E ANDREWS DR NW STE 15 &
16 N 449 7:25PM 7/11
STOOGES 2020 HOWELL MILL RD NW N 461 11:11AM 7/19
MR C'S NEIGHBORHOOD BAR & GRIL 1983 HOWELL MILL ROAD N 462 11:15AM 7/19
BLACK BEAR TAVERN 1931 PEACHTREE RD NE N 460 8:12PM 7/11
Johnny's HIDEAWAY 3771 Roswell Rd NE N 443 7:00PM 7/11
Divan 3125 PIEDMONT RD NE N 456 7:47PM 7/11
KRAMER'S 3167 ROSWELL RD NE N 445 7:10PM 7/11
The Ivy 3717 ROSWELL RD N 448 7:19PM 7/11
BUCKHEAD SALOON 3227 ROSWELL RD NE N 447 7:14PM 7/11
DEADWOOD SALOON 66 12TH ST NE N 436 4:27PM 7/8
CHARLIE G'S 11TH STREET PUB 1041 W PEACHTREE ST NW Y 433-434 4:22PM 7/8
THE VORTEX BAR & GRILL 878 PEACHTREE ST NE LBBY 4 N 412 5:36PM 7/7
MARLOW'S TAVERN 950 W PEACHTREE ST NW N 431 4:17PM 7/8
DARK HORSE TAVERN 816 N HIGHLAND AVE NE N 396 5:52PM 7/1
NEIGHBORS PUB 752-C N HIGHLAND AVE NE N 402 6:06PM 7/1
LIMERICK JUNCTION PUB 822 N HIGHLAND AVE NE N 393 5:50PM 7/1
ATKINS PARK RESTAURANT 794 N HIGHLAND AVE NE Y
399(R),
400(B) 6:00PM 7/1
44
Table 6
Photographed Venues with Air Quality Data
Venue
ID Venue
Smoking Allowed Mean PM2.5 Average # People Average # Cigarettes # Sample Minutes Signage
100 KROG BAR 0 69.081 26 0 32 0
101 CAFE CIRCA 0 19.53 75 0 31 0
102 HAND IN HAND 0 13.102 96 0 34 1
103 OSTERIA 832 0 11.97 6 0 31 1
104 LA FONDA 0 25.328 50 0 32 0
105 ORMSBY'S 0 10.126 120 0 30 0
106 WRECKING BAR 0 11.41 68 0 31 0
107 PURE TAQUERIA 0 9.93 31 0 30 0
108 P'CHEEN 0 74.135 21 0 81 0
109 Six Feet Under 0 51.045 128 0 30 0
110 REPUBLIC SOCIAL HOUSE 0 25.336 32 0 62 0
111 AGAVE 0 59.316 34 0 43 0
112 CAFE INTERMEZZO 0 8.916 17 0 43 1
113 The Ivy 0 36.697 38 0 30 0
114 BUCKHEAD SALOON 0 33.449 24 0 35 0
115 HIGHLAND TAP 0 26.145 50 0 63 1
201 NONI'S 1 135.58 46 1.6 31 0
202 EDGEWOOD CORNER TAVERN 1 111.68 36 3.3 40 0
203 FONTAINES OYSTER HOUSE INC 1 30.093 55 0 48 0
204 DIESEL 1 105.99 19 3.3 31 0
205 HIGHLAND CIGAR CO. 1 804.207 35 12 33 1
206 NORTHSIDE TAVERN 1 54.411 20 3 29 0
207 WEST MIDTOWN CORNER TAVERN* 1 70.458 20 4 49 0
208 THE HIGHLANDER 1 39.527 16 1 45 0
209 PARK TAVERN 1 15.837 25 0 60 0
210 SMITH'S OLDE BAR 1 25.105 53 1 41 0
211 ROXX 1 67.33 40 0.6 63 0
212 BURKHART'S PUB 1 261.85 138 18 31 0
213 AMSTERDAM CAFÉ 1 99.49 45 2.2 31 0
214 MODEL T 1 70.142 11 1.5 30 0
215 FELIXS ON THE SQUARE 1 91.004 42 5 30 1
216 FRIENDS ON PONCE 1 256.11 26 3.8 31 1
219 THE ALBERT 1 106.425 54 5.6 25 1
220 TIN LIZZY'S GRANT PARK 1 22.069 76 0.6 28 0
45
222 MATADOR MEXICAN CANTINA 1 54.028 29 0 30 0
223 EL MYR RESTAURANT 1 204.274 76 4.3 30 0
224 MILLTOWN ARMS 1 61.715 23 3.3 42 0
225 EUCLID AVE YACHT CLUB 1 60.977 27 3.3 37 1
226 LITTLE 5 CORNER TAVERN 1 20.672 11 1 29 0
228 THE PORTER 1 80.095 40 0 56 0
229 ANATOLIA CAFÉ 1 58.764 31 0 32 0
230 SIDEBAR 1 10.978 7 0 35 0
231 THE POOL HALL 1 46.914 14 1 32 0
232 FIVE PACES INN 1 41.135 25 1 33 0
233 RED DOOR TAVERN 1 115.313 25 2.3 33 0
235 STOUT IRISH SPORTS BAR 1 54.32 11 1.3 31 0
236 STOOGES 1 4.254 33 3.3 0
237 MR C'S NEIGHBORHOOD BAR&GRILL 1 20.335 18 3.3 30 0
239 KRAMER'S 1 16.909 8 0.33 24 0
241 DIVAN 1 122.74 27 10.3 31 0
242 CHARLIE G'S 11TH STREET PUB 1 106.776 13 9 36 1
243 DEADWOOD SALOON 1 18.59 4 0.66 41 0
244 THE VORTEX BAR & GRILL 1 62.804 131 80 37 1
245 MARLOW'S TAVERN 0 12.065 93 3.3 26 0
246 DARK HORSE TAVERN 1 156.236 22 2 41 0
247 NEIGHBORS PUB 1 98.38 8 11 31 0
248 LIMERICK JUNCTION PUB 1 55.072 100 4 29 0
249 ATKINS PARK RESTAURANT 1 59.72 34 0.33 31 1
Mean Total PM2.5 = 75.3088 3.595254 = Mean Total
Cigarettes
46
Table 7
Venues In Compliance
Venue
ID Venue
Phone Call, Smoking Status Mean PM2.5 Average # People Average # Cigarettes # Sample Minutes
Signage Smoking
Status
102 HAND IN HAND N 13.102 96 0 34 Y NON
103 OSTERIA 832 N 11.97 6 0 31 Y NON
112 CAFE INTERMEZZO N 8.916 17 0 43 Y NON
115 HIGHLAND TAP N 26.145 50 0 63 Y NON
219 THE ALBERT Y 106.425 54 5.6 25 Y NON
249 ATKINS PARK RESTAURANT Y 59.72 34 0.33 31 Y NON
Mean Total PM2.5 = 37.713 0.98833333 = Mean Total Cigarettes
Mean # of
Patrons= 42.8333
205 HIGHLAND CIGAR CO. Y 804.207 35 12 33 Y Y
215 FELIXS ON THE SQUARE Y 91.004 42 5 30 Y Y
216 FRIENDS ON PONCE Y 256.11 26 3.8 31 Y Y
225 EUCLID AVE YACHT CLUB Y 60.977 27 3.3 37 Y Y
242 CHARLIE G'S 11TH STREET PUB Y 106.776 13 9 36 Y Y
244 THE VORTEX BAR & GRILL Y 62.804 131 80 37 Y Y
Mean Total PM2.5 = 230.313 18.85 = Mean Total Cigarettes
Mean # of