Hydrol. Earth Syst. Sci., 13, 2055–2068, 2009 www.hydrol-earth-syst-sci.net/13/2055/2009/ © Author(s) 2009. This work is distributed under the Creative Commons Attribution 3.0 License.
Hydrology and
Earth System
Sciences
Comparison of different base flow separation methods in a lowland
catchment
A. L. Gonzales1, J. Nonner1, J. Heijkers2, and S. Uhlenbrook1,3
1UNESCO-IHE, Department of water engineering, P.O. Box 3015, 2601 DA Delft, The Netherlands 2Hoogheemraadschap de Stichtse Rijnlanden – HDSR, P.O. Box 550, 3990 GJ Houten, The Netherlands 3Delft University of Technology, Water Resources Section, P.O. Box 5048, 2600 GA Delft, The Netherlands Received: 11 March 2009 – Published in Hydrol. Earth Syst. Sci. Discuss.: 27 April 2009
Revised: 18 September 2009 – Accepted: 14 October 2009 – Published: 4 November 2009
Abstract. Assessment of water resources available in differ-ent storages and moving along differdiffer-ent pathways in a catch-ment is important for its optimal use and protection, and also for the prediction of floods and low flows. Moreover, un-derstanding of the runoff generation processes is essential for assessing the impacts of climate and land use changes on the hydrological response of a catchment. Many methods for base flow separation exist, but hardly one focuses on the specific behaviour of temperate lowland areas. This paper presents the results of a base flow separation study carried out in a lowland area in the Netherlands. In this study, field observations of precipitation, groundwater and surface water levels and discharges, together with tracer analysis are used to understand the runoff generation processes in the catch-ment. Several tracer and non-tracer based base flow separa-tion methods were applied to the discharge time series, and their results are compared.
The results show that groundwater levels react fast to pre-cipitation events in this lowland area with shallow ground-water tables. Moreover, a good correlation was found be-tween groundwater levels and discharges suggesting that most of the measured discharge also during floods comes from groundwater storage. It was estimated using tracer hy-drological approaches that approximately 90% of the total discharge is groundwater displaced by event water mainly infiltrating in the northern part of the catchment, and only the remaining 10% is surface runoff. The impact of remote recharge causing displacement of near channel groundwa-ter during floods could also be motivated with hydraulic ap-proximations. The results show further that when base flow separation is meant to identify groundwater contributions to
Correspondence to: A. L. Gonzales ([email protected])
stream flow, process based methods (e.g. the rating curve method; Kliner and Knezek, 1974) are more reliable than other simple non-tracer based methods. Also, the recursive filtering method (proposed by Eckhardt, 2005) can be cal-ibrated well using the results of tracer investigation giving good results. Consequently, non-tracer based base flow sep-aration methods that can be validated for some events may provide a powerful tool for groundwater assessment or model calibration/validation in lowland areas.
1 Introduction
Understanding runoff generation processes, i.e. source areas, pathways and retention times, is important for the predic-tion of water quantities, including floods and low flows (base flows), and water quality in a catchment (e.g. Bonell, 1998; Uhlenbrook, 2006; Eckhardt, 2008). However, these pro-cesses continue to be difficult to quantify and conceptualize (McDonnell and Tanaka, 2001; Uhlenbrook and Hoeg, 2003) and the direct measurement of each discharge component, in a continuous way and at a sufficient number of locations is practically impossible (e.g. Tardy et al., 2004). The accurate analysis of water flow pathways from rainfall to streams is also needed for the optimal protection of surface and ground-water resources (e.g. Wenninger et al., 2004). Understanding of the runoff generation processes is also essential for assess-ing the impacts of changes (e.g. land use changes, climate change) on the hydrological response of a catchment (e.g. Uhlenbrook et al., 2008).
2056 A. L. Gonzales et al.: Comparison of different base flow separation methods in a lowland catchment separation methods can be divided in two main groups:
non-tracer-based and non-tracer-based separation methods. However, most of the studies focused on mountainous catchments, and little attention has been given to lowland areas and areas that have been strongly modified by man. Thus, in this study we will focus on such a lowland study area.
1.1 Non tracer based base flow separation
The first base flow separation methods focused on the anal-ysis of the recession or depletion curves (e.g. Linsley et al., 1975; Szilagyi and Parlange, 1998) and they are capable of identifying the point where direct runoff (presumably surface runoff) finishes but they do not try to reconstruct the tempo-ral variable base flow hydrograph during floods (Dingman, 2002). Later, the first filtering base flow separation meth-ods were developed to standardize the graphical base flow separation methods (see also methodological section below): fixed interval, sliding interval and local minimum methods (Pettyjhon and Henning, 1979; Sloto and Crouse, 1996). Ba-sically, these methods take the minimum values of the hy-drograph within a pre-defined interval by following differ-ent criteria and connect them. The discharge under the con-structed line is defined as base flow accordingly. More re-cent filtering methods assume that base flow, associated as it is with discharge from groundwater storage, produces the long wave responses of the hydrograph. Hence, low pass fil-tering of the hydrograph can be used to separate base flow (Eckhardt, 2005, 2008). Other base flow separation methods use the unit hydrograph method (e.g. Su, 1995). Here, the base flow is determined by fitting a unit hydrograph model with information from the recession limbs of the hydrograph and extrapolating it backwards. Another group of methods for base flow separation are the envelope and rating curve methods (Kliner and Knezek, 1974; Sellinger, 1996; Holko et al., 2002), which assume that a close relation exists be-tween groundwater levels and stream flows during recession periods due to the hydraulic connection between the stream and aquifer. Therefore, observed groundwater levels are used to calculate base flow contributions based on previously de-fined relationships between groundwater levels and stream flows.
1.2 Tracer-based base flow separation
Hydrograph separations using hydrochemical tracers and en-vironmental isotopes offer the possibility to gain a better un-derstanding of the runoff generation processes (e.g. Bonell, 1998). For example, the use of natural tracers demonstrated that the retention of water in small catchments can be very long (e.g. Kirchner et al., 2000; McGuire and McDonnell, 2006). However, how and where the water is stored for so long in these catchments, while the hydrodynamic reaction during rain events can be very quick (cf. “hydrological para-dox”: Kirchner, 2003) is not completely understood.
This type of hydrograph separation is based on a mass bal-ance approach, which assumes that the composition or chem-ical signature of water coming from various sources is con-stant and unique (different from each other) and that conser-vation of mass applies to the water quantities and water qual-ity including conservative mixing of different water compo-nents (e.g. Weiler et al., 1999; Uhlenbrook and Hoeg, 2003). However, relatively large uncertainties may be present in the quantification of the runoff components due to a number of factors (e.g. Joerin et al., 2002). Some of these uncertain-ties are the product of tracer analyses and discharge mea-surements, intra-storm variability of isotopic concentration, elevation effect on the isotopic composition of rain, chemical reactions during runoff formation and the mixing of compo-nents, and spatial heterogeneity of tracer concentrations (see Uhlenbrook and Hoeg, 2003, for further discussion). Even though some of these uncertainties can be reduced by the use of transfer function methods (e.g. Weiler et al., 2003), the assumption of a constant and uniform signature for ev-ery component is often fulfilled within short intervals (e.g. within an event). Then, tracer based hydrograph separations can provide valuable information about the groundwater con-tributions to stream flow. However, little experience with this technique exists for low land areas.
1.3 Objectives
The objectives of this paper are (i) to compare different ap-proaches for base flow separation in a lowland area, (ii) to demonstrate how the application of different methods in con-junction with additional experimental investigation can lead to a better understanding of the runoff generation processes, and (iii) to discuss the applicability of different base flow separation methods in lowland areas. The study was carried out in a typical lowland area at Langbroekerwetering in the Netherlands.
2 Material and methods
2.1 Study area
The study area is located in the central part of The Nether-lands, in the province of Utrecht (Fig. 1). The Langbroek-erwetering area is limited by the rivers Neder Rijn in the southeast and the Kromme Rijn towards the southwest. In the North, the area is bounded by an ice pushed ridge called the Utrechtse Heuvelrug (topographic divide). The surface of the study area is 51.7 km2.
A. L. Gonzales et al.: Comparison of different base flow separation methods in a lowland catchment 2057
[image:3.595.99.497.70.305.2]23
Figure 1. The research area Langbroekerwetering, located in the center of The Netherlands.
Fig. 1. The research area Langbroekerwetering, located in the center of The Netherlands.
amount in April is 46.5 mm (the driest month) and 80 mm in December (the wettest month). The mean annual poten-tial evapotranspiration has been estimated at about 500 mm based on daily potential evapotranspiration data using the Penman-Monteith approach (Huang, 2007).
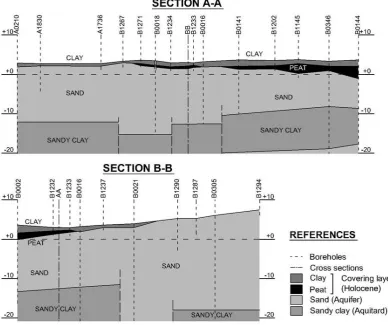
The highest area of the catchment is located at the Utrechtse Heuvelrug, an ice pushed ridge of about 60 m. The ridge is characterized by sandy permeable soils. In this area infiltration and recharge of groundwater takes place. At the bottom of the ridge, the catchment becomes very flat, with an altitude between 3 and 5 m a.s.l. Here, the lithology consists of series of alternating marine sediments (clays, sandy clays) and fluvial deposits (coarse sands) overlain in the lowest ar-eas by peat and clay deposits, also known as the covering layer (Huang, 2007) (Fig. 2). The low lying area constitutes a groundwater discharge area with seepage rates that have been estimated by Veldhuizen et al. (2009) at 1 to 2 mm/d (annual average).
The surface drainage system of the study area is very dense as is typical in Dutch lowland areas. It consists of a set of canals and ditches that were designed to maintain appropriate groundwater levels according to the land use requirements. The water levels are kept as constant as possible, but they are kept slightly lower during winter times (about 0.1–0.3 m), in order to create storage capacity in the channel network for potential winter floods caused by excessive rainfall. Control is achieved by the use of weirs and inlets. Weirs are control devices placed at different locations along the canals. Inlets are gate devices that let water flow into the study area. As typical in low lands, when floods take place water may leave
the area at various points due to the flat topography (includ-ing change of flow directions).
2.2 General methodological approach
Understanding of the runoff generation process involves many aspects that can be summarized in three main steps: (i) familiarization with the physical environment where the processes take place e.g. hydrogeology, topography and sur-face drainage system, (ii) observation of different state vari-ables at different locations e.g. groundwater levels, soil mois-ture, surface water levels and chemical/isotopic compositions etc., and (iii) formulation of a conceptual model of the water flow through the catchment and identification of the domi-nating runoff generation processes. Each of these steps may comprise activities at the catchment scale and at the local field scale. The activities at the catchment scale are neces-sary to gain insights on the hydrological heterogeneity of the area and its influence on the catchment scale responses. The work at the field scale contributes to the identification of the dominating runoff generation processes.
2058 A. L. Gonzales et al.: Comparison of different base flow separation methods in a lowland catchment
24 Figure 2. Hydrogeological set-up of the study area, including typical cross sections and
[image:4.595.99.488.67.392.2]locations of exploration boreholes
Fig. 2. Hydrogeological set-up of the study area, including typical cross sections and locations of exploration boreholes.
In this study, tracer-based hydrograph separation methods were compared with the following non-tracer-based meth-ods: (i) simple graphical approach (Linsley et al., 1975), (ii) filtering methods (Sloto and Crouse, 1996), (iii) recursive filtering (Eckhardt, 2005), (iv) unit hydrograph method (Su, 1995), and (v) rating curve method (Sellinger, 1996; Kliner and Knezek, 1974). Each of these methods represents a dif-ferent approach to base flow separation. Methods i and ii are classical methods frequently used in engineering appli-cations. Method iii is a new recursive filtering method that improves its predecessors (see Eckhardt, 2005, for more de-tails). Method iv is an alternative approach that reconstruct the base flow hydrograph raising limb with information of the recession limb. Method v takes advantage of the intrinsic relation between groundwater levels and base flow.
2.3 Field and laboratory methods
Field activities were carried out during the winter period from December 2007 up to March 2008. These activities include the drilling of observation wells, the collection and characterization of soil samples at different locations and depths, the set up of a groundwater monitoring network, and water sampling during floods and low flows.
2.3.1 Meteorological and hydrometric data
Hourly hydroclimatic data from the meteorological station in De Bilt were obtained from the KNMI, the Royal Meteoro-logical Institute of The Netherlands. The station is located 18 km north-west of the study area. It can be assumed that these data are representative for the area since the geograph-ical conditions are similar. Precipitation during the investi-gation period is dominated by advective rainfall events that have relatively low intensities and cover a wide area com-pared to convective events during summer.
Continuous discharge measurement of flows leaving the catchment and water inflows at the perimeter of the study area are carried out by the Water Board Stichtse Rijnlanden (HDSR) at the weirs and inlets used to control the levels in the area. For the purpose of this paper, the attention is fo-cused on the discharges at the main outlet of the catchment which is controlled by weir W28 (see Fig. 1).
2.3.2 Groundwater and surface water levels
A. L. Gonzales et al.: Comparison of different base flow separation methods in a lowland catchment 2059
[image:5.595.98.299.66.257.2]25
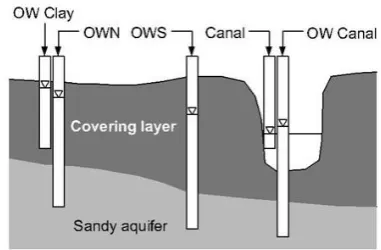
Figure 3. Experimental field set-up and location of observation wells
Fig. 3. Experimental field set-up and location of observation wells.
[image:5.595.305.496.90.215.2]observation wells and one was installed in the clay layer (covering layer) next to an existing observation well (see Fig. 2 for cross sections). The other five wells were installed at an experimental field (approximately 3200 m2)that is sur-rounded by canals (Fig. 3). At this field groundwater dis-charge processes were studied at the field scale whereby one well was located in the covering clay layer (OWClay), three in the sandy aquifer right under the clay layer and one in the sandy aquifer under the Langbroekerwetering canal (OW-Canal). To monitor the interactions of groundwater and sur-face water, sursur-face water levels were also observed in the Langbroekerwetering canal, next to the experimental field. All these water level measurements were recorded with au-tomatic data loggers (Divers), with a time step of 15 min. 2.3.3 Hydrochemistry and environmental isotopes
Water chemistry was monitored during the research period by collecting water samples. The samples were taken at dif-ferent stages of the water cycle: rainfall (one sample per event), ponded water, groundwater at the five observation wells at the experimental field (once per week), and at the main stream flow at the outlet of the catchment (time inter-vals: 4 h during the rising limb and shortly after the runoff peak and 8 h during recession periods).
Electric conductivity, pH and HCO−3 were measured in situ. Water samples were analyzed in the laboratory for ma-jor anions (Cl−, NO3−and SO24−)and major cations (Na+, K+Ca2+, Mg2+, Fe2+and Mn2+)using an ion chromato-graph (ICS-1000, Dionex), and for dissolved silica (SiO2) using a plasma ion chromatograph (Optima 3000, Perkin Elmer). The environmental isotopes deuterium and18O were analyzed using a mass spectrometer for a selected set of sam-ples corresponding to the flood event from 31 January to 5 February.
2.4 Base flow separation methods
2.4.1 Runoff component separation using tracers
To carry out tracer based component separation the hydro-chemical and/or isotopic composition of the water is deter-mined in order to identify the characteristic signature of wa-ter coming from different source areas and having different ages, e.g. deep groundwater, shallow groundwater, overland flow and precipitation. For doing a three-component sepa-ration an end member mixing analysis (EMMA; see Hooper et al., 1990; Christophersen et al., 1990) was carried out in order to define the hydrochemical signature of each compo-nent.
Assuming that the chemical composition of all investi-gated components is constant and significantly different, and that the mixing is conservative, the separation is calculated using the mass balance method by solving the following lin-ear mixing equations:
ci,1q1+ci,2q2+ ··· +ci,jqj+ ··· +ci,nqn=ci,TqT (1)
2060 A. L. Gonzales et al.: Comparison of different base flow separation methods in a lowland catchment 2.4.2 Simple graphical approach
Various approaches exist for performing graphical base flow separation; however, only one of them is applied in this study. To determine the end of the direct runoff contribution (usu-ally assumed as surface runoff), the hydrograph is plotted on a semi-logarithmic scale and the groundwater recession curve can be identified as an approximately straight line, as-suming groundwater flow can be approximated with the lin-ear reservoir concept. It is assumed that the point where this line deviates from the hydrograph marks the end of the surface runoff, the hydrograph is from then on controlled by groundwater discharge (Linsley et al., 1975). A simple straight line of this point with the time at the beginning of the flood event (before surface runoff is noticeable) is used to separate the base flow during a flood event. The method is based on the assumption that the base flow response (which equals groundwater discharge) is significantly slower com-pared to the surface runoff, which is not always the case as shown in numerous case studies in mountainous areas (e.g. Bonell, 1998; McDonnell and Tanaka, 2001; Uhlenbrook and Hoeg, 2003).
2.4.3 Filtering methods
Pettyjhon and Henning (1979) formulated three base flow separation methods with the objective of processing long records of groundwater discharge data: (i) fixed interval (also known as Hysep 1), (ii) sliding interval (Hysep 2), and (iii) local minimum methods (Hysep 3), which are also called filtering separation methods. As explained in Sect. 1.1, these methods take the minimum values of the hydrograph within an interval by following different criteria and connect them. The discharge under the constructed line is defined as base flow accordingly (see Sloto and Crouse, 1996, for detailed description). The advantage of these methods is that they are standardized (objective) and systematic and, therefore, they can be easily translated into computer code to reduce the time required for computation and to avoid inconsistencies inher-ent to manual methods (Sloto and Crouse, 1996).
Pettyjohn and Henning (1979) and Sloto and Crouse (1996) defined the analysis interval size 2N∗used in these methods as the odd integer between 3 and 11 nearest to 2N (withN in days), where N is the estimated time from the peak of the hydrograph to the end of the surface runoff according to Eq. (4) (equation proposed by Linsley et al., 1975). However, discharge time series may be presented with time steps other than days. This was the case for the study ar-eas where very high resolution data is available and needed to account for the temporal dynamics. Therefore, for this study, the interval 2N∗is redefined as:
2N∗ =2
N
1t
+1 (3)
N=0.8A0.2 (4)
where 2N∗is the interval size in number of time steps,Nis the time from the peak of the hydrograph to the point where the direct runoff finishes in days,Ais the area of the catch-ment in square kilometers, and1t is the time step of the dis-charge’s record in days/time step.
2.4.4 Recursive filtering method
Various methods of this type exist e.g. Lyne and Hol-lick (1979), Chapman (1991), Wittenberg (1999), Eckhardt (2005), Aksoy (2008), etc. In this study, the general approach proposed by Eckhardt (2005) is used to perform low pass fil-tering on the hydrograph in order to separate base flow (see Eq. 5). This recursive filter requires the determination of two parameters (Eckhardt, 2008): (i) the recession constanta, which can be derived from statistical analysis of the reces-sion curves of the hydrograph, and (ii) the maximum value of the base flow index BFImax, which can not be measured, but optimized according to the results of other approaches (Eckhardt, 2005). In this research, BFImax was obtained by minimizing the root mean square deviations from the results of base flow separation using dissolved silica, which are be-lieved to give a fair separation between groundwater and sur-face runoff. Note, that Eckhardt (2008) already suggested to use tracer data to calibrate the parameter BFImax, but the necessary data was not available for his study.
bk=
(1−BFImax)abk−1+(1−a)BFImaxyk 1−aBFImax
(5) Whereyk (m3/s) is the total flow at timekandbk (m3/s) is the base flow at timek, subject tobk≤yk.
2.4.5 Unit Hydrograph method
This approach is based on the principle that an impulse in-put of recharged water into the subsurface system produces a response output in a similar way as an impulse of effective precipitation produces a response of surface runoff. Since the unit hydrograph is a model for a linear hydrologic system, its solutions follow the principles of proportionality and super-position (Su, 1995). As proposed by Su (1995), the Nash’s cascade reservoir model is used to represent mathematically the base flow unit hydrograph, where the groundwater water-shed is represented by a series ofεidentical linear reservoirs, each of them having the same storage constantk(d). The ac-tual base flowQ(t )(m3/s) for a total rechargeR(mm) can be written as:
Q(t )=R 1 k0(ε) t k ε−1 e
−t/
k (6)
Or simply:
Q(t )=Atθeφ·t (7)
A. L. Gonzales et al.: Comparison of different base flow separation methods in a lowland catchment 2061 model was then used to construct the total base flow
hydro-graph, including the rising limbs. 2.4.6 Rating curve method
This method assumes that there is a relationship between groundwater levels and discharge in the stream during reces-sion periods. Kliner and Knezek (1974) propose to determine this relation by fitting an envelope to all the available data from groundwater levels versus discharge measurements. In-stead, Sellinger (1996) proposes to fit a curve only to the data corresponding to the recession limbs. Theoretically, both ap-proaches should give similar results and for ease of calcula-tion, the second approach was followed in this work. The potential relation that Sellinger (1996) proposes was not suc-cessful in this research. Therefore, the exponential function shown by Eq. (8) was applied with good results. The term Q0(m3/s) was introduced to account for a constant discharge coming from the deeper aquifer.
Q=AeBh+Q0 (8)
WhereQ(m3/s) is the discharge at the outlet of the catch-ment,h(m) is the groundwater level in an observation well, or an average groundwater level over the catchment, andA (m3/s),B(1/m) andQ0(m3/s) are fitting parameters, which can be determined e.g. with the least squares method using observed discharge (Q)and water level data (h) correspond-ing to the recession limb of the hydrograph after the sur-face runoff is over. The starting point of pure groundwater discharge may be determined approximately using Linsley’s formula (see Eq. 4). The analysis has to be applied separately for each event.
2.5 Response time of the aquifer system
In order to fully analyse the runoff generation for the study area, it is also necessary to become familiar with the concept of the response time of an aquifer system. Assuming that in the study area the first aquifer under the covering layer is a confined aquifer, it is possible to calculate the time that an impulse, i.e. a recharge event at the upper boundary of the covering layer, takes to produce a maximum level rise at an observation well within the covering layer area. The following equations hold (they are also known as impulse-response function) (Venetis, 1970; Olsthoorn, 2007): 1h(x,t )=1h(x=0,t=0)
u t√πe
−u2 (9)
u=
s x2S
4kDt (10)
Where1h(x,t )(m) is the increase in water level at a distance x (m) from the recharge area to an observation well in the area within the covering layer and at a timet (d) since the occurrence of the impulse1h(x=0,t=0)(m).
3 Results
3.1 Rainfall runoff observations
Figure 4 shows the precipitation, the discharge at the main outlet of the catchment (W28) and the water levels in the cov-ering layer, in the first aquifer where the covcov-ering layer is not present (B343), 20 m from the canal (OWN), right under the canal (OWCanal), and in the canal itself (SW) at the exper-imental field during the research period. The measurements reveal an immediate response of the groundwater levels to the rainfall events and also a good correlation (R2=0.86) be-tween groundwater levels in the first aquifer and discharges can be observed.
The observed groundwater levels also show that during the research period in winter 2008 rain water infiltrates and recharges the first aquifer (confined aquifer) since water lev-els in the covering clay layer at the experimental field (OW-Clay) are always higher than water levels in the first aquifer (OWN, OWS). However, recharge rates where the covering layer is present are likely to be small as a result of the com-pact clay separating the surface from the first aquifer. This can only happen with significant preferential flows trough the clay layer. On the other hand, more to the north, towards the Utrechtse Heuvelrug ice pushed ridge, where the compact clays are thin or non-existent, recharge into the first aquifer will be much larger. Water level observations also show that there is a permanent discharge of groundwater to the canals, in particular during floods. This is shown by the water levels in the canal (SW) being always lower than the groundwater levels in the first aquifer, right under the canal (OWCanal).
The changes in groundwater levels show a fast reaction to precipitation events. The fast reactions of groundwater lev-els in the first aquifer could be the result of water infiltration directly into the first aquifer at the northern boundary of the covering layer, which is displacing groundwater towards the canals in a piston flow process. Based on Eqs. (9) and (10) and considering an average length of the confined aquifer (x) of 800 m, an average thickness (D) of 10 m, and a saturated hydraulic conductivity (k) of 30 m/d and a storativity (S) of 0.00137 m/m (Saliha et al., 2004), a response time could be computed. Convolution of the impulse-response function for the precipitation event of 2 December results in a time to the peak of the response in the groundwater levels next to the canal of approximately 16 h (0.67 d), which coincides with the delay of the reaction observed in the field. In the cover-ing layer (OWClay) the peak of the groundwater head occurs later.
3.2 Tracer-based two-component separation
2062 A. L. Gonzales et al.: Comparison of different base flow separation methods in a lowland catchment
26
Figure 4. Precipitation (mm) (
∆
t=4 hours), discharge (m3/s) and ground and surface water
[image:8.595.99.497.64.261.2]levels (m) observed during the research period.
Fig. 4. Precipitation (mm) (1t=4 h), discharge (m3/s) and ground and surface water levels (m) observed during the research period.
both cases, the two separated components are surface runoff, composed of channel precipitation and overland flow, and groundwater contributions associated with deeper and older (pre-event) groundwater components.
3.2.1 Two-component separation using EC, Ca and Mg
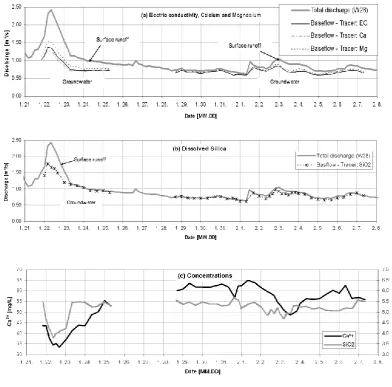
The calcium concentrations of rainwater varied for each event, ranging from 0 to 5.7 mg/L. They are low compared to the concentrations measured in groundwater and stream water. Therefore, an average concentration of 1.43 mg/L was used as the characteristic signature of surface runoff, as-suming that the rainwater concentration is representative for this component. Calcium concentrations observed in wells showed variations in time and space, with values ranging be-tween 55 and 120 mg/L. These variations are probably the result of the geochemical heterogeneity of the area. The cal-cium concentrations at the outlet of the catchment (W28) varied between 33 and 70 mg/L, They show an inverse re-lation with the discharge: a decrease with the increase of discharge and vice versa. Based on its typical concentration during low flow conditions, it can be concluded that the av-eraged calcium concentration of groundwater over the whole area of the catchment is around 67 mg/L. Electric conductiv-ity and magnesium show the same behavior as calcium, and the end member concentrations were estimated following a similar procedure. The separations based on these three trac-ers yielded similar results (see Fig. 5). It is observed that approximately 20% of the measured discharge corresponds to surface runoff.
3.2.2 Two-component separation using dissolved silica (SiO2)
Dissolution of silicate minerals is a slow process (e.g. Apello and Postma, 2005). Considering that the contact time of overland flow with the soil is short, it can be assumed that the dissolved silica concentration in overland flow does not change. Hence, it is assumed that the concentration of dis-solved silica in surface runoff water is similar to the concen-tration in rain water which is negligible (0.0 mg/L). Concen-trations of dissolved silica observed in groundwater varied between 5.0 to 15.0 mg/l. The concentration observed in the stream, at the outlet of the catchment, during low flow pe-riods (5.5 mg/l), is considered as a representative concentra-tion of dissolved silica in groundwater. Two-component sep-aration using dissolved silica shows that only a small amount of the discharge during floods at the outlet, in the order of 10%, is surface runoff. The remainder is groundwater. 3.3 Tracer-based three-component separation
A. L. Gonzales et al.: Comparison of different base flow separation methods in a lowland catchment 2063
Fig. 5. Results of two-component separations using hydrochemical tracers. (a) surface runoff and groundwater separations using EC, Ca
and Mg as tracers, (b) surface runoff and groundwater separation using dissolved silica, and (c) Calcium and dissolved silica concentrations measured in the stream at the outlet of the catchment (mg/L).
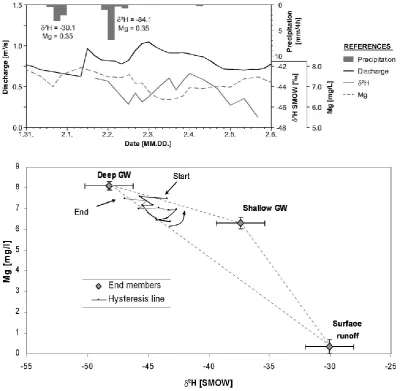
channel network) are considered as one component (sur-face runoff) during this tracer analysis. Deuterium was an-alyzed for only one deep groundwater sample (−48.2‰) at OWCanal, the observation well positioned right under the canal. The concentration of magnesium in the deep ground-water component was determined as the concentration in the stream at the outlet of the catchment during recession peri-ods: 8.10 mg/l. Magnesium in groundwater samples varied from 6.3 to 16.4 mg/l. It is assumed that a reasonable time af-ter the precipitation event, shallow groundwaaf-ter contribution to stream flow is zero or negligible. In the shallow ground-water component the end member concentrations were esti-mated as an average of the concentrations observed in the clay layer (OWClay):−37.4‰ and 6.30 mg/L.
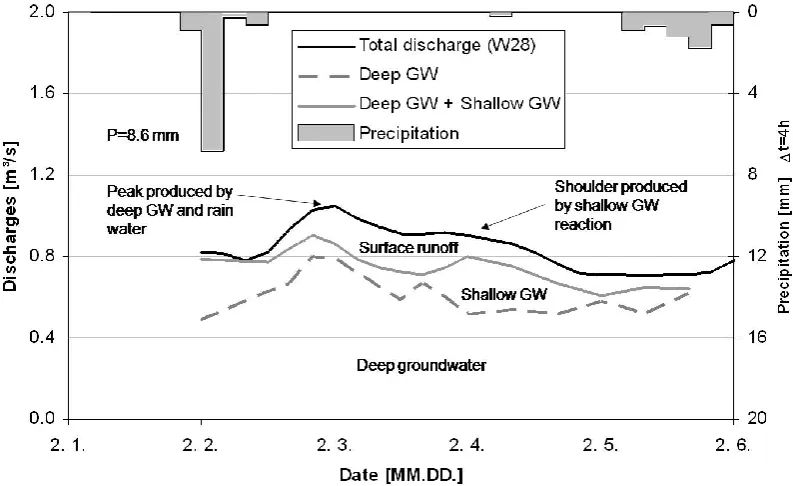
Results of the separation reveal that the discharge peak is mainly produced by surface runoff and deep groundwa-ter and to a lesser extent by shallow groundwagroundwa-ter. The fast reaction of deep groundwater can be explained through
mo-bilised groundwater that is displaced to the surface drainage system very likely by water infiltrating at the northern bound-ary of the covering layer in the catchment (see above). Fur-thermore, it can be observed that shallow groundwater shows a delayed reaction compared to surface runoff, which gener-ates a shoulder (secondary peak) in the recession limb of the hydrograph. It is also worth noting, that surface runoff is slowly drained out of the catchment, being present as dis-charge component even some days after the rain event (see Fig. 7).
3.4 Non-tracer-based hydrograph separation
2064 A. L. Gonzales et al.: Comparison of different base flow separation methods in a lowland catchment
Fig. 6. End member analysis for three-component separation: (a) Precipitation, discharge and temporal variation ofδ2H and Mg during the period between 1–5 February. (b) EMMA diagram for the three-component separation consideringδ2H and Mg as tracers. The evolution of the concentrations in the stream is shown as a polygon with colour degradation from black to grey corresponding to the start and end respectively.
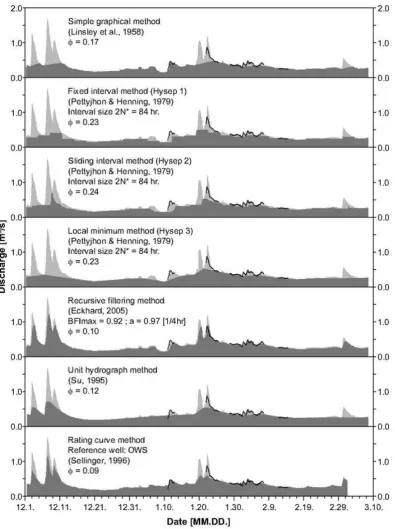
the different non-tracer-hydrograph separation methods are shown in Fig. 8. Each of them is compared to the two-component separation using dissolved silica as reference, which separates surface runoff from groundwater. For com-parison purposes, the direct runoff ratio is defined as total direct runoff divided by the total discharge in the stream dur-ing the investigation period.
4 Discussion
Water level observations at the experimental field site re-vealed a fast groundwater reaction to the precipitation events in the studied lowland area. A simplified analysis of the re-action time in the first aquifer (see Sect. 3.1) shows that the reaction of the first aquifer may be related also to the recharge taking place in the northern part of the catchment, where the
A. L. Gonzales et al.: Comparison of different base flow separation methods in a lowland catchment 2065
Fig. 7. Three-component separation considering Mg andδ2H as tracers.
Two-component tracer-based separations with dissolved silica, on the one hand, and using the hydrochemical trac-ers EC, Ca and Mg on the other hand give results that are in line with the hydraulic investigations discussed above. Two-component separations using dissolved silica indicate that approximately 90% of the flow at the outlet of the catchment originates from groundwater, while separations using EC, Ca and Mg point at an 80% of groundwater present in the total discharge. The approximately 10% difference between these two separations may be attributed to the uncertainties in the assessment of the end member concentrations. Within this frame, it is important to realize that dissolved silica is consid-ered a largely conservative tracer (e.g. Uhlenbrook and Hoeg, 2003) while EC, Ca and Mg are non-conservative tracers. Therefore, it is assumed that the separation performed with dissolved silica is more reliable. The 10% difference could also be attributed to the presence of different groundwater fluxes during the event, i.e. shallow versus deeper compo-nents that have different end members (see three-component separation). However, detailed water quality data along the depth of the aquifer are needed to prove this hypothesis.
The three-component separation also points at an impor-tant groundwater contribution, though the analysis could only be carried out for a relatively small event. Certainly, the deep groundwater peak resembles the deep groundwater wa-ter peak observed in the two-component separations confirm-ing that groundwater is beconfirm-ing displaced into the canals. Fur-thermore, it could be seen that shallow groundwater reaches the outlet later inducing a shoulder like shape into the hydro-graph.
In the two-component separation with dissolved silica as well as in the three-component separation withδ2H and Mg, it is assumed that overland flow takes up negligible amounts of the solutes which makes it possible to approximate its hy-drochemistry with the one observed in rain water. This as-sumption is fair considering the slow kinetics of silica disso-lution, the limited availability of Mg-sources on the soil sur-face, the conservative behaviour of deuterium, and the fact that mixing with other water at the surface seems negligible. However, a more detailed observation of the overland flow formation and its chemical composition is needed in future studies to verify these assumptions and to better understand the role of overland flow generation in such a low land.
All these physical parameter observations and tracer ex-periments show that groundwater is the main component of runoff in the studied lowland catchment. Generalization for all lowlands is not straight forward because there is a major role of the physical characteristics of the catchment (e.g. hy-drogeology, land use, land cover). However, most lowland areas undergo similar geomorphological processes (e.g. sed-imentation in alternating marine and fluvial environments), and it is possible to say that in most of them groundwater is likely to be the main component of runoff.
2066 A. L. Gonzales et al.: Comparison of different base flow separation methods in a lowland catchment
30
Figure 8. Results obtained with different non-tracer based base flow separation methods and
[image:12.595.104.500.60.590.2]comparison with the surface runoff/groundwater separation using dissolved silica as tracer
Fig. 8. Results obtained with different non-tracer based base flow separation methods and comparison with the surface runoff/groundwater
separation using dissolved silica as tracer (black line);φgives the mean direct runoff ratio defined as total direct runoff divided by the total discharge in the stream during the investigation period.
the benchmark separation technique. The unit hydrograph method (Su, 1995) resulted in a lower mean direct runoff ra-tio, 0.12. However, the results still do not represent the dy-namic groundwater-surface runoff interactions as they can be observed in the separation using dissolved silica.
A. L. Gonzales et al.: Comparison of different base flow separation methods in a lowland catchment 2067 does not only show that there is an important groundwater
contribution during the flood events, but the separated base flow also follows the temporal course of the groundwater discharge obtained in the separation using dissolved silica. Finally, it can be observed that recursive filtering method (Eckhardt, 2005) gives the best results, if compared to the separation using dissolved silica, with a direct runoff ration of 0.10. This is not a surprise since the BFImax parameter of this method was calibrated with the results of the separa-tion with dissolved silica, thus a good agreement of the two methods was expected.
5 Conclusions
The simplified analysis of the reaction time in the first aquifer, the good correlation observed between groundwater levels and discharges at the outlet of the catchment, and the tracer analyses (two and three component tracer-based sepa-rations), all of them indicate that groundwater displacement in a piston flow is the main process in runoff generation in the studied lowland. The importance of groundwater flow in runoff generation may be generalized to most flat lowland areas where topography and land use/cover do not favour sur-face runoff generation.
In general, tracer-based hydrograph separation methods agreed well with other field observations and proved to be useful to gain further insight in to the runoff generation pro-cesses in the studied lowland catchment. However, they may not be practical and economic in the long run and it is not possible to apply them to past discharge time series if no chemical/isotopic data of stream water and main source ar-eas are available, which is usually the case. Therefore, it is necessary to use non-tracer-based base flow separation meth-ods that still give meaningful insights in to the groundwater discharge of a catchment.
It was demonstrated that in the investigated lowland area, different non-tracer-based methods yield different separation results, which may be the case in most lowland areas. Conse-quently, the selection of an appropriate method is an impor-tant issue. Furthermore, the results show how tracer-based separations can be used to validate the results of the selected method. For the study area, the base flow separation method which identified the groundwater component of stream flow the best were the rating curve/envelope method (Sellinger, 1996; Kliner and Knezek, 1974) and the recursive filter-ing methods from Eckhardt (2005). The first method also gave good results in different mountainous areas (Kliner and Knezek, 1974; Holko et al., 2002). However, groundwater level measurements are needed for this method. The recur-sive filtering method provided in particular very satisfactory results when it was calibrated with the results of tracer inves-tigations as suggested by Eckhardt (2005).
It is concluded that Eckhardt’s recursive filtering method is suitable base flow separation in lowland areas when
cali-bration of the BFImax parameter is performed with the use of tracer experiments. When groundwater level observations are available, the rating curve/envelope method is straight forward.
Finally, it was demonstrated that the results of verified non-tracer based methods can be used for estimating ground-water discharge in a low land catchment. This is essential, for instance, for groundwater or surface water model calibra-tion/validation, water resources assessment etc. Future re-search will concentrate on these aspects with respect to the applicability to the hydrological conditions in low lands. Acknowledgements. This study was supported by the Watermill
Project of UNESCO-IHE and the Hoogheemraadschap de Stichtse Rijnlanden (HDSR), the Netherlands. Data for this research was kindly provided by the following institutions: HDSR (information on the study area and discharge time series), KNMI (hydroclimatic time series) and Vrije University of Amsterdam (analysis of water samples for the environmental isotopes deuterium and18O). Edited by: E. Zehe
References
Appelo, C. A. J. and Postma, D.: Geochemistry, groundwater and pollution, A.A. Balkema, 2005.
Aksoy, H., Unal, N. E., and Pektas, A. O.: Smoothed minima base?ow separation tool for perennial and intermittent streams, Hydrol. Processes, 22, 4467–4476, 2008.
Chapman, T. G.: Comment on “Evaluation of automated techniques for base ?ow and recession analyses” by R. J. Nathan and T. A. McMahon, Water Resour. Res., 27, 1783–1784, 1991.
Christophersen, N., Neal, C., and Hooper, R. P.: Modeling streamwater chemistry as a mixture of soil water endmembers, a step towards second generation acidification models, J. Hydrol., 116, 307–320, 1990.
Dingman, S. L.: Physical hydrology, Prentice Hall, 2002.
Eckhardt, K.: How to construct recursive digital filters for base flow separation, Hydrol. Processes, 19, 507–515, 2005.
Eckhardt, K.: A comparison of base flow indices, which were cal-culated with seven different base flow separation methods, J. Hy-drol., 352, 168–173, 2008.
Hall, F. R.: Base-flow recessions – A review, Water Resour. Res., 4(5), 973–983, 1968.
2068 A. L. Gonzales et al.: Comparison of different base flow separation methods in a lowland catchment
Joerin, C., Beven, K. J., Iorgulescu, I., and Musy, A.: Uncertainty in hydrograph separations based on geochemical mixing models, J. Hydrol., 255(1–4), 90–106, 2002.
Kirchner, J. W., Feng, X., and Neal, C.: Fractal stream chemistry and its implications for contaminant transport in catchments, Na-ture, 403, 524–527, 2000.
Kirchner, J. W.: A double paradox in catchment hydrology and geo-chemistry, Hydrol. Processes, 17, 871–874, 2003.
Kliner, K. and Knezek, M.: The underground runoff separation method making use of the observation of ground water table, Hy-drology and hydromechanics, XXII(5), 457–466, 1974. Linsley, R. K., Kohler, M. A., and Paulhus, J. L. H.: Hydrology for
engineers, McGraw-Hill, 1975.
Lyne, V. D. and Hollick, M.: Stochastic time-variable rainfall runoff modelling. Hydrology and Water Resources Symposium, Institu-tion of Engineers Australia, Perth, 89–92, 1979.
McDonnell, J. J. and Tanaka, T. (Eds.): Hydrology and biogeo-chemistry of forested catchments, Special issue of Hydrological Processes, 15(9), 2001.
McGuire, K. J. and McDonnell, J. J.: A review and evaluation of catchment transit time modeling, J. Hydrol., 330, 543–563, 2006. Olsthoorn, T. N.: Do a bit more with convolution, Groundwater,
46(1), 13–22, 2007.
Pettyjohn, W. A. and Henning, R.: Preliminary estimate of ground-water recharge rates, related streamflow and ground-water quality in Ohio: Ohio State. University Water Resources Center, Project Completion Report Number 552, 323, 1979.
Saliha, A. H., Zhengyue, J., De Laat, P., and Nonner, J.: Mod-elling the Western Betuwe Area. Water Science and Engineering – Hydrology and Water Resources, Delft, International Institute for Infrastructural, Hydraulic and Environmental Engineering – IHE. Master of Science: 155, 2004.
Sellinger, C. E.: Computer program for performing hydrograph sep-aration using the rating curve method, US Department of Com-merce, National Oceanic and Atmospheric Administration, Tech-nical Memorandum ERL GLERL-100, 1996.
Sloto, R. A. and Crouse, M. Y.: HYSEP: A computer program for streamflow hydrograph separation and analysis, US Geological Survey, Water Resources Investigation Report, 96-4040, 1996. Su, N.: The unit hydrograph model for hydrograph separation,
En-vironment International, 21(5), 509–515, 1995.
Szilagyi, J. and Parlange, M. B.: Base flow separation based on an-alytical solutions of the Boussinesq equation, J. Hydrol., 204(1– 4), 251–260, 1998.
Tallaksen, L. M.: A review of base flow recession analysis, J. Hy-drol., 165, 149–370, 1995.
Tardy, Y., Bustillo, V., and Boeglin, J. L.: Geochemistry applied to the watershed survey: hydrograph separation, erosion and soil dynamics. A case study: the basin of the Niger River, Africa, Appl. Geochemistry, 4, 469–518, 2004.
Uhlenbrook, S., Frey, M., Leibundgut, C., and Maloszewski, P.: Hy-drograph separations in a mesoscale mountainous basin at event and seasonal timescales, Water Resour. Res., 38(6), 31-1/31-14, 2002.
Uhlenbrook, S. and Hoeg, S.: Quantifying uncertainties in tracer-based hydrograph separations: a case study for two three and five-component hydrograph separations in a mountainous catch-ment, Hydrol. Processes, 17, 431–453, 2003.
Uhlenbrook, S.: Catchment hydrology – a science in which all processes are preferential, Hydrol. Processes, HPToday, 20(16), 3581–3585, doi:10.1002/hyp.6564, 2006.
Uhlenbrook, S., Didszun, J., and Wenninger, J.: Source areas and mixing of runoff components at the hillslope scale – A multi-technical approach, Hydrol. Sci. J., 53(4), 741–753, 2008. Veldhuizen, A. A., Heijkers, J., Borren, W., Nijsten, G. J., and
La-gendijk, V.: HYDROMEDAH: Development of an integrated hy-drological modelling toolkit & database for Hoogheemraadschap De Stichtse Rijnlanden, in preperation, 2009 (in Dutch). Venetis, C.: Finite aquifers: Characteristic responses and
applica-tions, J. Hydrol., 12(1–2), 53–62, 1970.
Weiler, M., Scherrer, S., Naef, F., and Burlando, P.: Hydro-graph separation of runoff components based on measuring hy-draulic state variables, tracer experiments, and weighting meth-ods, IAHS Publications, 258, 249–255, 1999.
Weiler, M., McGlynn, B. L., McGuire, K. J., and McDonnell, J. J.: How does rainfall become runoff? A combined tracer and runoff transfer function approach, Water Resour. Res., 39(11), 4-1/4-13, 2003.
Wenninger, J., Uhlenbrook, S., Tilch, N., and Leibundgut, C.: Ex-perimental evidence of fast groundwater responses in a hills-lope/floodplain area in the Black Forest Mountains, Germany, Hydrol. Processes, 18(17), 3305–3322, 2004.