www.hydrol-earth-syst-sci.net/17/4367/2013/ doi:10.5194/hess-17-4367-2013
© Author(s) 2013. CC Attribution 3.0 License.
Hydrology and
Earth System
Sciences
Modeling root reinforcement using a root-failure Weibull
survival function
M. Schwarz1,2,3, F. Giadrossich4,5, and D. Cohen6,7
1Bern University of Applied Sciences (BFH), Langgasse 85, 3052 Zollikofen, Switzerland 2Swiss Federal Institute for Forest, Snow and Landscape Research (WSL), Zurcherstrasse 111, 8903 Birmensdorf, Switzerland
3EcorisQ, route des trois villages, 38660 Saint Hilaire du Touvet, France
4Department of Agriculture, University of Sassari, via Enrico de Nicola 1, 07100 Sassari, Italy 5Nucleo Ricerca Desertificazione (NRD), viale Italia 39, 07100 Sassari, Italy
6Institute for Environmental Sciences, University of Geneva, Route de Drize 7, 1227 Carouge, Switzerland
7Department of Geological and Atmospheric Sciences, Iowa State University, 253 Science I, Ames, IA 50011, USA
Correspondence to: M. Schwarz ([email protected])
Received: 10 March 2013 – Published in Hydrol. Earth Syst. Sci. Discuss.: 22 March 2013 Revised: 25 September 2013 – Accepted: 3 October 2013 – Published: 6 November 2013
Abstract. Root networks contribute to slope stability through
complex interactions with soil that include mechanical com-pression and tension. Due to the spatial heterogeneity of root distribution and the dynamics of root turnover, the quantifi-cation of root reinforcement on steep slopes is challenging and consequently the calculation of slope stability also. Al-though considerable progress has been made, some impor-tant aspects of root mechanics remain neglected. In this study we address specifically the role of root-strength variability on the mechanical behavior of a root bundle. Many factors con-tribute to the variability of root mechanical properties even within a single class of diameter. This work presents a new approach for quantifying root reinforcement that considers the variability of mechanical properties of each root diame-ter class. Using the data of laboratory tensile tests and field pullout tests, we calibrate the parameters of the Weibull sur-vival function to implement the variability of root strength in a numerical model for the calculation of root reinforce-ment (RBMw). The results show that, for both laboratory and field data sets, the parameters of the Weibull distribution may be considered constant with the exponent equal to 2 and the normalized failure displacement equal to 1. Moreover, the results show that the variability of root strength in each root diameter class has a major influence on the behavior of a root bundle with important implications when considering differ-ent approaches in slope stability calculation. Sensitivity anal-ysis shows that the calibration of the equations of the tensile
force, the elasticity of the roots, and the root distribution are the most important steps. The new model allows the charac-terization of root reinforcement in terms of maximum pullout force, stiffness, and energy. Moreover, it simplifies the im-plementation of root reinforcement in slope stability models. The realistic quantification of root reinforcement for tensile, shear and compression behavior allows for the consideration of the stabilization effects of root networks on steep slopes and the influence that this has on the triggering of shallow landslides.
1 Introduction
of vegetation to slope stability (Phillips and Watson, 1994; Sidle, 1992; Rickli and Graf, 2009). In the last 30 yr, three distinct methods have been employed to quantify root re-inforcement. The approach of Wu et al. (1979) has been, and still is, used because of its simplicity (it requires only minimal information about root critical tensile strength and the cross-section area of roots crossing the failure surface). However, recent studies (Pollen and Simon, 2005; Schwarz et al., 2011; Cohen et al., 2011) have demonstrated that Wu et al. (1979) hypothesis that all roots break simultaneously can lead to an order-of-magnitude error in the estimation of root reinforcement and is thus untenable. More recently, Pollen and Simon (2005) used the fiber bundle model with a stress-step loading to estimate root reinforcement. The ad-vantage of this model is that roots of different dimensions do not all break at the same load. This approach, however, does not easily permit calculation of root elongation for re-alistic root bundles (e.g., roots with different apparent elas-ticities). To overcome this problem Schwarz et al. (2010c) implemented the strain-step loading approach in the Root Bundle Model (RBM). The main advantages of the RBM are (1) calculation of the complete force-displacement curve of a bundle of roots, and (2) redistribution of forces on each sin-gle root based on their geometrical and mechanical properties (and not statistically imposed). In a further simplification of the RBM, Cohen et al. (2011) proposed an analytical solu-tion implementing only the most relevant parameters (root-size distribution, root tensile force, secant Young’s modulus, length, and tortuosity).
Since Wu et al. (1979) model, the main improvements in modeling root reinforcement are (1) roots do not all break at the same time (Waldron and Dakessian, 1981; Pollen and Simon, 2005); (2) roots have different failure mechanisms, break or slip out (Waldron and Dakessian, 1981); (3) root geometry (length) and secant Young’s modulus are functions of root diameter (Waldron and Dakessian, 1981; Schwarz et al., 2010b); (4) root tortuosity affects the apparent elasticity of roots and the failure mechanism (Schwarz et al., 2011).
Based on empirical observations (Schwarz et al., 2011) and on biomechanics studies of roots (Loades et al., 2010), root mechanical properties are highly variable. Despite this evidence, all numerical and analytical models thus far imple-ment the mechanical variability of roots only as a function of their diameters, usually given as a distribution, assuming that roots within a diameter class are homogeneous. A more realistic assumption is that, for a given diameter or small di-ameter range, there is a variability due to the presence of “weak spots” related to the anatomy and geometry of roots (Loades et al., 2010). Root age, root constituents, and envi-ronmental conditions in which roots grow are important fac-tors that influence root biomechanics (Loades, 2007). All of these factors contribute to the variability of root mechanical properties. Thus, it is important to implement this variability in root reinforcement models and analyze how this variability affects the mechanical behavior of root bundles.
The objective of this work is to present a new approach for quantifying root reinforcement that considers the intrin-sic variability of mechanical properties of roots of similar di-ameters. The new model is presented in Sect. 2. In Sect. 3 we present new field and laboratory root strength data used for the calibration and validation of the model (Sect. 4). A dis-cussion of the model and comparisons with others is given in Sect. 5.
2 Model description
2.1 Root geometry and mechanics
We assume that each root is a linear-elastic fiber that breaks at a threshold displacement. Although roots stretched in ten-sile tests in the laboratory show a decrease in the slope of the stress–strain curve associated with plastic behavior (Waldron and Dakessian, 1981; Loades et al., 2013), cyclic laboratory pullout tests of Czarnes et al. (1999) of roots in soil show lit-tle irreversible deformation (less than 5 %), supporting the use of a linear model for roots. Then, estimating the ten-sile force in a root using the fundamental equation of lin-ear elasticity requires knowledge of its geometry (diameter, length, tortuosity) and mechanical properties (maximum ten-sile force, Young’s modulus).
Data on roots (Operstein and Frydman, 2000; Schmidt et al., 2001; Ammann et al., 2009; Schwarz et al., 2011; Giadrossich et al., 2013) provide support for modeling the average root length,L, the average maximum tensile force,
Fmax, and the average Young’s modulus, E, as power-law functions of root diameter (φ):
L(φ)=L0 φ
φ0 γ
, (1)
Fmax(φ)=F0 φ
φ0 ξ
, (2)
E(φ)=E0 φ
φ0 β
, (3)
whereφ0,L0,F0, andE0are scaling factors andγ,ξ, and
βpower-law exponents, and whereφ0is assumed to equal 1 and will not be explicitly written in the following equations:
φ φ0 =φ.
soils on slopes is considered by using a coefficient that re-duces the Young’s modulus (e.g., Schwarz et al., 2010b):
E(φ)=rE0φβ, (4)
where the coefficient r ranges between 0.3 and 0.5. This coefficient does not affect the estimation of the maximum tensile force of a root, only the stretching (displacement) at which the maximum force is observed. In this study we back-calculate the apparent value of the secant Young’s modulus from field pullout tests using only measured displacement and tensile force (see Schwarz et al., 2010b).
Using Eqs. (1) and (4) together with the equation of elas-ticity, the tensile force,F, in a single root as a function of displacement,1x, is
F (φ, 1x)=rπ E0 4L0
φ2+β−γ1x, F (φ, 1x) < Fmax(φ), (5)
and the displacement,1xmaxfit , at which that root fails is
1xmaxfit (φ)=4F0L0 rπ E0
φγ+ξ−β+2. (6)
2.2 Weibull survival function for roots
A survival function, also known as a complementary cumu-lative distribution function, is a probability function used in a broad range of applications that captures the failure proba-bility of a complex system beyond a threshold. The Weibull distribution originates from the study of fatigue (Weibull, 1939) and is used in engineering as the time to failure or in biological systems as a survivorship curve (Pinder et al., 1978). The Weibull is adaptable to many scientific applica-tions and particularly to the study of fiber failure (e.g., Curtin and Takeda, 1989) and roots (Pollen and Simon, 2005; Cohen et al., 2011).
We hypothesize that the probability of a root to survive is a function of a normalized displacement,1x∗, and is given by the two-parameter Weibull survival function
S(1x∗)=exp
− 1x∗
λ∗ ω
, (7)
whereω is the Weibull exponent (shape factor) andλ∗ the scaling factor. The normalized displacement is given by
1x∗(φ)= 1x 1xfit
max(φ)
. (8)
This normalization, which eliminates the effect of root di-ameter on maximum displacement, is needed to construct a survival function whereω expresses the relative variability of root strength independently of root diameter.
2.3 Root bundle reinforcement
The tensile force (root reinforcement) of a bundle of roots is obtained by summing the force contributions from each root multiplied by the survival functionS
Ftot(1x)=
N
X
i=1
F (φi, 1x) S(1xi∗), (9)
whereN is the number of roots. This new extension of the RBM is called RBMw.
Equation (9) can be rewritten considering the number of roots (n) in a given root diameter classes (8) of a bundle in the form
Ftot(1x)=
8max
X
8=1
n8F (φ8, 1x) S(1x8∗), (10)
whereφ8 is the mean root diameter of each root diameter
class,8maxis the maximum root diameter class considered, and1x8∗ is the normalized displacement of each root diam-eter class8.
The RBMw was implemented in a R code and can be downloaded at the following link: www.ecorisq.org/ openFTP/Schwarz.zip.
2.4 Calibration of the survival function
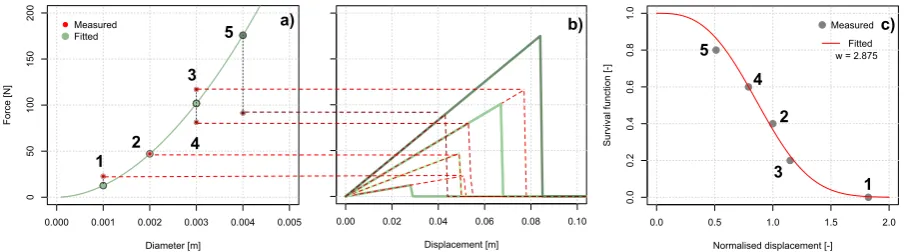
Fitting of the Weibull exponent for a data set of field pullout or laboratory tensile experiments is the novelty of this new RBMw approach. To illustrate the method, we use a small hypothetical data set of five pullout experiments with root diameter ranging from 1 to 4 mm. Figure 1a shows the mea-sured (Fmeas) and the fitted (Ffit) values of maximum pull-out/tensile force as a function of root diameter. Each mea-surement is represented by a red dot and labeled with a num-ber ranging from 1 to 5. Using Eq. (5), we compute the force-displacement for each root (Fig. 1b), assuming either the measured (red dashed lines) or fitted (green lines) values of maximum pullout force (see Table 1, column 3 and 4). To obtain the Weibull exponentωand the scaling factorλ∗ of the Weibull survival function (Eq. 7), we first rank roots in ascending order (Table 1, column 8) according to the nor-malized failure displacement (Table 1, column 7)
1xmax∗ = 1x meas max
1xfit max(φ)
, (11)
where
1xmaxmeas=4LF meas max
π φ2rE (12)
and we compute their survival probability (Table 1, column 9) of each root using the following equation
S=1−nAO ntot
0.000 0.001 0.002 0.003 0.004 0.005
0
50
100
150
200
Diameter [m]
F
orce
[N
]
Measured
Fitted
0.0 0.5 1.0 1.5 2.0
0.0
0.2
0.4
0.6
0.8
1.0
Normalised displacement [-]
Su
rvi
va
l f
un
ct
io
n
[-]
Measured
Fitted
w = 2.875
0.00 0.02 0.04 0.06 0.08 0.10
0
50
100
150
200
Displacement [m]
F
orce
[N
]
1 2
3
4 5
1 2
3 4 5
[image:4.595.73.528.63.189.2]a) b) c)
Fig. 1. The plots show key steps for the calibration of the Weibull exponent of the normalized survival function. The root diameter – pullout force plot (a) shows measured (red dots) and fitted values (green dots) of the five roots. (b) shows the calculated force-displacement of each single root in the bundle considering either the measured (red dashed lines) or the fitted (green lines) values of maximum pullout force. (c) shows the data (gray dots) and best fit (solid line) of the distribution of the survival probability as function of the normalized displacement.
wherenAOis the ranking of roots in ascending order andntot is the total number of roots.
Then we fit the data (Fig. 1c) with Eq. (7) to obtainωand
λ∗by minimizing the residual standard error.
Table 1 summarizes all values calculated for the five roots. In the example, the 1 mm diameter root has a measured pull-out force higher than the fitted value, the 2 mm diameter root has exactly the same value of measured and fitted pullout force, the two 3 mm diameter roots have measured pullout force values one higher and one lower than the fitted value, and the 4 mm diameter root has a measured pullout force value lower than the fitted one. Once the normalized dis-placement is calculated, pullout force measurements lower than the fitted curve in Fig. 1a have values lower than 1 (points 4 and 5 in Fig. 1c). Vice versa, all pullout force mea-surements higher than the fitted curve in Fig. 1a have values higher than 1 (points 1 and 3 in Fig. 1c). Because the mea-sured and the fitted value of pullout force for the 2 mm diam-eter root are identical, the normalized displacement is equal to 1. In this application we fitted the normalized survival function using all root diameter data, but a single root diame-ter class could be used if data are sufficient. In the hypotheti-cal case that all measurements fit perfectly the force-diameter power-law equation, all normalized displacement would be equal to 1 and the Weibull exponent would be infinity.
3 Results
3.1 Data and calibration of root parameters and
survival function
To estimate parameters of the tensile force power-law func-tion (Eq. 2), we use three sources of data obtained from the roots of Spruce (Picea abies L.). Data from field pull-out tests on bundle of roots done by Schwarz et al. (2011) at Üetliberg were used to compare the behavior of single roots and bundle of roots. In these tests, 5 or more roots with
diameters ranging from 0.9 to 3.7 mm were pulled in paral-lel with a testing machine. In order to compare the results of the maximum pullout force with data obtained in laboratory, we performed 43 tensile tests with root segments excavated at the same location where the pullout tests were performed (a forested site dominated by Spruce at Üetliberg near Zürich (Switzerland)−47.349◦N, 8.491◦E; – at 860 m a.s.l.). Roots were cleaned and cut by hand and stored in a solution with 10 % ethanol at 4◦C (Bischetti et al., 2005), and tensile tests carried out with a universal testing machine (LF-Plus
Chatil-lon) at the Department of Agriculture at the University of
Sassari, Italy, within one week of sampling. Root diameter ranged from 0.6 to 2.8 mm. Finally, to complement the upper range of root diameter, we include in our analysis 53 mea-surements of root tensile strength from laboratory tests by Ammann et al. (2009) for the same species but from a dif-ferent study site in Switzerland (Gandberg, Schwanden GL). Their root diameter ranged from 3.5 to 10 mm.
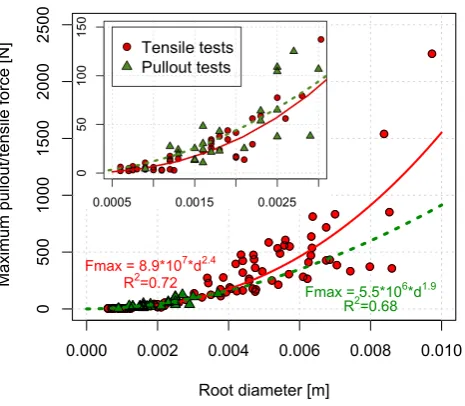
Figure 2 shows measured tensile forces in roots from lab-oratory and field pullout tests. Regression of the data yields
ξ=2.4 andF0=8.9×10⁷N for laboratory tensile tests, and
ξ=1.9 and F0=5.5×10⁶N for the field pullout experi-ments. Tensile force is highly variable in both types of exper-iments (nonlinear regressions coefficients of 0.72 and 0.88 for laboratory and field tests, respectively).
Results indicate that the power-law functions of both types of measurements yield larger values than those reported in previous studies in Europe (Bischetti et al., 2005) but similar to second-order polynomial fits of Schmidt et al. (2001) for plants in the Oregon Coast Range as reported in Schwarz et al. (2012).
Data on Young’s modulus for roots are scarce. Thus, we back-calculate it from field pullout tests on Spruce using only measured displacement and tensile force (see Schwarz et al., 2010b). This yieldsβ= −0.3 andE0=0.248×10⁸Pa.
Table 1. Summary of computed values used in the example of Fig. 1.
Ascending Survival
ID 8 Fmeas Ffit 1x 1xmaxfit 1xmax∗ order of probability
no. [m] [N] [N] [m] [m] [–] 1x∗max[–] [–]
1 0.001 22.7 12.6 0.051 0.028 1.8 5 0
2 0.002 47.1 47.1 0.049 0.049 1 3 0.4
3 0.003 117 101.8 0.077 0.067 1.15 4 0.2
4 0.003 81.4 101.8 0.053 0.067 0.8 2 0.6
5 0.004 91.4 175.8 0.043 0.084 0.5 1 0.8
0.000 0.002 0.004 0.006 0.008 0.010
0
500
1000
1500
2000
2500
Root diameter [m]
Ma
xi
mu
m
pu
llo
ut
/te
nsi
le
fo
rce
[N
]
Fmax = 8.9*107*d2.4 R2=0.72
[image:5.595.311.546.209.412.2]Fmax = 5.5*106*d1.9 R2=0.68
Fig. 2. Maximum measured tensile forces of Spruce roots (Picea
abies L.) as a function of root diameter. Green triangles are data from field pullout experiments (Schwarz et al., 2011) and red circles are data of laboratory tensile tests. The red line is the fit for the lab-oratory tests; the green dashed line is the fit of the field tests, extrap-olated to diameters larger than 0.004 m for comparison purposes.
roots (Schwarz et al., 2011; Giadrossich et al., 2013) which, when combine together, yieldγ=0.575 andL0=18.5 m.
With the root parameters now calibrated, it is possible to explore the force-displacement behavior of a single root diameter class and the effects of root-strength variability using the survival function. Figure 3 shows Eq. (9) for one root (N=1) for three values of the Weibull exponent (ω=2,10,100, respectively dotted, dashed, and solid lines) for three root diameter class (1, 2, and 3 mm, respectively red, black and blue). Also shown in Fig. 3 are the field-measured mean and standard deviation of the maximum pull-out force and the displacement at maximum pullpull-out force for these three root diameter classes (points and error bars; see Schwarz et al., 2011, for original data). The three curves show the sensitivity of the model to the values of the ex-ponentω. Forω=100, which indicates little variability in root mechanical behavior within a diameter class, the model
0.00 0.05 0.10 0.15
0
20
40
60
80
100
120
Displacement [m]
Pu
ll
o
u
t
fo
rc
e
[N
]
1 mm 2 mm
3 mm
Fig. 3. Force-displacement behavior of 1 (red), 2 (black) and 3 (blue) mm diameter root classes. Points and error bars indicate mean and standard deviation measured in field pullout experi-ments (Schwarz et al., 2011). Curves show the modeled
force-displacement for three values of the Weibull exponent,ω=2
(dot-ted line),ω=10 (dashed line), andω=100 (solid line).
reproduces the average value of the root diameter class to-gether with linear increase in force with displacement until failure expected from a single root. For decreasing values of ω, the curves become smoother, revealing the increased variability of root strength within a diameter class and result-ing in a maximum force much lower than the average with a spread of the reinforcement force over a much larger range of displacement. Although the calculation useN=1, these smoother curves should not be interpreted as the behavior of a single root, but as the mean behavior of many roots belong-ing to one diameter class.
0.0 0.5 1.0 1.5 2.0 2.5 3.0
0.0
0.2
0.4
0.6
0.8
1.0
Normalised displacement [-]
Su
rvi
va
l f
un
ct
io
n
[-]
data best fit
Weibull survival functions
w =2 5 10 100
[image:6.595.50.285.61.264.2](!* =1.25, " =2.31)
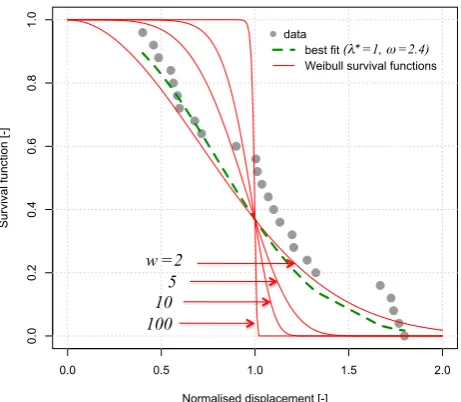
Fig. 4. Survival function for laboratory tensile test data. Gray dots are measurements, the green dashed line shows the best fit using a
Weibull exponentω=2.31 and a normalized scaling factorλ∗=
1.25. Red lines show the survival functions forω=2,5,10,100.
factor for the best fits results forλ∗=1.25 and 1 for labora-tory and field data, respectively.
3.2 Model validation: root-bundle reinforcement
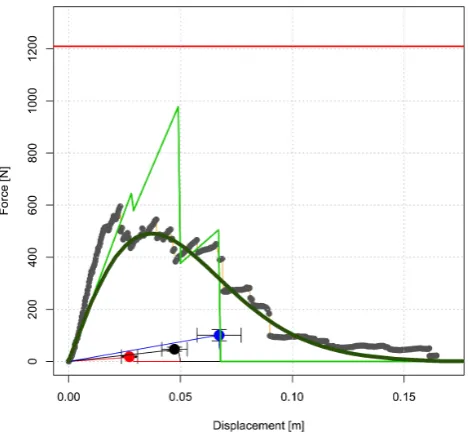
Considering the root diameter distribution of a bundle of roots it is possible to calculate the force-displacement behav-ior for the whole bundle, a quantity that is meant to charac-terize the root reinforcement under tensile loading. Figure 6 shows how the mechanical behavior of a bundle of roots may change for different values of the Weibull exponent (w=2 andw=100) and how the model compares to the results of field pullout experiments of a bundle of roots (Schwarz et al., 2011). The measured behavior of the bundle shows a peak of pullout force of 600 N at a displacement of 0.02 m. The data show an almost linear increase up to the peak and a non–linear decay afterwords. The curve calculated with
ω=100 shows three sharp peaks corresponding to the failure of the three classes of root diameter that make up the bundle (0.001, 0.002, and 0.003 m). In this case the maximum pull-out force reaches almost 933 N at a displacement of 0.047 m, whereas for the curve obtained withω=2 the maximum pull-out force peaks at abpull-out 490 N at a displacement of 0.037 m. Forω=2.4 we obtain a maximum pullout force of 517 N at a displacement of 0.036 m. The same calculation using the model of Wu et al. (1979) would lead to a constant value of 1209 N (indicated in Fig. 6 as horizontal red line).
For the same conditions but changing the diameter-force equation (calibrated on the laboratory tensile tests, and not on the pullout experiments) would lead to a maximal pullout force of 349 N by a displacement of 0.027 m.
0.0 0.5 1.0 1.5 2.0
0.0
0.2
0.4
0.6
0.8
1.0
Normalised displacement [-]
Su
rvi
va
l f
un
ct
io
n
[-]
data best fit
Weibull survival functions
w =2 5 10 100
(!* =1, " =2.4)
Fig. 5. Survival function for the field pullout tests data. The gray points are the measured data, the green dashed line show the best fit
of the Weibull distribution (λ∗=1 andω=2.4), and the red lines
show the sensitivity of the Weibull function to the exponentω.
4 Discussion
4.1 Calibration and validation of the RBMw compared
to other models
The RBMw has two major advantages in comparison to the RBM (Schwarz et al., 2011): (1) it accounts for strength variability within root diameter classes, (2) the mathemati-cal formulation is simple and can be easily implemented in numerical models (only 4 equations, Eqs. 1, 2, 4 and 7). Un-like the RBM of Schwarz et al. (2011), the RBMw is effec-tive for bundles with numerous roots as it takes into account only the “mean” mechanical behavior of each root diame-ter class. For detailed analysis of the pullout behavior of a few roots, the RBM is more appropriate. Also, in contrast with the RBM, pullout mechanisms are not explicitly con-sidered in the RBMw. This is not a problem when calibration is performed using field pullout experiments. In that case, the fit of the force-diameter function considers both pullout and breakage.
Differences in calculated root reinforcement resulting from calibration of Eq. (6) with tensile or pullout tests, may be due to several factors: season of sampling, mechanisms of breakage, water content, and gauging length (Zhang et al., 2012). It is not possible in this study to identify quantitatively the main reasons. Further field pullout experiments are con-sidered the best data for a realistic calibration of the RBMw for specific conditions.
[image:6.595.314.545.64.265.2]Fig. 6. Measured and simulated force-displacement behavior of a bundle of roots. The gray points (linked by the orange line) are the measured data of field pullout experiments (Schwarz et al., 2011) for a root bundle composed by 7 roots of 0.001 m diameter, 13 roots with 0.002 m diameter, and 5 roots with 0.003 m diameter. The green lines show the prediction of the RBMw considering two values of the Weibull exponent, 100 (light green) and 2 (dark green). The red-black-blue lines and points show the behaviors of the sin-gle roots, as link to Fig. 4. The continuous red line on the top of the plot indicates the estimated value of root reinforcement using the Wu model (Wu et al., 1979).
mechanical interaction with each other. Giadrossich et al. (2013) have shown with laboratory experiments and numer-ical analysis that for realistic density of tree roots in a forest stand, the mechanical interaction between neighbor roots is minimal and thus its effects can be neglected in model such as the RBMw.
[image:7.595.313.547.62.246.2]The RBMw, as the RBM and other fiber bundle models (e.g., Pollen and Simon, 2005; Cohen et al., 2011), yields better estimates of the maximum force and the displacement at maximum force than the model of Wu et al. (1979). That model overestimates maximum force by 150 % (Fig. 6) and does not predict the displacement at maximum force because it assumes all roots break at the same time. When consid-ering different root distributions for a given root area ratio (RAR), the ratio of the maximum pullout force computed with the RBMw and the one computed with the model of Wu et al. (1979) is almost constant and is equal to about 0.4 (see Fig. 7). This result is valid when the roots making up the bundle have highly variable mechanical properties as indi-cated by a small Weibull exponent,ω, for example equal to 2 as in Fig. 7. Higher values ofω, which indicate more homo-geneous root mechanical properties, yield higher estimates of the maximum forces that tend towards the model of Wu et al. (1979). Lower values ofωcould lead to a ratio smaller
Fig. 7. Sensitivity analysis of the displacement-force curve of a bun-dle considering three different root distributions (see insert) with a constant root area ratio (RAR) equal to 0.01, calculated with the RBMw and the Wu model. All the geometric and mechanical pa-rameters were kept constant.
than 0.4, as also shown by Cohen et al. (2011). A sensitivity analysis ofωis shown in Fig. B1.
4.2 Calibration of the survival function
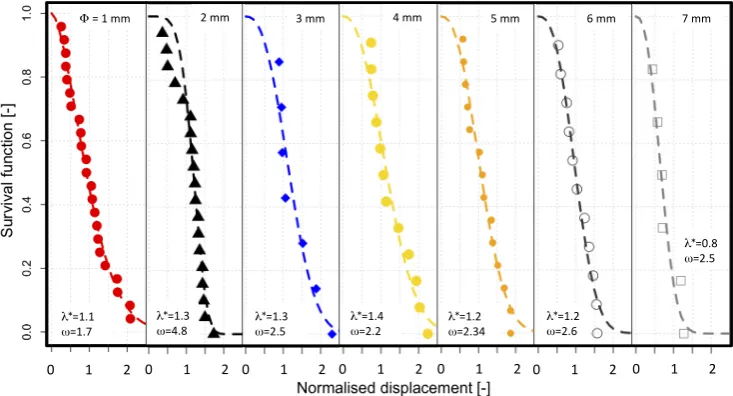
Figure 8 shows the survival function for each root diameter class. Values ofωvary from 1.7 to 4.8 but for most diameter classes values are between 2 and 2.5. Intuitively, one could assume that the value ofωshould decrease with increasing root diameter classes because of the higher probability for larger diameter classes to have “weak spots” related to the anatomy and geometry of the roots (Ammann et al., 2009). It appears that this effect is masked because of the normaliza-tion of displacement with the maximum fitted displacement (Eq. 11). Thus the probability of having “weak spots” seems to be related to root length rather than to root diameter.
!"""""""""#"""""""""$" !"""""""""#"""""""""$" !"""""""""#"""""""""$" !"""""""""#"""""""""$" !"""""""""#"""""""""$" !"""""""""#"""""""""$" !"""""""""#"""""""""$"
!%"#"&&" $"&&" +"&&" *"&&" )"&&" ("&&" '"&&"
"*%#,#"
#%#,'" "
*%#,$"
#%$,("
"*%#,$"
#%$,+*"
"*%#,*"
#%$,$"
"*%#,+"
#%$,)"
"*%#,+"
#%*,-"
"*%!,-"
[image:8.595.115.482.63.261.2]#%$,)"
Fig. 8. Survival function calculated for the tensile tests data of each single root diameter class (from 1 to 7 mm).
surprisingly different results (see Appendix A). This factor also affects the power-law fittings of Eqs. (1) and (3).
4.3 Data collection for the calibration of the RBMw
The use of field experiments for calibration is considered the most appropriated for model calibration. Furthermore, by using field measurements, one could forgo root length data and secant Young’s modulus calculations by using Hooke’s law for elasticity which directly relates force to displacement through a spring constant:
F (φ, 1x)= H (φ) 1x, (14)
whereH (φ)corresponds to a spring constant as a function of root diameterφ, which summarizes the mechanical prop-erties of the root-soil system under specific conditions (root diameter, tree species, stand, soil type, and moisture condi-tions). The application of the Hooke’s law would simplify the calculation and reduce the number of parameter consid-ered in the calculation with the consequence to reduce the source of errors. This approach is possible only using time consuming and complicated field pullout experiments. This is probably one of the reasons why there is a big lack of data for this type of experiments and future works should focus on providing such data set for different tree species, especially testing large root diameters.
4.4 Implications of root reinforcement quantification in
hydrology and earth surface systems
The presented RBMw may find application in several types of data analysis and process modeling. The prediction of the pullout of riparian plants due to drag forces of water flow may be characterized with the RBMw using data of pullout experiments on single roots for the calibration, as shown in
Edmaier et al. (2012), and upscaled to entire root systems or root networks considering the distribution of roots and the variability of the root-soil mechanical properties. Conse-quently, the RBMw could allow the implementation of root reinforcement in models for the simulation of long-term flu-vial morpho-dynamics. In an analogous way, the quantifi-cation of root reinforcement distribution within root system could be applied in models for the study of tree stability during wind storms or rock fall impacts. Overall, the ad-vantages quantifying root reinforcement in term of force-displacement behavior with a minimal computational effort makes the RBMw attractive for its implementation in slope stability model at large temporal and spatial scales.
illustrated in this work calibrated with pullout data can be ap-plied to characterize the reinforcement of roots in soil loaded under compression (Schwarz and Cohen, 2011). The real-istic quantification of root reinforcement for tensile, shear and compression behavior allows a more complete consid-eration of the stabilization effects of root networks on steep slopes (Schwarz et al., 2012) and the influence that this has on the triggering of shallow landslides (Schwarz and Cohen, 2011). The calibration of the RBMw for different condition of soil and vegetation, and thus the quantification of root re-inforcement for different type of forests, supports the ratio-nal formulation of guidelines for the management of protec-tion forests and the consideraprotec-tion of vegetaprotec-tion effect in cost-benefit analysis in landslide risk management.
5 Conclusions
A new approach for a realistic quantification of root rein-forcement that considers the strength variability of each root diameter class by the application of a Weibull survival func-tion is presented. The results show the importance of consid-ering strength variability for the upscaling of root reinforce-ment for root bundles with numerous roots, in particular for the overall quantification of the displacement-force behavior instead of only the estimation of a maximum pullout force of the bundle. Further analysis of new experimental data should be considered for calibration and validation of the model for a different combination of factors such as the type of pull-out/tensile tests, method to fit diameter-force data, and num-ber of replications. The calibrated values ofω, for both ten-sile tests and pullout tests data are approximately equal to 2, and detailed analysis have shown that the estimated values of
ωis not diameter dependent, which simplify the application of the RBMw model. For constant RAR the maximum root reinforcement does not change significantly forω=2 and for substantial heterogeneous different root distributions.
[image:9.595.313.546.59.276.2]The importance to consider the progressive failure of roots due to a heterogeneous distribution of root diameters was recognized in previous works motivating the application of FBM approaches instead of simpler models (i.e., Wu et al., 1979). Following the same motivation, this work demon-strates that the variability of root strength within a narrow range of root diameters strongly influence the progressive failure of a root bundle under tension. This results may be important in particular for the application of the FBM for the estimation of herbaceous root reinforcement (numerous roots in a small range of root diameter classes) or for the characterization of root reinforcement at large spatial scales where the mechanical behaviors of single roots present a high variability. The RBMw allows a more complete force-displacement characterization of root reinforcement for a bundle of roots compared to simpler models (i.e., Wu) with only a few more parameters, and at the same time performs
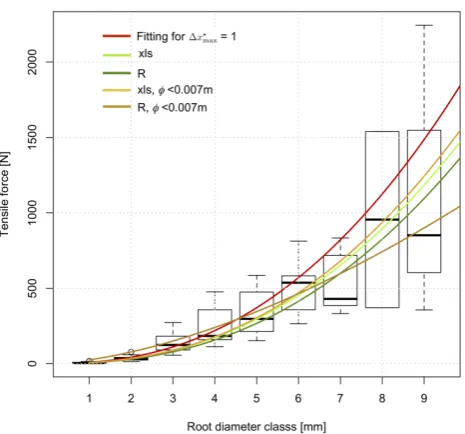
Fig. A1. Boxplot of the maximal tensile force measurement in func-tion of root diameter classes. The three different fitting curves cor-respond to the fit of all data (light green = xls, dark green = R), the fit of data up to 0.007 m diameter (light orange = xls, dark orange = R), and finally the iteratively fitted curve to obtain a normalized fail-ure displacement equal to 1 (red). (n1 = 23, n2 = 17, n3 = 7, n4 = 12, n5 = 14, n6 = 11, n7 = 6, n8 = 2, n9 = 3).
predictions comparable to more complicated models such the original version of the RBM (Schwarz et al., 2010c).
The findings of the present study provide useful informa-tions (calibrated parameters) and tools (the RBMw) for the quantification of root reinforcement, which is a key factor for the understanding of numerous processes in hydrology and earth surface systems.
Appendix A
Sensitivity of the RBMw to power law fitting of the root diameter – force data
0.0 0.1 0.2 0.3 0.4 0.5
0
50000
100000
150000
Displacement [m]
F
orce
[N
[image:10.595.50.285.70.233.2]]
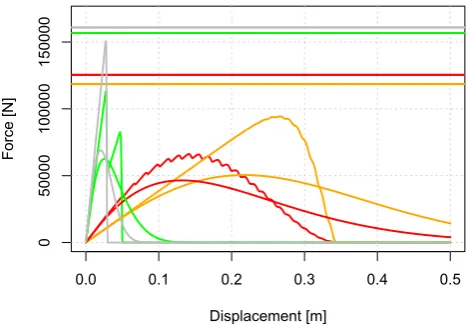
Fig. B1. Sensitivity analysis of the displacement-force curve of root bundles considering different root distribution (red = RD1 in Fig. 6, orange = RD3 in Fig. 6, green= two root diameter class distribu-tion, gray = one root diameter class distribution) with a constant root area ration (RAR) equal to 0.01, calculated with the RBMw and the Wu model. For the calculation with the RBMw a value of 2 (lower
curve) and 100 (upper curve) were used for the exponentω.
Appendix B
RBMw and Wu model
As mentioned in the discussion, it seems to be acceptable to assume a constant reduction coefficient to estimate the maxi-mum pullout force of a root bundle using the Wu model under certain conditions (heterogeneous root diameter distributions and high number of total roots in the bundle), as discussed in Bischetti et al. (2009). Figure B1 shows that the applica-tion of aωexponent equal to 2 strongly stabilize the value of the reduction coefficient compared to a value ofω=100 that leads to variable and lower values of the reduction co-efficient. Moreover, the results show that the coefficient de-creases considerably for narrow distributions of root diam-eter classes. In any case, the application of the Wu model implies no characterization of stiffness and total energy of root reinforcement, which are fundamental information for scientific applications.
Acknowledgements. M. Schwarz and D. Cohen thank the Uni-versity of Sassari, Sardegna. Italy, for the support of the Visiting Professor program.
Edited by: N. Romano
References
Ammann, M., Böll, A., Rickli, C., Speck, T., and Holdenrieder, O.: Significance of tree root decomposition for shallow landslides, For. Snow Landsc. Res., 82, 79–94, 2009.
Bathurst, J. C., Moretti, G., El-Hames, A., Beguería, S., and García-Ruiz, J. M.: Modelling the impact of forest loss on shallow land-slide sediment yield, Ijuez river catchment, Spanish Pyrenees, Hydrol. Earth Syst. Sci., 11, 569–583, doi:10.5194/hess-11-569-2007, 2007.
Bischetti, G. B., Chiaradia, E. A., Simonato, T., Speziali, B., Vitali, B., Vullo, P., and Zocco, A.: Root strength and root area ratio of forest species in Lombardy (Northern Italy), Plant Soil, 278, 11–22, 2005.
Bischetti, G. B., Chiaradia, E. A., Epis, T., and Morlotti, E.: Root cohesion of forest species in the Italian Alps, Plant Soil, 324, 71–89, 2009.
Cohen, D., Schwarz, M., and Or, D.: An analytical fiber bundle model for pullout mechanics of root bundles, J. Geophys. Res., 116, F03010, doi:10.1029/2010JF001886, 2011.
Curtin, W. A. and Takeda, N.: Tensile Strength of
Fiber-Reinforced Composites: I. Model and Effects of
Lo-cal Fiber Geometry, J. Compos. Mater., 32, 2042–2059, doi:10.1177/002199839803202203, 1998.
Czarnes, S., Hiller, S., Dexter, A. R., Hallett, P. D., and Bartoli, F.: Root:soil adhesion in the maize rhizosphere: the rheological approach, Plant Soil, 211, 69–86, 1999.
Edmaier, K., Burlando, P., and Perona, P.: Mechanisms of vegeta-tion uprooting by flow in alluvial non-cohesive sediment, Hy-drol. Earth Syst. Sci., 15, 1615–1627, doi:10.5194/hess-15-1615-2011, 2011.
Edmaier, K., Crouzy, B., Perona P., and Burlando, P.: Experimen-tal characterization of root anchoring in non-cohesive sediment, RiverFLow 2012, 1, 617–622, 2012.
Giadrossich, F., Schwarz, M., Cohen, D., Preti, F., and Or, D.: Me-chanical interactions between neighbouring roots during pullout tests, Plant Soil, 367, 391–406, doi:10.1007/s11104-012-1475-1, 2013.
Hesse, R.: Incorrect Nonlinear Trend Curves in Excel, FORE-SIGHT: Int. J. Appl. Forecast., 3, 39–43, 2006.
Loades, K. W.: Quantifying soil reinforcement by fibrous roots, Ph.D thesis, University of Dundee, UK, 241 pp., 2007.
Loades, K. W., Bengough, A. G., Bransby, M. F., and Hallett, P. D.: Planting density influence on fibrous root reinforcement of soils, Ecol. Eng., 36, 276–284, 2010.
Loades, K. W., Bengough, A. G., Bransby, M. F., and Hallett, P. D.: Reinforcement of soil by fibrous roots, Enhancing Understanding and Quantification of Soil–Root Growth Interactions, 197–228, doi:10.2134/advagricsystmodel4.c9, 2013.
Operstein, V. and Frydman, S.: The influence of vegetation on soil strength, Ground Improvement, 4, 81–89, 2000.
Petrone, A. and Preti, F.: Suitability of soil bioengineering tech-niques in Central America: a case study in Nicaragua, Hy-drol. Earth Syst. Sci., 12, 1241–1248, doi:10.5194/hess-12-1241-2008, 2008.
Pinder, J. E., Wiener, J. G., and Smith, M. H.: The Weibull distribu-tion: A new method for summarizing survivorship data, Ecology, 59, 175–179, 1978.
Pollen, N. and Simon, A.: Estimating the mechanical ef-fects of riparian vegetation on stream bank stability us-ing a fiber bundle model, Water Resour. Res., 41, W07025, doi:10.1029/2004WR003801, 2005.
Rickli, C. and Graf, F.: Effects of forests on shallow landslides – case studies in Switzerland, For. Snow Landsc. Res., 82, 33–44, 2009.
Schwarz, M. and Cohen, D.: Influence of root distribution and com-pressibility of rooted soil on the triggering mechanism of shallow landslides, Geophys. Res. Abstr., EGU2011-4817, EGU General Assembly 2011, Vienna, Austria, 2011.
Schwarz, M. and Thormann, J. J.: Neue Ansätze zur Quantifizierung der Schutzwaldwirkung, Geosciences, 2, 26–29, 2012.
Schwarz, M., Preti, F., Giadrossich, F., Lehmann, P., and Or, D.: Quantifying the role of vegetation in slope stability: A case study in Tuscany (Italy), Ecol. Eng., 36, 285–291, doi:10.1016/j.ecoleng.2009.06.014, 2010a.
Schwarz, M., Lehmann, P., and Or, D.: Quantifying lateral root rein-forcement in steep slopes – from a bundle of roots to tree stands, Earth Surf. Proc. Land., 35, 354–367, 2010b.
Schwarz, M., Cohen, D., and Or, D.: Soil-root mechanical interac-tions during pullout and failure of root bundles, J. Geophys. Res., 115, F04035, doi:10.1029/2009JF001603, 2010c.
Schwarz, M., Cohen, D., and Or, D.: Pullout tests of root analogs and natural root bundles in soil – experiments and modeling, J. Geophys. Res., 116, F02007, doi:10.1029/2010JF001753, 2011. Schwarz, M., Cohen, D., and Or, D.: Spatial
character-ization of root reinforcement at stand scale: Theory
and case study, Geomorphology, 171–172, 190–200,
doi:10.1016/j.geomorph.2012.05.020, 2012.
Schmidt, K. M., Roering, J. J., Stock, J. D., Dietrich, W. E., Mont-gomery, D. R., and Schaub, T.: The variability of root cohesion as an influence on shallow landslide susceptibility in the Oregon Coast Range, Can. Geotech. J., 38, 995–1024, 2001.
Sidle, R. C.: A theoretical model of the effects of timber harvesting on slope stability, Water Resour. Res., 28, 1897–1910, 1992. Waldron, L. J. and Dekessian, S.: Soil reinforcement by roots:
cal-culation of increased soil shear resistance from root properties, Soil Sci., 132, 427–435, 1981.
Weibull, W.: A statistical theory on the strength of materials, Ing. Vetenskaps Akad. Handl., 151, 1–45, 1939.
Wu, T. H., McKinnell, W. P., and Swanston, D. N.: Strength of tree roots and landslides on Prince of Wales Island, Alaska, Can. Geotech. J., 16, 19–33, 1979.